Introducción y objetivos: A pesar de disponer de una información limitada, el conocimiento de los niveles relativos del factor de crecimiento fibrobástico 23 (FGF 23), fosfato (P), calcio (Ca), paratohormona intacta (PTHi) y 25/1,25 vitamina D3 en cada momento evolutivo de la insuficiencia renal crónica ha aportado datos para sustituir o al menos modificar antiguos paradigmas. Se definen estadios más precoces, se señalan amplias implicaciones pronósticas y se sugieren nuevas intervenciones terapéuticas. Planteamos un estudio transversal-descriptivo y analítico de estos parámetros en una amplia muestra de enfermos distribuidos en todo el espectro de la enfermedad renal crónica. Material y métodos: Evaluamos los niveles de FGF 23 con un ELISA de segunda generación que mide molécula intacta (Kainos Laboratories, Japón) en un diseño transversal de una población adulta con todos los estadios de la enfermedad renal crónica basados en CKD-EPI junto a niveles de Ca, P, paratohormona y metabolitos de la vitamina D. Resultados: Estudiamos a 251 enfermos (146 hombres y 77 mujeres) con una edad promedio de 62,5 (desviación estándar [DE]: 11,5) años, siendo el 43% de ellos diabéticos. Los niveles de FGF 23 aumentan progresivamente; este cambio es significativo en el estadio 4 en relación con el 1 (110,61 vs. 31,32 ng/l). La PTHi muestra un comportamiento similar. La 1,25 vitamina D baja progresivamente hasta llegar en el estadio 4 a un cambio significativo. Los niveles de Ca no se modifican. Los niveles de 25 vitamina D3 son bajos en todo momento sin tender a un descenso progresivo. Los niveles de P no se modificaron hasta su aumento en el estadio 4. En el análisis multivariante, los niveles de FGF 23 se correlacionan negativamente con el filtrado glomerular (FG) y positivamente con la PTHi y el P. Conclusiones: A lo largo de la enfermedad renal crónica, los incrementos de FGF 23 y PTHi podrían ser los más precoces, seguidos del descenso de 1,25 dihidroxivitamina D3 (1,25 OHD3) y del incremento del P. El Ca y la 25 hidroxivitamina D3 no se modifican. Los niveles de FGF 23 muestran una sólida relación con el FG estimado, PTHi, 1,25 OHD3 y P.
Background and Objectives: The ample information available in relation to FGF 23, calcium, phosphorus, PTH, and 25/1,25 vitamin D has allowed us to define consistent values for each variable in each stage of chronic kidney disease (CKD). These values can define early stages, prognostic issues, and new treatment targets. We describe a cross-sectional study of these parameters in patients with different stages of CKD. Method: We measured FGF 23 by ELISA (intact molecule, Kainos Laboratory, Japan), calcium, phosphorus, PTH and vit D by standard methods. Results: We examined 251 patients, 146 of which were men, with a mean age of 62.5 (11.5) years and 43% prevalence of type II DM. Levels of FGF 23 rose progressively, in a very significant manner, in correlation with the evolution of CKD, especially in stage 4 as compared to stage 1 (110.61ng/L vs 31.32ng/L). The same happened with iPTH values. Additionally, levels of 1,25 vitamin D decreased in a similar manner. Calcium values did not change. 25 vit D3 levels were low at all times and showed no tendency for a steady decline. Phosphorus rose in stage 4 CKD. Levels of FGF 23 were negatively correlated with renal function indicators and positively correlated with PTH and P. Conclusions: During the evolution of CKD, changes of FGF 23 and PTH would be the earliest markers. Calcium and 25 vit D3 do not vary with changes in the progression of CKD. Values of FGF 23 show an important correlation with PTH, 1,25 vit D3, P and estimated glomerular filtration rate.
INTRODUCTION/OBJECTIVES
Our understanding of phosphocalcic metabolism in chronic renal failure has changed substantially in recent years. New advancements in the physiological and pathophysiological characteristics of this condition have pointed out new actors, facilitated earlier definitions of disease, provided several prognostic implications, suggested therapeutic interventions, and have replaced or at least modified many old paradigms.1
Despite the decrease in nephron mass, a dysfunctional kidney is still capable of effectively eliminating phosphate (P), with phosphataemia increasing only in very advanced stages of disease. Fibroblast growth factor 23 (FGF 23) is a protein synthesised in the osteocytes that inhibits proximal reabsorption of P, promotes a decrease in 1,25 (OH)2 vit D3 (calcitriol) by inhibiting renal 1-α hydroxylase, and blocks the synthesis/release of intact parathyroid hormone (iPTH).2 FGF 23 requires klotho, a protein involved in the aging process, as a requisite cofactor that converts its potential receptor into a highly specific target.
In recent years, we have advanced our understanding that altered phosphocalcic metabolism explains a considerable part of the elevated cardiovascular risk of patients with renal failure, in the form of morphologically and functionally altered large vessels through vascular calcification, endothelial dysfunction, and arterial rigidity.3 While FGF 23 may only represent a marker for phosphate load, clear evidence exists that suggests a direct toxic action on the blood vessels.4
Although the available information is limited, we know that relative levels of FGF 23, calcium (Ca), P, iPTH, and several different metabolites of vitamin D3 (25 hydroxyvitamin D [25 OHD3] and 1,25 dihydroxyvitamin D [1,25 OHD3]) vary consistently as chronic kidney disease (CKD) progresses. The temporal evolution of the disease reflects the categorisation of the mutual influences that govern these parameters.
We elaborated a cross-sectional, descriptive, and analytical study of these parameters in a large sample of patients with all different stages of CKD.
MATERIAL AND METHOD
We examined patients with CKD who were treated in our nephrological outpatient department within the last two years. We excluded all patients with rapidly progressing nephropathy or nephrotic syndrome and those receiving immunosuppressant treatment.
We evaluated renal function by calculating estimated glomerular filtration rate (eGFR) using the CKD-EPI formula.5 We staged renal failure using the five stages established by the K/DOQI giudelines.6 In stage five patients, we differentiated between predialysis situations (5a) and patients on renal replacement therapy (5b).
Blood samples were extracted and stored at -80 ºC until analysis. We measured Ca and P using standard procedures at our laboratory; iPTH was measured using ECLIA (electrochemiluminescence immunoassay, PTH Cobas®, Roche), with a normal range of 15-65pg/ml; 25 OHD3 was also measured using ECLIA (vitamin D3 [25-OH] Cobas®, Roche), with a normal range of 19.1-57.6ng/ml; 1,25 OHD3 was measured using radio-isotopes (DIAsource 1,25 [OH]2-VIT.D-RIA-CT®), with a normal range of 18-78pg/ml. Intact FGF 23 was measured using a second-generation ELISA (Kainos Laboratories, Japan). FGF 23 refer to a control sample from 136 healthy individuals, receiving no treatment whatsoever, with similar age and sex distributions to the treatment sample, with a mean value of 29.23ng/l (standard deviation: 8.3ng/l).
We obtained informed consent from all patients, and the study was approved by the hospital ethics committee.
We performed a descriptive and analytical statistical analysis using parametric and non-parametric tests based on the distribution of each variable. We used Spearman’s correlation tests to evaluate the relationship between continuous variables. We used one-way ANOVA tests to compare each variable in the different stages of CKD, along with a Sheffe test. The bivariate relationships between 1,25 OHD3, eGFR, and FGF 23 were modelled using a curvilinear regression model. The assumed relationship was modelled of the following equation: ln(y) = ln(b0) + (b1 ln(x)). We then constructed a generalised linear model to analyse the relationships between the primary variable of interest (FGF 23) and all other explanatory variables; continuous variables that did not have a linear relationship with the primary variable of interest (phosphorous, 1,25 OHD3 and eGFR) were transformed in order to create a linear relationship. For all analyses, we considered a P-value <.05 to be statistically significant. We used SPSS statistical software, version 17, for all analyses (SPSS, Chicago, IL, USA).
RESULTS
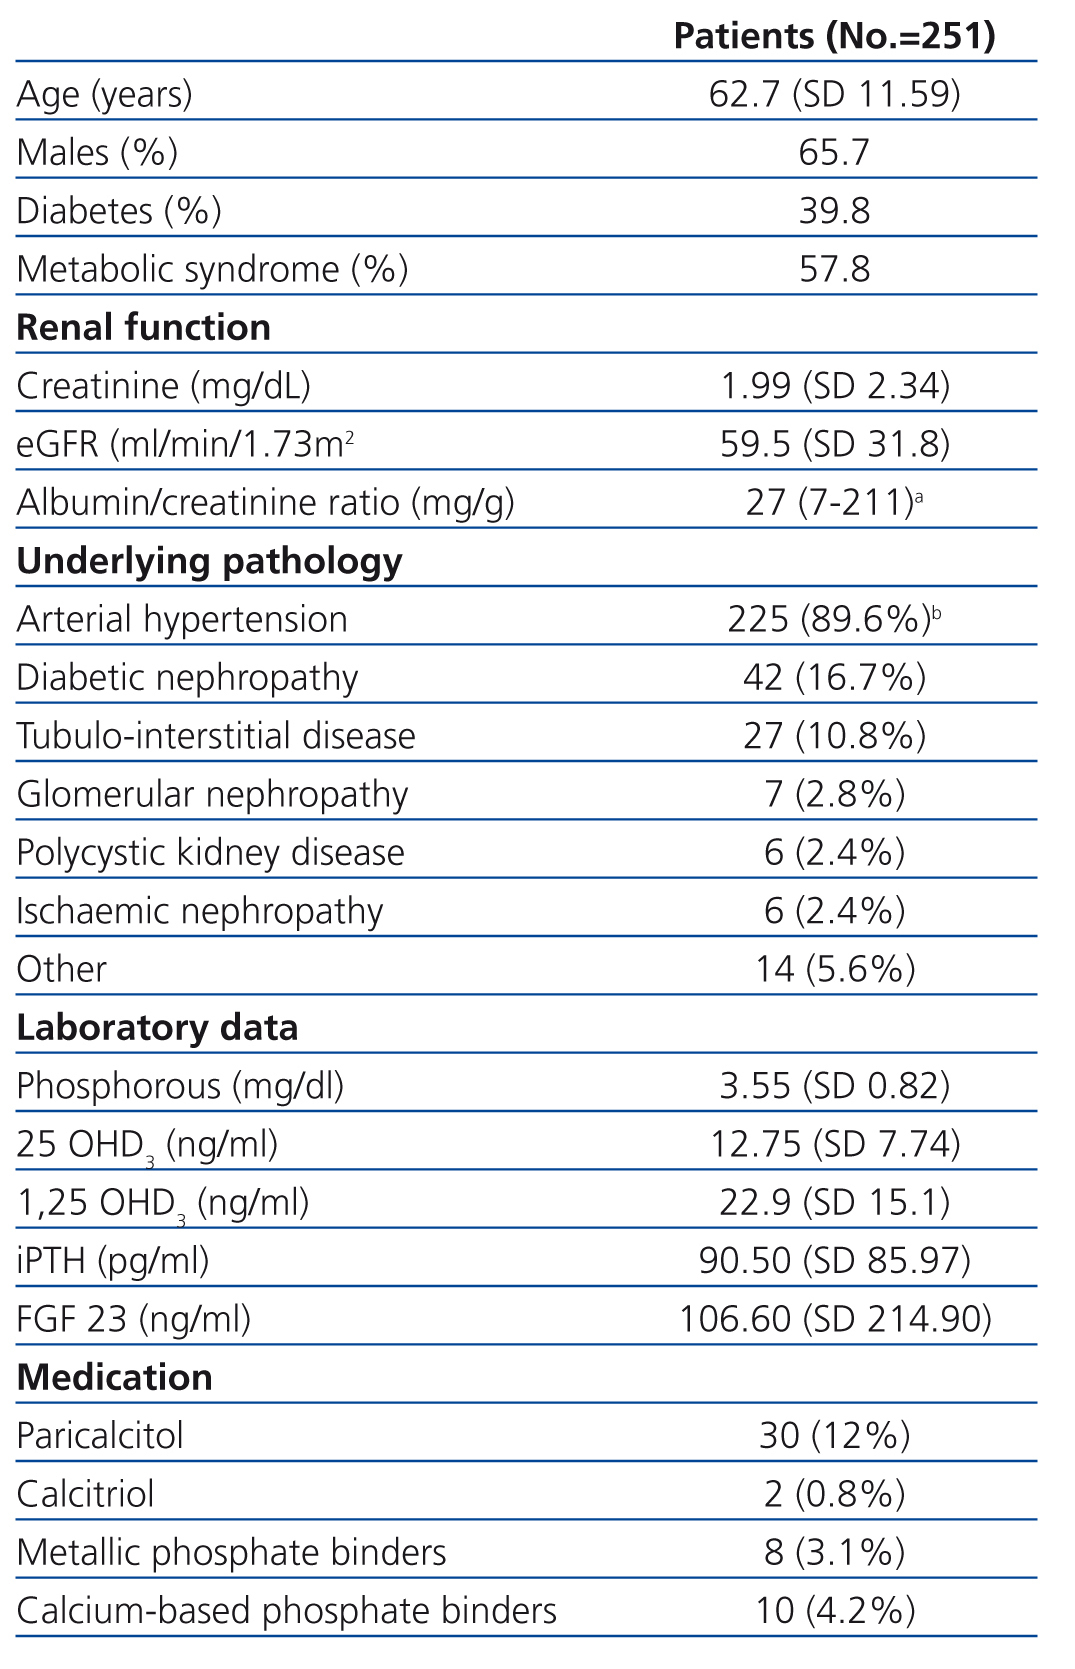
We evaluated a total of 251 patients with CKD ranging from stage 1 to stage 5. Their demographical, clinical, and laboratory variables, along with renal pathology and current treatment for phosphocalcic metabolism, are described in Table 1. We obtained reference values for FGF 23 from a sample of 26 healthy individuals.
Table 2 shows the results of the different phosphocalcic metabolism parameters during each stage of CKD.
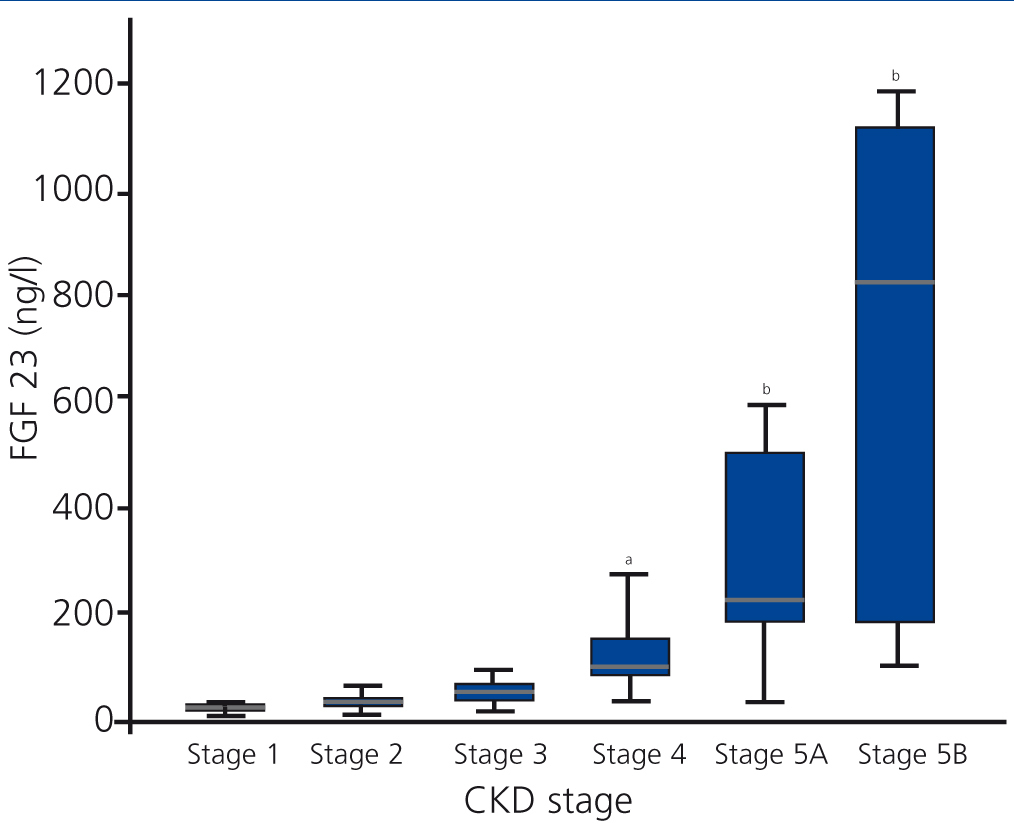
FGF 23 levels increased progressively with the stage of CKD (Figure 1), with a statistically significant difference observed when comparing stage 4 patients with stage 1 patients. FGF 23 levels in the healthy reference population were consistently lower.
iPTH showed a similar behaviour to FGF 23, with progressively higher values at more advanced stages of CKD and a significant difference reached in stage 4.
1,25 OHD3 decreased consistently, but the high level of variation prevented any statistically significant differences until stage 4 CKD.
We did not observe variations in Ca or 25 OHD3 over the spectrum of renal dysfunction. Ca was consistently normal and 25 OHD3 was consistently low.
P levels did not vary until stage 4, where values were higher than in stage 1.
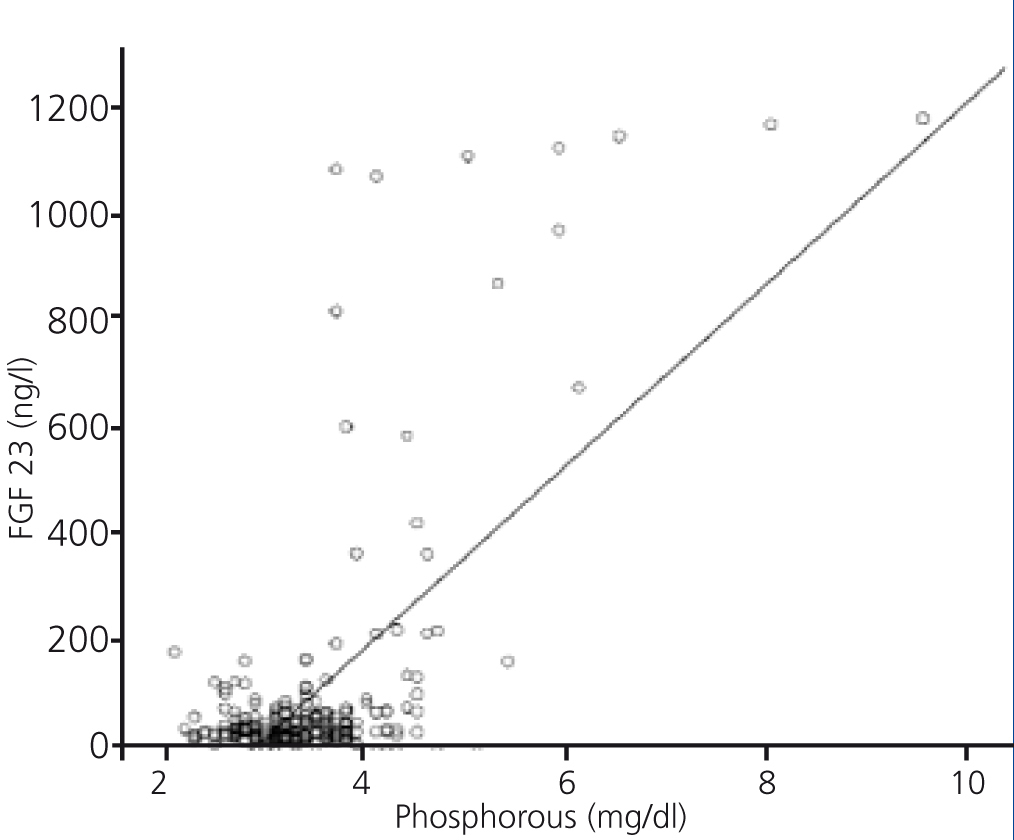
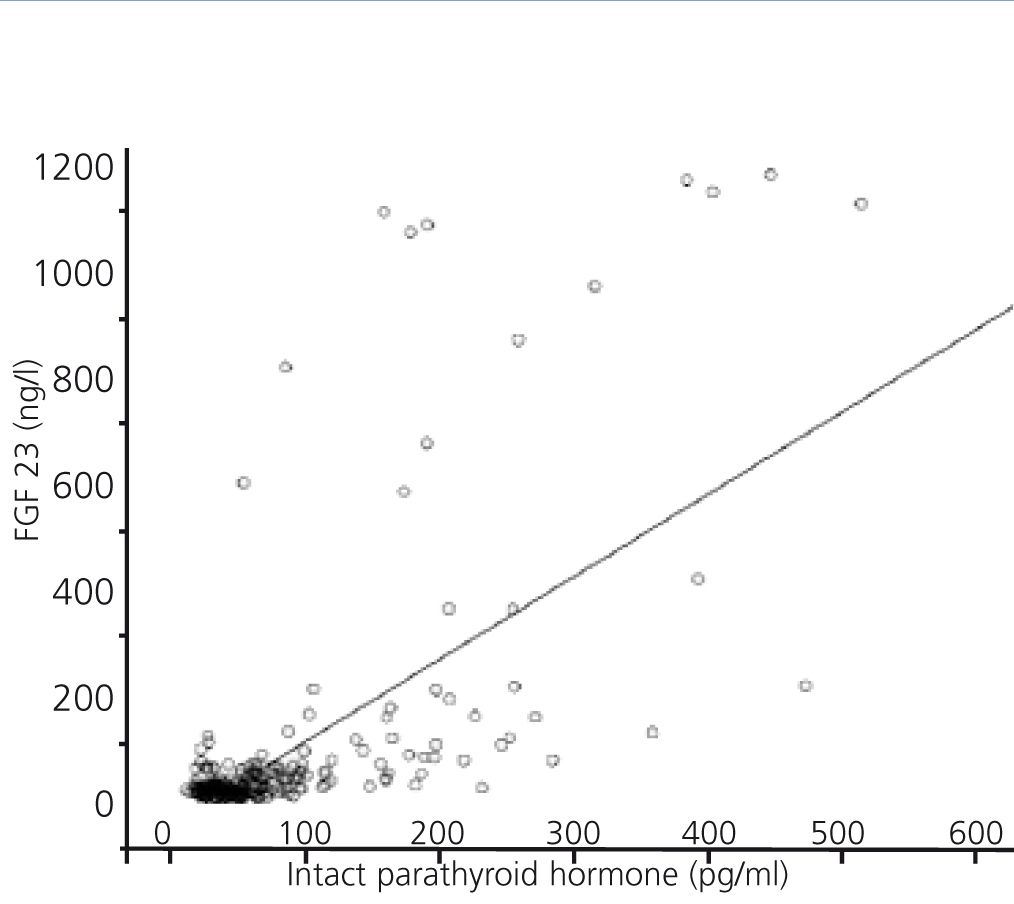
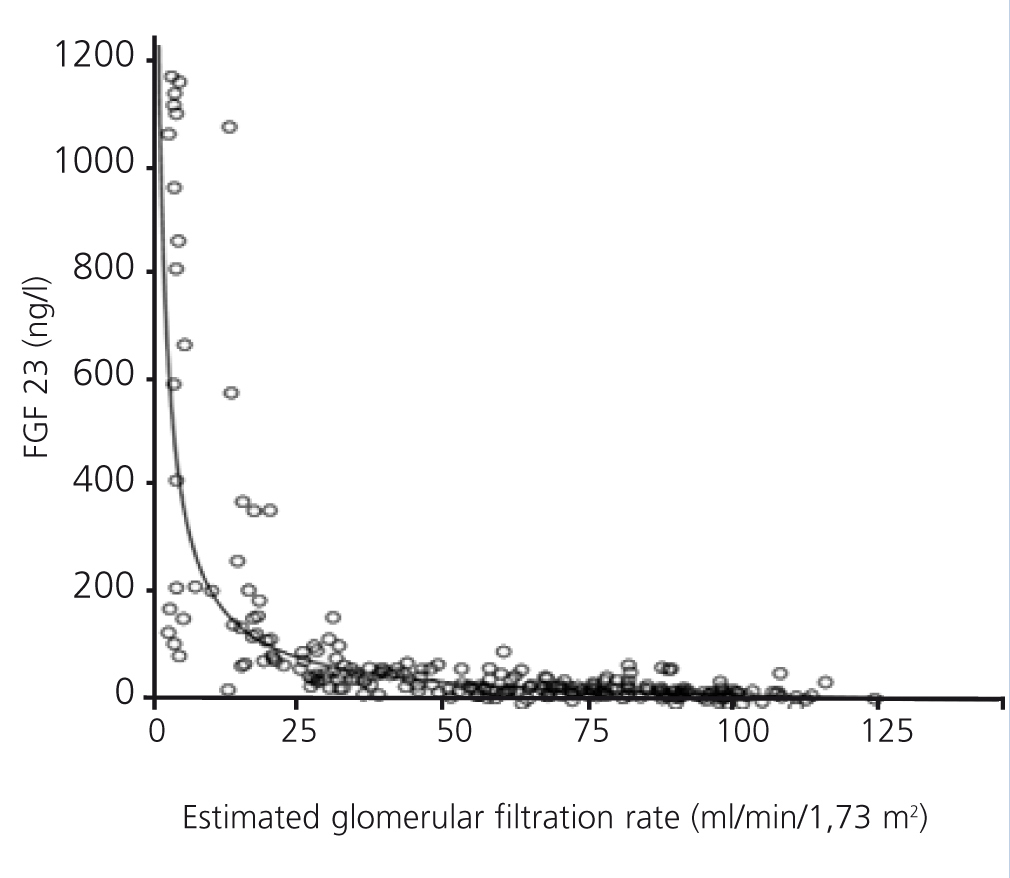
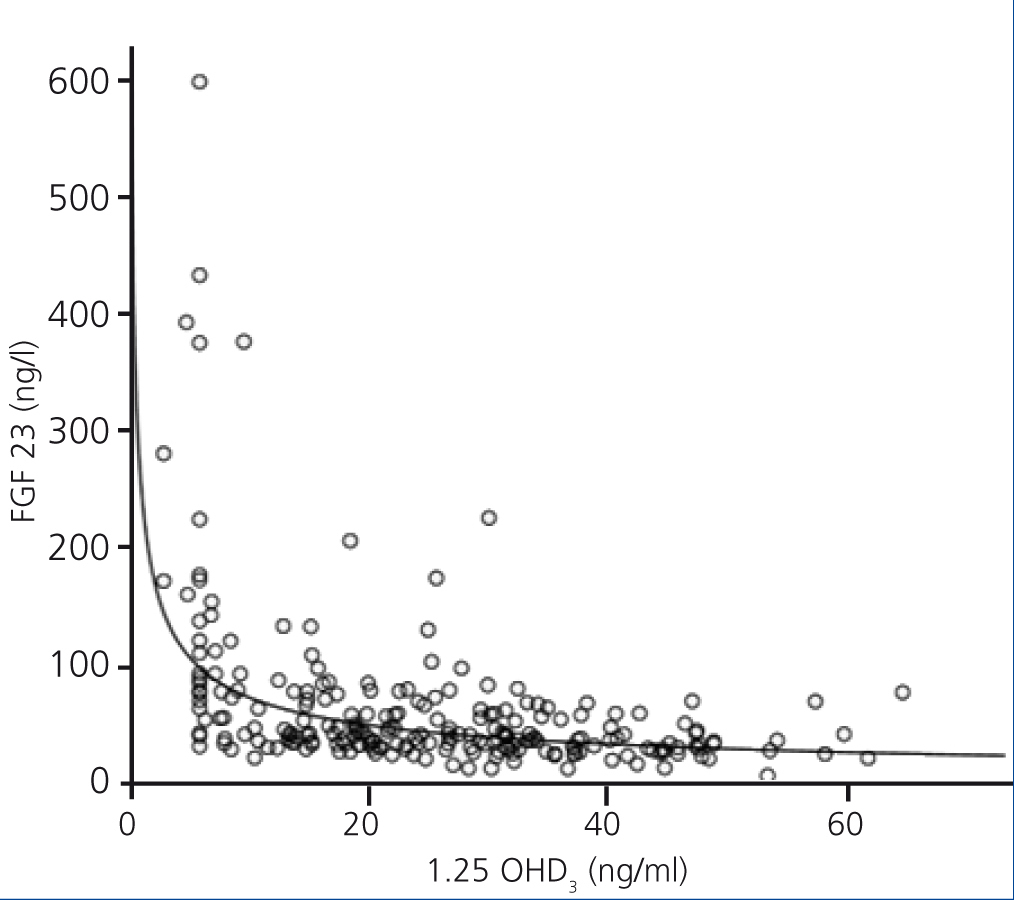
FGF 23 levels were positively correlated with P levels (Figure 2) and iPTH levels (Figure 3), and negatively correlated with glomerular filtration rate (GFR) (Figure 4) and 1,25 vit D3 (Figure 5).
In the multivariate analysis, P, iPTH, and GFR independently explained 55% of the variation in FGF 23 levels (Table 3).
Few patients were on active medication regimens (phosphate binders and vitamin D-based); most had stage 5 CKD (Table 1), and their exclusion from the analysis had no influence of study results.
DISCUSSION
FGF 23 has been described as an independent progression marker for chronic renal failure, as well as in diabetic patients.7 It is consistently associated with cardiovascular risk factors, such as left ventricular hypertrophy, atherosclerosis, and vascular dysfunction.8 Elevated levels are correlated with coronary damage and myocardial dysfunction.9 In the incident and prevalent population of patients on haemodialysis,10 these values express the risk of general morbidity/mortality, regardless of other measures of phosphocalcic metabolism. In a large, recent study, FGF 23 was demonstrated to be a strong predictor of mortality in CKD patients.11
According to the medical literature, FGF 23 levels increase progressively as CKD advances, to the point that patients on renal replacement therapy have levels 20 times higher. In the largest study published to date involving 3879 CKD patients of stages ranging from 2 to 4, FGF 23 reached a significant increase once GFR dropped 57.8ml/min/1.73m2 as compared to a healthy control population.12 When compared to stage 1 CKD, these differences become significant once stage 4 is reached,13 as occurred in our study, or stage 3.14 In other studies, increases have been observed in even earlier stages of CKD.15 In these phases, the nephron mass is already reduced, and the elevated levels of FGF 23 facilitate increased urine excretion of P.16 In any case, these early increases impact not only P load, but also the complex relationships between FGF 23 and klotho protein. If chronic renal failure is a state of deficient klotho expression, it will yield a relative resistance to FGF 23, which it turn will increase FGF 23 levels,17 although in contrast, it has also been described that elevated levels of FGF 23 decrease the expression of klotho.18
It has also been well demonstrated that iPTH levels increase in parallel to FGF 23 levels.19 Experimental evidence has indicated that iPTH levels increase slightly later than FGF 23 levels, with further support from recent studies.20 Undoubtedly, the pathogenesis of hyperparathyroidism secondary to FGF 23 plays an important role along with alterations to Ca sensors and vitamin D receptors. FGF 23 activated by klotho inhibits the synthesis of PTH. In a similar manner to the conditions produced in the kidney, the parathyroid glands express less klotho in patients with renal failure, such that secondary hyperparathyroidism can be considered as a state of resistance to FGF 23.21 We also know that certain levels of PTH are needed to facilitate the action of FGF 23 in the bones and kidneys.22 Elevated levels of FGF 23 can also prevent the success of treatments for secondary hyperparathyroidism.23
Progressive decreases in 1,25 OHD3 levels, such as we have observed, have been amply described in the medical literature.24 The inhibitory effect of FGF 23 on 1-α hydroxylase appears to predominate over the stimulatory effect of increased PTH levels. According to our results, it does not appear likely that decreases in 1,25 OHD3 can be explained by decreased levels of substrate, 25 OHD3, since this molecule is found in reduced levels at an earlier point in time, as a generalised effect of CKD. Although studies have found no correlation between the levels of these two forms of vitamin D,25 others have observed the opposite.26 It has also been suggested that FGF 23 toxicity might be partially mediated by deficits of 25 and/or 1,25 vit D3.27 In our study, 25 vit D3 levels were low at all times, with no progressive decreases such as were observed in the study by Craver.28 We performed a simultaneous measurement of 25 vit D3 using a single sampling kit. While we cannot deny that our values may be inappropriately low, we can conclude with complete confidence that these values do not decrease as renal failure progresses. One reason for which we can make this affirmation is the fact that a higher percentage of our study patients with diabetes were in the first stages of renal failure (in the group of patients with GFR>60ml/min/1.73m2, the percentage of diabetics was 57.4%; in the group with GFR=30-60ml/min/1.73m2, 29.6%; and in the group with GFR<30ml/min/1.73m2, 13%). It has been shown that diabetes patients have a greater propensity for 25 vit D3 deficit.29
The late increase in phosphataemia that we observed in our study is a universally recognised phenomenon.30
While the univariate analysis indicated that increases in FGF 23 were parallel to the decreases in 1,25 vit D3 (r=-0.40; P<.001), the multivariate analysis showed that FGF 23 levels are not independently correlated with 1,25 vit D3 levels. Previous studies have described several physiological and pathophysiological connections between the levels of these two substances, some direct and others related to other processes. 1,25 OHD3 stimulates osteocyte synthesis of FGF 23,31 a mirror image, and closes the self-controlling feedback loop of FGF 23 that inhibits the synthesis of 1,25 OHD3 by the kidney. In any case, the treatment of hyperparathyroidism with calcitriol and its analogues improves mortality/morbidity profiles, despite the paradoxical increase it produces in FGF 23 levels.32 Perhaps the increased expression of klotho caused by administering 1,25 vit D3 plays an important role in this phenomenon.33 This expression may also increase as a result of blocking the synthesis or activity of angiotensin II.34 Regardless, the simultaneous use of phosphate binders could diminish the increases in FGF 23 by impeding intestinal absorption of P.35 Very favourable results have been described with the use of sevelamer,36 and more recently, with lanthanum.37 In addition, the combination of cinacalcet and low doses of vitamin D has been shown to be especially useful in modulating increases in FGF 23.38 Although still not available, long-lasting PTH analogues could, as the expression of renal P transporters (NPT2a/NPT2c) decreases, prevent increases in FGF 23.39
We do not believe that the few patients treated with vitamin D-based and/or phosphate binders, particularly in those on dialysis treatment, may have affected the validity of our data.
The previously available information regarding phosphocalcic metabolism in the progression of CKD should be supplemented with data regarding FGF 23. The traditional trade-off hypothesis that establishes hypocalcaemia and P load as the first drivers of decreased 1,25 vit D3 levels and increased iPTH levels has been modified by the new information regarding FGF 23, which is now establishing itself the primary actor in these procceses.40
In the coming years, clinical practice guidelines will probably define a time for starting treatment with phosphate binders a good deal before the appearance of hyperphosphataemia, based on FGF 23 levels or increased urine excretion of P.41 The treatment of altered phosphocalcic metabolism in renal failure goes far beyond bone health and directly improves cardiovascular mortality and morbidity profiles.42
We should mention the lack of information regarding urine excretion of P as the most important limitation in our study.
To conclude, changes to the paradigm of this condition that have been brought on by new information regarding the physiological and pathophysiological role of FGF 23, which is found in elevated and active levels starting in very early phases of CKD, may oblige us to adopt new attitudes and earlier treatment strategies, all in an attempt to slow the progressive advancement of renal failure and to minimise its impact as a cardiovascular risk factor.
Acknowledgements
We would like to thank our research fellows Àngels López and Mirta Solà for their collaboration.
Conflicts of interest
The authors have no conflicts of interest to declare.
Table 1. Patient characteristics
Table 2. Results according to CKD-EPI glomerular filtration rate
Table 3. Factors associated with fibroblast growth factor 23. Multivariate analysis
Figure 1. Levels of fibroblast growth factor 23 based on stage of chronic kidney disease
Figure 2. Association between serum levels of fibroblast growth factor 23 and serum phosphorous levels
Figure 3. Association between serum levels of fibroblast growth factor 23 and serum levels of intact parathyroid hormone
Figure 4. Association between serum levels of fibroblast growth factor 23 and estimated glomerular filtration rate
Figure 5. Association between serum levels of fibroblast growth factor 23 and serum levels of 1,25 OHD3


