Antecedentes: Los pacientes con enfermedad renal crónica en tratamiento en hemodiálisis (HD) están sometidos a variaciones constantes en su estado de hidratación que pueden repercutir en su supervivencia. Objetivos: Analizar el estado de hidratación y composición corporal en los pacientes en HD y su asociación con parámetros de inflamación. Métodos: Se incluyeron 128 pacientes prevalentes en HD en situación de estabilidad. Se analizó la composición corporal mediante bioimpedancia espectroscópica y el estado inflamatorio mediante parámetros analíticos. Resultados: Los pacientes con mayor tejido magro presentaron mayor agua intracelular (p = 0,02) y extracelular (p = 0,001). No hubo asociación entre el tejido graso y la hidratación. La sobrehidratación media fue de 7,5 %. Encontramos una asociación entre sobrehidratación ajustada al agua extracelular (OH/AEC) mayor del 15 % similar a 10 %. Ambas se asociaron con niveles bajos de prealbúmina (p = 0,001 y p = 0,05, respectivamente) y a niveles bajos de tejido graso (p = 0,001 y p = 0,05, respectivamente). Conclusiones: La hiperhidratación definida como OH/AEC mayor de 10 % y mayor de 15 % se asocia a disminución de prealbúmina y de tejido graso. Proponemos disminuir el límite de hiperhidratación medido por bioimpedancia a OH/AEC mayor de 10 %.
Background: Patients with chronic kidney disease receiving haemodialysis (HD) have permanent variations in hydration status that may affect their survival. Objectives: To analyse hydration status and body composition in patients on haemodialysis and its relation to inflammation. Methods: We included 128 prevalent clinically stable patients on haemodialysis. We analysed body composition using spectroscopic bioimpedance and inflammation using blood parameters. Results: Patients with higher lean tissue had less intracellular (p=0.02) and extracellular water (p = 0.001). We did not find association with fat tissue and hydration. Mean overhydration was 7.5 %. We found an association between overhydration adjusted to extracellular water (OH/ECW) higher than 15 % similar to 10 %. They were both associated with low prealbumin levels (p = 0.001 and p = 0.05 respectively) and low levels of fat tissue (p = 0.001 and p = 0.05 respectively). Conclusions: Overhydration defined as OH/ECW higher than 10 % and 15 % are related to low prealbumin levels and low fat tissue. We suggest decreasing the overhydration limit measured by bioimpedance to OH/ECW higher than 10 %.
INTRODUCTION
Patients with chronic kidney disease (CKD) on haemodialysis (HD) treatment have constant variations in hydration status, with frequent weight gain between treatment days. This can lead to constant volume overload, difficulty in adjusting dry weight and long-term cardiovascular (CV) complications which may affect survival1.
The body composition of patients on HD may be altered during renal replacement therapy. Fundamental factors influencing this alteration are loss of appetite and anorexia as a result of the dysregulation of appetite hormones2,3. Other common factors should be added, such as the overlap of replacement therapy times with main meals, immobilisation due to amputations and reduced daily exercise. This condition is also exacerbated with age.
Patients on HD have permanent microinflammation; as a result they have a high risk of presenting CV complications and therefore, higher mortality when compared to the population that does not suffer from CKD4-8. This has meant that, in the last decade, inflammation has been the subject of study and new treatments have been proposed in an attempt to reduce it, improving patient prognosis. In addition, inflammation, body composition and hydration are part of a group of factors that if isolated, favour CV risk; when these factors coexist in a patient, the risk multiplies6,9.
Bioimpedance spectroscopy (BIS) is a simple and reliable tool for studying hydration status and body composition9. It is based on the properties of tissue when an alternating current, oscillating at a frequency of 5 to 1000kHz, is passed through it. It has been validated with reference methods and, therefore, it enables accurate data to be obtained10-13.
The main objective of this study is to analyse whether overhydration (OH) in HD is associated with inflammation parameters. The secondary objective is to analyse whether lower levels of overhydration have the same association.
MATERIAL AND METHOD
Sample selection
Ours is a cross-sectional study that included prevalent patients older than 18 undergoing renal replacement therapy with HD. Amputees and patients with pacemakers or metal prosthesis were excluded from the BIS study due to contraindication. Those patients not in a stable clinical environment, defined as not being admitted to hospital and without infection, inflammation or a CV event in the month prior to carrying out the study, were also excluded.
We analysed the population’s baseline characteristics, including age, sex, hypertension percentage, diabetes percentage, CKD aetiology, time on dialysis and single-compartment Kt/V per session. Hypertension was defined according to the Seventh Report of the Joint National Committee14. Complying with the previous definition, we considered volume-dependent hypertension when, by means of bioimpedance, we found that patients had overhydration higher than 2l; this corresponds to the upper left chart of the graph obtained by bioimpedance, in which arterial hypertension is associated with volume overload.
We studied body composition and hydration and inflammation by means of BIS on the same day, and also carried out a blood analysis.
Measurement of body composition and hydration
BIS (BCM®) was used for the body composition study. Measurements were taken immediately before starting the midweek dialysis session (Tuesday or Wednesday). For this, patients remained in the supine position for 10 minutes, without metal objects such as rings or bracelets. The positioning of electrodes, in the contralateral side to vascular access, was considered in patients with fistula. We collected data on hydration and body composition.
The body composition parameters were fat tissue index (FTI) and lean tissue index (LTI), respectively defined as fat and lean tissue adjusted to the patient’s body surface area (kg/m2).
The hydration parameters were: total body water (l); intracellular water (ICW, [l]); extracellular water (ECW, [l]); and OH (l), defined as water not included in either lean or fat tissue. We considered as extracellular overhydration the coefficient in OH/ECW higher than 15 % in accordance with that accepted in the literature; we also estimated a second extracellular hydration to clinical criteria as the ratio between OH/ECW higher than 10 %.
Analytical variables
Analytical samples were taken before starting the dialysis session.
The analytical inflammation parameters collected were: haemoglobin (g/l), albumin (g/dl), prealbumin (mg/dl), fibrinogen (mg/dl), ethrocyte sedimentation rate (mm) and C-reactive protein (mg/dl). The erythropoietin resistance rate was also estimated using the formula: weekly erythropoietin dose expressed in international units multiplied by each kilogram of patient’s weight divided by the haemoglobin (UI/kg/week[g/dl]).
Statistical analysis
Data processing and analysis were carried out using the statistical software SPSS® v. 17.0 (Chicago, Illinois). Quantitative variables that were normally distributed were interpreted as mean and standard deviation. Variables that were not normally distributed were interpreted as median and interquartile range. Qualitative variables were expressed as a percentage. The study on the association between body composition and hydration was undertaken using Pearson correlation. Univariate binary logistic regression was used to study the association between quantitative variables. A P value of <.05 was considered to be statistically significant.
RESULTS
Descriptive characteristics
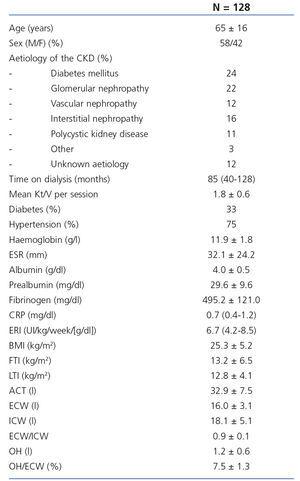
We analysed a total of 128 patients with an average age of 65 ± 16 years; 58 % were males. Table 1 shows the baseline characteristics, mean analytical inflammation parameters and average parameters of body composition and hydration measured by BIS. 75 % of patients complied with hypertension criteria. Of these, 85 %were overhydrated and therefore presented volume-dependent hypertension. 10 % were treated with antihypertensive drugs. 8 % maintained residual kidney function which did not allow ultrafiltration in dialysis.
Association between body composition and hydration
We found a strong positive correlation between body mass index (BMI) and FIT (correlation coefficient [CC] 0.8; P=.001). In the correlation between body composition and hydration status, we found that patients with a higher BMI had more ECW (CC 0.50; P=.001) and ICW (CC 0.20; P=.02). Patients with more fat tissue presented less lean tissue (CC -0.51; P=.001); no association was found between ICW and ECW.
Factors associated with overhydration
Mean OH (OH/ECW) was 7.5 ± 1.3 %. 23 % of patients presented overhydration defined as OH/ECW higher than 15 %. The percentage of patients with overhydration defined as OH/ECW higher than 10 % was 48 %. The percentage of patients that complied with hypertension criteria in OH/ECW 15 % and in OH/ECW > 10 % was 100 % and 96 %, respectively.
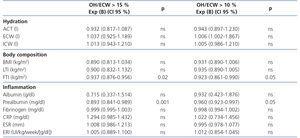
In both cases, an association was found between overhydration and low FTI and prealbumin, as shown in Table 2. This association is not seen with mean OH (OH/ECW = 7.5 %).
DISCUSSION
This study analyses the hydration status of patients on dialysis. Traditionally, “dry weight” was subject to merely clinical interpretation factors that led to a subjective estimation determined by the minimum weight tolerated by a patient without phenomena appearing, such as arterial hypotension or cramps. The development of tools such as BIS has enabled the calculation of dry weight to be an objective, more accurate estimate which facilitates the long term monitoring of oscillations in the hydration status and the associated factors that have an impact on it; this does not prevent the clinic modifying the dry weight for the patient’s individual benefit.
It is accepted that overhydrated patients are defined as those with the coefficient OH/ECW higher than 15 %, based on previous studies in which this condition corresponded to the upper overhydration quartile; an increase in all mortality causes was seen in these patients15,16. Considering the need that our patients maintain the best hydration status possible, we propose reducing the limit of the coefficient to 10 %, since in this study we found the same association factors when we set the cut-off value at 15 % than when we fixed it at 10 %; that is, early on we found an association with inflammation and with a reduction of fat tissue. It is important to mention that, although the patients included in our study had an appropriate hydration status with an average water gain over dry weight of 1.2 litres and a mean OH/ECW coefficient of 7.5; there was a high prevalence of OH/ECW > 10 (48 %). This finding obliges us to consider the need of establishing stricter criteria in the definition of overhydration and maintain a more adjusted weight in patients and encourage better treatment adherence to lessen inter-dialytic gain. Considering the high percentage of arterial hypertension in our sample, we consider that noticeable elevations of OH determine a risk of volume-dependent hypertension, despite its reversal on finishing the session and reaching the dry weight. Although our data are simply a cross-section, after confirming that the factors associated with a overhydration are those marking one or the other cut-off value (10 % vs. 15 %), it is likely that their reduction exerts prognostic influence in HD patients.
As regards body composition, we found, as in previous studies, that a higher BMI in HD patients was due to higher FTI17. Although it is true that “inverse epidemiology” has been described in dialysis patients, in whom obesity and excess weight are not associated with higher mortality, compared to malnourished patients, it is significant and alarming that patients with higher FTI are those with a lower proportion of lean tissue, probably as a result of a lack of exercise. The ideal objective of our patients should be the same as in the general population; that is to say, a within range BMI, above all due to higher LTI, with which the development of CV events and mortality decreases18-21.
Despite practically all the analytical inflammatory parameters analysed being within normal reference limits, we found an association between hydration status and low prealbumin levels. This interesting finding confirms the existence of microinflammation in virtually all HD patients and its effect, in this case, on body composition21. However, the interventions made to reduce this microinflammation presented contradictory results and for now, very unpromising, at least in the long-term prognosis22. With prealbumin being the only inflammatory marker associated with volume overload, it is possible that it implies that overhydrated patients are less well nourished and not necessarily more swollen.
Our study has several limitations, the most noteworthy being the limitations of a cross-sectional study without the possibility of follow-up. However, from this data and with the literature currently available, conclusions relating to the significance of OH can be extrapolated which should be confirmed in prospective studies. We do not have a control group of healthy subjects not on dialysis to compare the differences in body composition. Therefore, we combined the OH criteria based on currently available studies (OH/ECW > 15 %) and new stricter criteria (OH/ECW > 10 %).
In conclusion, the decrease in overhydration criteria to 10 % is associated with the same factors as maintaining it at 15 %; that is, the reduction of prealbumin and fat tissue. While awaiting controlled prospective studies, we therefore propose reducing the overhydration limit measured by BIS, taking over less complications.
Conflicts of interest
The authors declare that they have no conflicts of interest related to the contents of this article.
Table 1. Descriptive baseline characteristics
Table 2. Binary logistical regression analysis for the association study on overhydration higher than 15 % and higher than 10 %


