Introducción: La hiperfosfatemia se ha relacionado con la velocidad de progresión de la enfermedad renal crónica (ERC), aunque todavía existen dudas sobre algunos aspectos de esta asociación. Objetivos: Establecer los determinantes de los niveles de fósforo sérico (P) en la ERC avanzada, con especial interés en aquellos con potencial influencia sobre la progresión de la ERC, y analizar la relación entre los niveles promediados de P sérico con las variaciones del filtrado glomerular (FG) durante el tiempo de seguimiento. Pacientes y métodos: Estudio prospectivo de observación que incluyó a 184 pacientes con ERC avanzada. La tasa de variación del filtrado glomerular (TFG) fue calculada como la pendiente de la recta resultante de la regresión lineal entre el FG y el tiempo de seguimiento, y expresada como ml/min/mes. La mediana de seguimiento fue de 303 días. La asociación entre la TFG y las covariables de estudio se analizó mediante regresión lineal múltiple. Resultados: Los mejores determinantes de los niveles de P sérico fueron, además del FG (beta = 0,477), el sexo femenino (beta = 0,106), el calcio sérico (beta = —0,274), la albúmina sérica (beta = —0,112), el bicarbonato sérico (beta = —0,182), la tasa de catabolismo proteico (beta = 0,144) y el tratamiento diurético (beta = 0,180). La TFG media ± desviación estándar (DE) fue —0,198 ± 0,376 ml/min/mes. Los mejores determinantes de la TFG fueron: proteinuria (beta = —0,462), P sérico (beta = —0,440) y FG basal (beta = —0,404). Los valores absolutos de excreción urinaria de P no se asociaron con el deterioro de la función renal, aunque sí lo hizo la excreción urinaria de P ponderada al FG. Conclusión: Los niveles de fósforo sérico se correlacionan fuertemente con la velocidad de progresión de la ERC.
Introduction: High serum phosphorus (P) has been shown to be associated with a more rapid decline of renal function in patients with chronic kidney disease (CKD). Objective: The aim of this study was to determine whether time-averaged serum P levels are associated with the progression of renal failure adjusted for other potential confounders. Patients and methods: A prospective observational study of 184 patients with pre-dialysis CKD, stages 3, 4 and 5 (mean GFR=15.2±5.6ml/min/1.73m2). The rate of decline in renal function was calculated as the slope of GFR. Median follow-up time was 303 days. Biochemical parameters were analysed as time-averaged concentrations. Multivariate linear regression analysis was used to assess the best determinants of serum P levels, and the relationship between the rate of decline of renal function and the study covariates. Results: The best determinants of serum P levels were: GFR (beta = 0.477), female sex (beta = 0.106), serum calcium (beta = —0.274), serum albumin (beta = —0.112), serum bicarbonate (beta = —0.182), protein catabolic rate (beta = 0.144), and use of diuretics (beta = 0.180). The mean ± standard deviation (SD) slope of GFR was —0.198±0.376ml/min/month. The best determinants of the slope of GFR were: proteinuria (beta = —0.462), serum P (beta = —0.440), and basal GFR (beta = —0.404). Total urinary P excretion was not significantly associated with the rate of decline of renal function. Conclusion: High serum P levels are strongly and independently associated with a more rapid decline of renal function in patients with advanced CKD.
INTRODUCTION
Poor urinary excretion of phosphorus is a key pathogenic component in the development of alterations in bone-mineral metabolism associated with chronic kidney disease (CKD). Although this alteration occurs from the early stages of CKD, compensatory mechanisms are capable of maintaining serum phosphorus levels within the normal range until the deterioration of renal function is very advanced.1-3
In addition to renal function and phosphorus load (mainly dietary), there are other predisposing factors to hyperphosphataemia, which could explain the marked difference in serum phosphorus levels among patients, even with less advanced stages of CKD.3
For patients with CKD, hyperphosphataemia has been associated with cardiovascular morbidity and mortality, as well as the rate of progression of renal function impairment.3-7 However, there are still doubts about some aspects of this association: the relationship between serum phosphorus and other potential factors in the progression of CKD; the influence of phosphorus load on the progression of CKD, independent of serum phosphorus levels; the pathogenic mechanisms by which phosphorus accelerates the deterioration of renal function; and if its control can slow the progression of CKD or improve prognosis.
The objectives of this study were as follows: to establish the determinants of phosphorus levels in patients with advanced CKD, with special emphasis on those with a potential influence on the progression of CKD; and to analyse the relationship between serum phosphorus levels averaged over the follow-up time with changes in the glomerular filtration rate (GFR), both univariate and adjusted to other covariates of interest.
PATIENTS AND METHODS
Patients
The total number of patients included in the study was 184 (mean age 69 years±12 years, with 93 women and 91 men) selected between September 1, 2009 and November 1, 2010 in the Advanced Chronic Kidney Disease Outpatient Department of the Infanta Cristina Hospital, Badajoz.
Inclusion criteria were: age over 18 years, presenting with chronic kidney disease with estimated GFR (eGFR) of less than 40ml/min/1.73m2, not on dialysis, not secondary to a kidney transplant failure, absence of acute intercurrent processes (including active systemic diseases) and major nutritional status alterations. Not excluded from the study were 5 patients with previously known phosphorus disorders (1 patient with Fanconi syndrome, 2 with kidney stones and loss of phosphorus, and 2 with polycystic disease and hyperphosphaturia). Patients under phosphate binder or vitamin D treatment were also not excluded.
Those unable to attend a follow-up at 3 months and 3 consecutive measurements of renal function were excluded, as well as those treated with corticosteroids and those with paraproteinaemia.
In addition to demographic data, diabetes mellitus, body mass index, systolic and diastolic blood pressures (measured at the clinic) and tobacco use were also included as variables in the study.
The phosphorus binders used in these patients were mostly calcium or aluminium salts. One patient was treated with lanthanum carbonate and none with sevelamer hydrochloride. The prescribed doses did not exceed 600mg/day of elemental calcium in any case.
Oral calcitriol was the most widely used pharmacologic form in those treated with vitamin D (92%), with a typical dose of 0.25µg every 48 hours, with none exceeding 0.25 µg/day. This medication was discontinued if hyperphosphataemia was uncontrolled.
Laboratory analysis and calculation of study parameters
The biochemical determinations were performed using an autoanalyser (Advia Chemistry, Siemens Healthcare Diagnostics). Bicarbonate was also measured in venous blood (ABL 800 FLEX gas analyser, Radiometer Ibérica). Plasma concentrations of parathyroid hormone (PTH) were determined by IRMA (N-tact PTH, DiaSorin).
The following biochemical parameters were analysed in urine collected 24 hours before the blood sample: urea, creatinine, proteinuria, calcium and phosphorus.
The GFR was estimated by MDRD-4.8
The protein catabolic rate (PCR) was calculated by urea nitrogen excretion with the combined formulas of Cottini et al. and Maroni et al., as described by Bergström et al.9
The daily excretions of phosphorus and calcium were calculated in 24-hour urine samples, and were shown as total excretion and normalised to GFR (mg of phosphorus excreted per 24 hours per ml/min/1.73m2 of GFR). This last parameter is intended to assess the phosphorus load estimated indirectly by urinary excretion and weighted to the degree of kidney disease.
The calcium urinary excretion rate (calcium in urine x plasma creatinine/urine creatinine) was calculated to estimate calcium excretion weighted to the degree of kidney disease.
To study the tubular handling of phosphorus, the fractional excretion of phosphorus (FEP) was calculated by the formula: (urine phosphorus x serum creatinine)/(serum phosphorus x urine creatinine) x 100, to express the result as a percentage (%).
Study design and statistical analysis
This study was prospective, observational and performed at a single centre.
The rate of change in GFR was the main evolutionary variable, and was estimated in each patient as the slope of the linear regression line for GFR and follow-up time (months). This parameter was expressed as ml/min/month, and a negative result meant loss of renal function.
The median follow-up was 303 days, with interquartile ranges of 218 and 391 days.
Before analysing the relationship between the rate of progression of CKD and serum phosphorus, it was attempted to identify variables of common interest in this relationship using a cross-sectional analysis, and establishing the best determinants of serum phosphorus levels.
All continuous biochemical parameter variables were presented and analysed as averages during the follow-up time.
To analyse the variables that best matched the rate of progression of CKD, univariate and multivariate linear regression models were used with covariates chosen automatically via (backward) stepwise regression.
To compare 2 independent continuous variables, Student’s t-test for unpaired samples or the nonparametric Mann-Whitney test was used, depending on the variable distribution characteristics. The chi-square test was used to compare discrete variables.
Data from this study were presented as mean and standard deviation (± SD), median and interquartile ranges or maximum-minimum values. A P value <.05 was considered statistically significant. Statistical analysis and graphics were performed using the SPSS programme (version 15.0; SPSS, Chicago, USA).
RESULTS
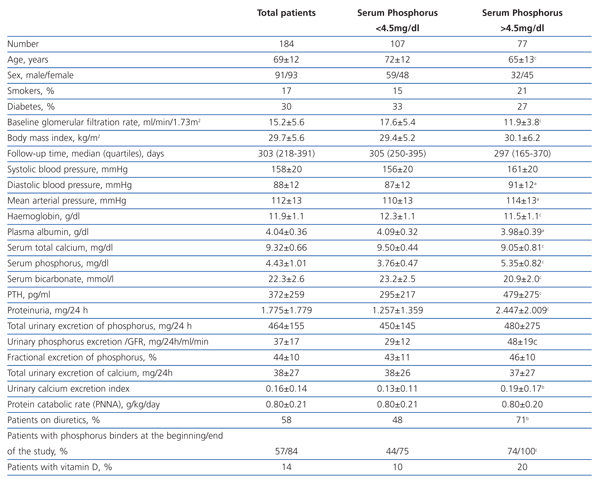
The clinical and analytical characteristics of the study group are shown in Table 1. The average GFR was 15.2±5.6 ml/min/1.73m2, and the number of patients with stages 3-4 and 5 was 86 and 98, respectively.
The number of patients who had high average levels of phosphorus (>4.5 mg/dl) was 77 (42%).
Hyperphosphataemia determinants
Compared with patients who maintained good control of serum phosphorus (Table 1), those with hyperphosphataemia were younger, with a greater predominance of women and with a lower baseline GFR. There were no differences in the percentage of diabetics, but those who had hyperphosphataemia had higher proteinuria and lower serum albumin concentrations. Also, serum calcium levels were lower, PTH was higher and serum bicarbonate was lower in patients with hyperphosphataemia. There were no differences in either the protein catabolic rate or total urinary excretion of phosphorus, although the rate of urinary excretion of calcium was significantly higher in patients with hyperphosphataemia, probably due to taking calcium-based binders, vitamin D and loop diuretics more frequently.
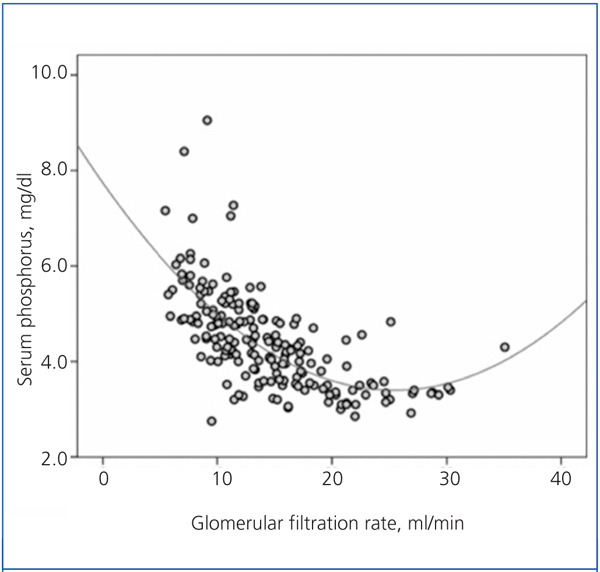
There was a significant correlation between serum phosphorus and GFR, both averaged over the follow-up time (Figure 1). As shown in the figure, the best fit for this correlation was a curve, such that the hyperphosphataemia became more frequent with GFR below 15ml/min.
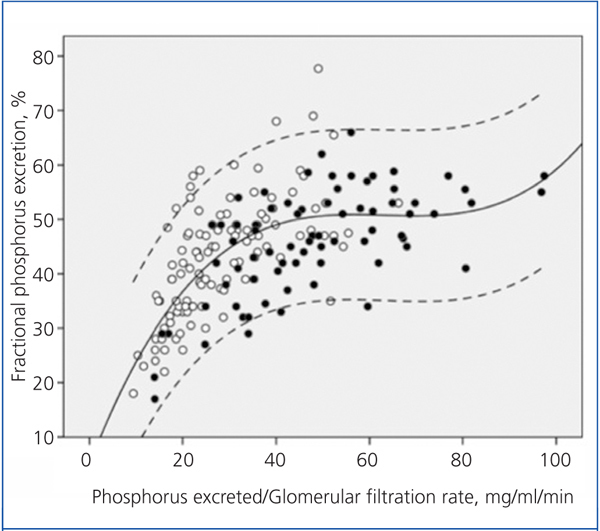
Figure 2 shows the correlation between the fractional excretion of phosphorus (FEP) and urinary excretion of phosphorus weighted to GFR. The figure illustrates the renal compensatory mechanism limits for maintaining phosphataemia within the normal range. FEP increases with increasing phosphorus load per unit GFR, but with an average limit of approximately 50%, except in some patients with tubular disorders, who could exceed 70% of FEP.
Patients with hyperphosphataemia were treated more often with diuretics, phosphate binders and vitamin D. The 107 patients treated with diuretics had a mean phosphorus concentration significantly higher than those untreated (4.67±1.11 vs 4.10±0.75 mg/dl, P<.0001).
The best serum phosphorus level determinants by multiple linear regression are shown in Table 2. In addition to GFR (the most influential determinant), female sex, serum calcium, plasma albumin, serum bicarbonate, protein catabolism rate and diuretic therapy were part of the best predictive equation.
Determinants for the progression of chronic kidney disease
The rate of change in GFR was -0.198±0.376 ml/min/month. There were differences in this renal function decline by CKD stage, which was faster in patients with stage 5 (-0.234±0.367 ml/min/month) than in those with stage 3-4 (-0.158±0.384 ml/min/month), although this difference was not statistically significant.
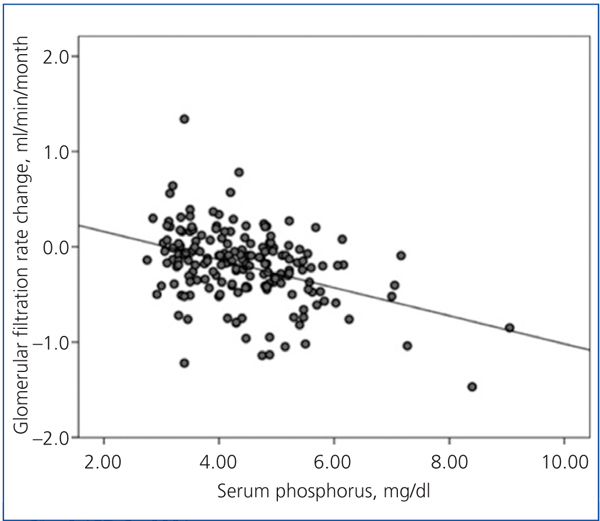
There was a linear correlation between the rate of change in GFR and average serum phosphorus (Figure 3) and baseline serum phosphorus, although this was less significant for the latter (R2=0.03; P=.02). The log of proteinuria also correlated strongly with the rate of change of GFR (R2=0.242; P<.0001).
In the multiple linear regression analysis (Table 3), the main determinants of the rate of change of renal function were serum phosphorus, proteinuria (logarithm) and baseline renal function. The latter was negative, ie, the higher the baseline GFR, the faster the decline in renal function.
This model predicts a 46% faster decrease in GFR for each mg/dl of serum phosphorus above the normal reference level of 4.5 mg/dl.
Variables related to serum phosphorus levels, such as urinary phosphorus excretion, both the absolute values and those normalised to total body weight, plasma albumin, female sex, diuretic use, protein catabolic rate and serum bicarbonate were not part of this equation.
When urinary phosphorus excretion weighted to GFR replaced serum phosphorus in this model, it was also negatively associated with the rate of change in renal function (beta coefficient=-0.332, P=.002).
DISCUSSION
The results of this study show that hyperphosphataemia (serum phosphorus >4.5 mg/dl) is common in patients with advanced stage, pre-dialysis CKD. In addition to renal function (the most influential determinant), female sex, serum albumin, serum bicarbonate and diuretic use also proved to be significant determinants of serum phosphorus levels.
The rate of progression of CKD significantly correlated with average phosphorus levels, in the univariate form and in models adjusted for other covariates of interest, due to their potential involvement in the progression of CKD.
The main compensatory mechanism for the deficit in urinary phosphorus excretion, inherent in the loss of renal function, is increased tubular excretion fraction.10 The fractional excretion of P depends on the expression of the tubular transport proteins NaPi-IIa and NaPi-IIc, which, in turn, are regulated by factors directly involved in mineral metabolism (PTH, vitamin D, calcium, phosphorus and phosphatonins).11-13 However, processes other than mineral metabolism, such as alterations of the acid-base equilibrium,11-13 the expansion or contraction state of effective circulating volume11,12 and even the involvement of other hormones11,12 and drugs14 can also influence the expression of these phosphorus transporters.
Although it is controversial whether phosphorus retention (positive balance) occurs throughout the evolution of CKD, despite normal serum levels, hyperphosphataemia is the most obvious sign of phosphorus retention. This occurs when renal handling and compensation limits are exceeded under a given phosphorus load.10 As shown in Figure 2, the fractional excretion of phosphorus is limited (around 50%), and this is reached when the phosphorus load (estimated indirectly via urinary excretion) per unit glomerular filtration exceeds 35-40 mg/day per ml/min/1.73m2. However, in patients with tubulopathies that selectively affect phosphorus transport, fractional excretion may reach 70-80%, without any sign of hyperphosphataemia, despite the phosphorus load or GFR reduction.
Women included in this study tended to have higher levels of serum phosphorus than men. The female sex has been reported in some6,7 but not all4 studies as a determinant of hyperphosphataemia.
Oestrogens play a significant role in the handling of phosphorus, due to modifying the synthesis of PTH, vitamin D and FGF-23,15,16 or even by directly reducing the expression of tubular transporters,17 so that all these changes favour renal excretion of phosphorus. In addition, male hypogonadism is associated with increased serum phosphorus levels and a decrease in renal excretion fraction.16,18
Although gonadal hormone analysis was not conducted in this study, it is likely that the prevalence of hypogonadism would have been greater in women than men, as most were postmenopausal.
An inverse relationship was observed in this study between serum albumin and phosphorus, which has also been observed in other studies,5,7 although the pathogenetic links between these two parameters are uncertain.
The plasma albumin concentration reflects the presence and severity of different processes that have a negative impact on the outcome of patients with CKD (eg, malnutrition, inflammation, proteinuria, hypervolaemia, etc.).19
No differences in nutritional status were seen in this study, and the average rate of protein breakdown was similar in those with or without hyperphosphataemia. On the other hand, patients with hyperphosphataemia had higher proteinuria, and a significant correlation was observed between both parameters (serum phosphorus and proteinuria).
One possible explanation for this relationship is the link that may exist between an avid sodium reabsorption state in the proximal tubule and the compensation mechanisms for phosphorus excretion. A relationship has been described between the volume expansion, atrial natriuretic peptide levels and intrarenal dopamine production with the decreased expression of tubular transporters NaPi-IIa, and therefore greater phosphaturia.11,12 On the other hand, a decrease in effective circulating volume (eg, nephrotic syndrome) may influence the expression of these NaPi transporters, making phosphorus urinary excretion less effective.12
In connection with this explanation, patients treated with diuretics showed an average serum phosphorus concentration significantly higher than untreated patients. This association has also been observed in other studies,20 and diuretics have been used successfully to increase phosphataemia in pathological processes characterised by renal loss of phosphorus, such as hypophosphataemic rickets.21
Hyperphosphataemia has been associated with increased blood pressure and hyperdynamic circulation.22 It has also been observed that phosphorus overload damages the podocyte in experimental animals.23 These two mechanisms could provide an alternative explanation of the causal relationship between phosphorus and the magnitude of proteinuria.
The inverse relationship between bicarbonate concentration and serum phosphorus observed in this study is remarkable, and difficult to interpret. The correction of metabolic acidosis in patients with CKD significantly reducing serum phosphorus levels without a concomitant increase in phosphaturia or faecal excretion of phosphorus has been described in previous studies.24
However, in experimental models of metabolic acidosis in rats, the expression of Na-PiII phosphorus tubular transporters decreases, increasing phosphaturia, thus favouring neutralised acid excretion in the urine.25
In much the same way as hyperphosphataemia develops, the degree of acidosis in CKD is related to the degree of reduction in GFR and the acid load, mainly dietary. Thus, acidosis and hyperphosphataemia may simply reflect the common effect of poor diets on the degree of renal failure. However, the results in this study show that the association between serum phosphorus and bicarbonate is independent of GFR and the rate of protein catabolism, and suggests a relationship by other, as yet unknown, mechanisms (some possibilities may be mobilisation of bone or extraosseous deposits, or cell redistribution).
Although the relationship between phosphorus levels and the rate of progression of CKD has been reported in other studies,4-7 there are still doubts about the pathogenic mechanisms linking these processes. A simple explanation for this finding could be the close relationship between hyperphosphataemia and advanced stages of CKD. This may mean the rate of deterioration of renal function is attributable to the severity of CKD itself, rather than the serum phosphorus concentrations. However, this study shows that the relationship of serum phosphorus with the rate of deterioration of renal function is stronger the higher the baseline residual renal function. This suggests an independent role for phosphorus or factors related to phosphorus levels.
The magnitude of proteinuria and the degree of metabolic acidosis, which are factors associated with higher phosphorus concentrations, have also been implicated as determinants of the rate of progression of CKD.26-29 The results of this study confirm the independent role of serum phosphorus in CKD progression, despite the association with proteinuria and serum bicarbonate.
Although the number of patients was not very high, this study has two notable strengths: the first is that the variables were not the result of a single sample but averages of numerous samples during the follow-up; secondly, the measurement of the progression of CKD was performed by more precise methods than the use of qualitative variables, such as entering dialysis or doubling of baseline serum creatinine.
This study also has some limitations. Although all patients were treated according to the same criteria, it is likely that those who did not achieve adequate control of phosphorus were the least compliant with diet and treatment. Thus, other factors not related to phosphorus and not recognized in this study may have influenced the progression of CKD.
Patients treated with binding agents were not excluded, and although this fact was taken into account in the multivariable analysis, the prevalence of hyperphosphataemia in the study group could be subject to artefacts.
The levels of FGF-23, other phosphatonins and 25-hydroxy-cholecalciferol were not determined.
Urinary excretion of phosphorus is an approximation to the amount of phosphorus ingested and absorbed, plus that generated by the balance of bone remodelling and extraosseous exchange. This amount is taken in this study as phosphorus load, but by no means can it be regarded as the result of a rigorous metabolic balance.
In conclusion, hyperphosphataemia is a common finding in advanced stages of CKD. In addition to renal function, other factors such as female sex, acidosis, hypoalbuminaemia and the use of diuretics were associated with higher concentrations of serum phosphorus.
This study demonstrates that serum phosphorus levels are independent determinants of the rate of progression of CKD. Therefore, these results support clinical testing to investigate whether adequate control of phosphorus slows the progression of CKD.
Table 1. Clinical and biochemical characteristics of the study group as a whole and per subgroup according to serum phosphorus levels
Table 2. Determinants of serum phosphorus levels by multiple linear regression
Table 3. Determinants of chronic kidney disease progression by multiple linear regression
Figure 1. Relationship between serum phosphorus levels and glomerular filtration rate, with both parameters averaged in the follow-up time
Figure 2. Relationship between urinary phosphorus excretion weighted by glomerular filtration rate and the fractional tubular phosphorus excretion.
Figure 3. Relationship between the rate of change of glomerular filtration rate during the follow-up period and average serum phosphorus.


