Se ha objetivado una mayor prevalencia, precocidad, extensión y velocidad de progresión de las calcificaciones vasculares en los pacientes en hemodiálisis crónica (HD) respecto a la población general. Objetivo: investigar la prevalencia y el efecto funcional de les calcificaciones de la fístula arteriovenosa FAVI (arteria nutricia o vena arterializada) evaluadas por TAC helicoidal (TACh) en pacientes en HD. Pacientes y método: cuarenta y cinco FAVI (radial 44,4% o humeral 55,6%, duración media 65,3 ± 80,9 meses) sin evidencia de estenosis significativa se estudiaron por TACh en 45 pacientes (edad media 63,8 ± 13,1 años; género V: 71,1%, M: 28,9%; tiempo medio en HD 53,1 ± 51,9 meses; nefropatía diabética 15,6%). Todas las exploraciones de la FAVI se efectuaron mediante el mismo aparato de TACh multidetector (HiSpeed Dual, GE Medical Systems). Se clasificó a los pacientes en cuatro grupos según la presencia y la gravedad de las calcificaciones de la FAVI por TACh: grupo I, ausencia de calcificaciones; grupo II, calcificaciones aisladas (<10 grupos de calcificación); grupo III, calcificaciones moderadas (10-20 grupos de calcificación); grupo IV, calcificaciones difusas (>20 grupos de calcificación). Se determinaron diversos parámetros analíticos sanguíneos del perfil lipídico, estatus inflamatorio y metabolismo fosfocálcico. Durante la misma semana de la exploración por TACh, se evaluó la función de la FAVI determinando el flujo sanguíneo de la vena arterializada (QA). El QA (1.559,3 ± 980,6 ml/min) se determinó mediante el método Delta-H (ABF-mode, HemaMetrics, USA) utilizando el monitor Crit-Line III (68,9%) o por ecografía Doppler-color (31,1%), efectuada por el mismo radiólogo mediante un transductor lineal de 5-8 MHz (monitor Sequoia, Siemens-Acuson). La presión arterial media (PAM) (94,7 ± 16,3 mmHg) se determinó simultáneamente con QA . Resultados: la mayoría de pacientes no presentaron calcificaciones de la FAVI por TACh (grupo I: 27/45, 60%). Se objetivaron calcificaciones de la FAVI en el resto de pacientes (18/45, 40%) con la siguiente distribución: grupo II, 13,3%; grupo III, 8,9%; grupo IV, 17,8%. Los pacientes con FAVI humeral presentaron un mayor QA con relación a los pacientes con FAVI radial (1.899,1 ± 1.131,8 vs. 1.134,5 ± 516,4 ml/min, p = 0,005), pero la PAM (91,2 ± 15,8 vs. 99,0 ± 16,2 mmHg) o la prevalencia de calcificaciones de la FAVI (32 vs. 50%) no fue significativamente diferente entre ambos grupos (p = 0,11 y p = 0,24, respectivamente). Los pacientes con evidencia de alguna calcificación por TACh (grupos II, III o IV) presentaron mayor tiempo en HD (84,6 ± 63,1 vs. 24,6 ± 20,0 meses), mayor duración de la FAVI (97,7 ± 89,3 vs. 34,6 ± 61,2 meses) y similar QA (1.488,3 ± 678,9 vs. 1.606,6 ± 1.148,9 ml/min) con relación a los pacientes sin calcificaciones de la FAVI (p = 0,014, p = 0,001 y p = 0,69, respectivamente). No hemos hallado diferencias al comparar ambos grupos con relación a la PAM (95,4 ± 13,8 vs. 94,2 ± 17,9 mmHg), prevalencia de FAVI humeral (44 vs. 63%) o parámetros analíticos analizados (para todas las comparaciones, p = NS). Los mismos resultados se han obtenido al comparar pacientes con un score de calcificación de la FAVI alto (grupos III-IV: 26,7%) y bajo (grupos I-II: 73,3%), o al comparar pacientes sin calcificación (grupo I) y con calcificación difusa (grupo IV) de la FAVI. Conclusiones: 1) La prevalencia de calcificación de la FAVI por TACh ha sido del 40%. 2) La presencia de calcificaciones de la FAVI está relacionada con el tiempo en HD y la duración de la misma. 3) La función de una FAVI bien desarrollada, sin estenosis y apta para la HD crónica no se afecta por la existencia de calcificaciones.
Vascular calcification is a common finding in patients (pts) with end-stage renal disease (ESRD). Objective: The aim of this cross-sectional study was to investigate the prevalence and functional effect of native arteriovenous fistula AVF (feeding artery and/or arterialized vein) calcifications evaluated by spiral computed tomography (CT) in ESRD pts undergoing chronic hemodialysis (HD). Patients and method: Forty-five upper limb AVF (radial 44.4% or brachial 55.6%, mean duration 65.3 ± 80.9 months) without evidence of significant stenosis were evaluated by CT in 45 ESRD pts (mean age 63.8 ± 13.1 yr; sex M: 71.1%, F: 28.9%; mean time on HD 53.1 ± 51.9 months; diabetic nephropathy 15.6%). All AVF explorations were performed using the same multi-slice spiral CT scanner (HiSpeed Dual machine, GE Medical Systems). The severity of AVF calcifications was quantified by CT using the following criteria: grade I absence of calcifications, grade II isolated calcifications (<10 groups of calcification), grade III moderate calcifications (10-20 groups of calcification) and grade IV diffuse calcifications (>20 groups of calcification). Laboratory parameters analyzed: calcium, phosphorus, parathyroid hormone; calcium x phosphorus product was calculated. The same week of CT scanning, we evaluated AVF function measuring the blood flow rate (QA). We determined QA (1559.3 ± 980.6 ml/min) by the Delta-H method (ABF-mode, HemaMetrics, USA) using the Crit-Line III monitor (68.9%) or by Doppler ultrasound (31.1%) performed by the same radiologist using a 5-8 MHz linear transducer (Sequoia machine, Siemens-Acuson); mean arterial pressure MAP (94.7 ± 16.3 mmHg) was recorded simultaneous with QA. Results: Most pts not showed AVF calcification by CT scan (grade I: 27/45, 60%). Forty percent of pts (18/45) demonstrated any degree of AVF calcification (grade II 13.3%, grade III 8.9%, grade IV 17.8%). Pts with brachial AVF showed higher mean QA compared to pts with radial AVF (1899.1 ± 1131.8 versus 1134.5 ± 516.4 ml/min, p=0.005), but MAP (91.2 ± 15.8 versus 99.0 ± 16.2 mmHg) and the prevalence of AVF calcification (32% versus 50%) were not different between both groups (p=0.11 and p=0.24, respectively). Pts with evidence of any calcification on CT scanning (grade II, III or IV) had higher time on HD (84.6 ± 63.1 versus 24.6 ± 20.0 months), higher AVF duration (97.7 ± 89.3 versus 34.6 ± 61.2 months) and similar QA (1488.3 ± 678.9 versus 1606.6 ± 1148.9 ml/min) compared with pts without AVF calcification (p=0.014, p=0.001 and p=0.69, respectively); no differences in MAP (95.4 ± 13.8 versus 94.2 ± 17.9 mmHg), prevalence of brachial AVF (44% versus 63%) or mineral metabolism parameters were found when comparing both groups (for all comparisons, p=NS). The same results were obtained when comparing pts with a high (grade III-IV: 26.7%) and a low (grade I-II: 73.3%) AVF calcification score, or when comparing pts with diffuse (grade IV) and without (grade I) AVF calcification. Conclusions: 1) The prevalence of AVF calcification by CT scan was 40%. 2) The AVF calcification was related with time on HD and AVF duration. 3) The function of fully developed AVF without stenosis and suitable for routine HD was not impaired by the presence of calcifications.
INTRODUCTION
It is well-known that vascular calcifications are more prevalent, appear earlier, are more extensive and advance more rapidly in patients on haemodialysis (HD) than in the general population.1,2 Furthermore, it has been demonstrated that vascular calcification is a predictor of cardiovascular mortality in these patients.3,4 Recently, Schlieper et al. have shown that calcification of the vascular access is an independent predictor of HD patient mortality.5 In these patients, the multi-detector row spiral CT is one of the most effective imaging techniques for diagnosing and following up vascular calcifications.1,2,6,7
The literature contains few references relating to calcifications in HD patients’ vascular access and diagnosed using imaging techniques.5,8,9 In one of the few published studies, Lockhart et al. demonstrate a significant correlation between the technical impossibility of implanting synthetic PTFE grafts in the lower extremities of 32 patients and the presence of pelvic arterial calcifications that were observed during the perioperative CT.10 With respect to its aetiopathogeny, vascular access calcification has been related to vascular calcification in other locations (in such a way that it can act as an indicator of systemic vascular calcification), in the presence of an insufficient dose of dialysis and with the actions of local haemodynamic factors.5
Here, we carried out an observational and cross sectional study to detect calcification of the arteriovenous fistula (AVF) in a non-invasive way, in either the afferent artery or arterialized vein using spiral CT in HD patients to determine the prevalence of calcification and to analyse the different variables related to its presence and evaluate its repercussions on vascular access function.
MATERIALS AND METHODS
Patients
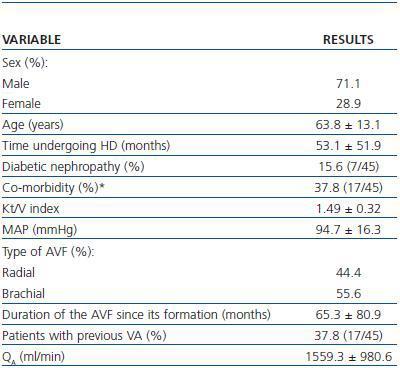
Spiral CT was used to study 45 AVFs during July and August 2007 in 45 patients undergoing HD. All patients had HD sessions three times a week at the Nephrology Department at the Mollet Hospital. The patients included in the study had undergone assisted HD for one month or at least 12 consecutive HD sessions using an AVF cannulated with the double needle technique with no evidence of stenosis and QB above 250ml/min. Patients who were dialysing through catéter or synthetic PTFE graft, or who had AVF stenosis awaiting elective intervention were excluded. Table 1 summarises the most important clinical characteristics of the patients examined by spiral CT.
Method
All AVF explorations were performed by the same radiologist using the same multi-detector row spiral CT (HiSpeed Dual, GE Medical Systems) without administration of intravenous contrast. Patients were classified into four groups according to the calcification scores in the AVF that the spiral CT detected using the following criteria:
- Group I: no calcifications
- Group II: isolated calcifications: fewer than 10 groups of calcifications.
- Group III: moderate calcifications: Between 10 and 20 groups of calcifications.
- Group IV: diffuse calcifications: more than 20 groups of calcifications.
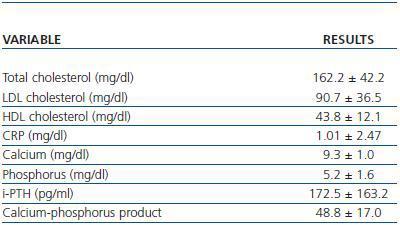
The laboratory parameters examined were lipid profile (total cholesterol, HDL and LDL cholesterol), the inflammatory status in terms of C-Reactive Protein (CRP) and the calcium-phosphorus metabolism (calcium, phosphorus, parathyroid hormone and the calciumphosphorus product) (table 2).
During the same week when the spiral CT explorations were performed, the AVF function was evaluated by determining the blood flow through the arterialized vein (QA). The Mean Arterial Pressure (MAP) was determined simultaneously with the QA. The QAwas determined by two techniques:
1) Delta-H Method. In the majority of the patients (68.9%), QA was determined by the Delta-H optodilution technique, using a Crit-Line III monitor (ABF-mode, HemaMetrics, U.S.A.) This method, described and validated by Yarar et al.11 is a photometric technique that is based on the inverse relationship that exists between volaemia and arterial haematocrit (Hct). QAis determined during the first hour of the HD session based on the changes in Hct related to rapid changes in ultrafiltration (from 0.1 to 1.8L/h) with HD lines in normal and inverted configuration. The changes in Hct are registered in a continuous manner by an optical sensor coupled to a blood chamber inserted between the dialyser and the arterial line. QA(ml/min) is calculated using the following formula:
QA= (max. UF - min. UF) · inv. max. Hct/Δinv. Hct - Δnor. Hct
Where max. UF is maximum ultrafiltration, min. UF is minimum ultrafiltration, inv. max. Hct is maximum Hct obtained with HD lines in inverted position, Δinv. Hct is the change in arterial Hct with the lines inverted, and Δnor. Hct is the change in arterial Hct with HD lines in normal configuration. All calculations of QAwere carried out by the same researcher.
2) Colour Doppler ultrasound. In the remaining cases (31.1%), QA for the arterialized vein was determined using Doppler ultrasound. For these patients, the QAcould not be calculated using the Delta-H method since the venous needle of the blood return was implanted in a different vein from the arterialized one, and the recirculation obtained when inverting the HD blood lines was therefore zero. As in other recent studies, QA was determined by the same radiologist using a linear 5-8MHz transductor (Sequoia monitor, Siemens-Acuson).12,13 Calculation of QA(ml/min) by doppler was performed using the following formula:
QA= time-velocity curve (mean of three cardiac cycles) (m/s) x transverse area (mm2) x 60
Statistical study
Statistical analysis of the data was performed using the SPSS programme version 12.0 for Windows. Values were expressed as percentages or mean ± standard deviation. The differences between related means obtained from different variables were analysed using a T-test for paired data and the non-parametric Wilcoxon signed-rank test. Comparisons of the variables in sub-groups of patients were carried out using the T-test for two independent samples and the Mann-Whitney U test. Values of p < 0.05 were considered to be statistically significant.
RESULTS
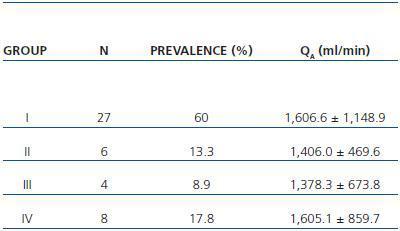
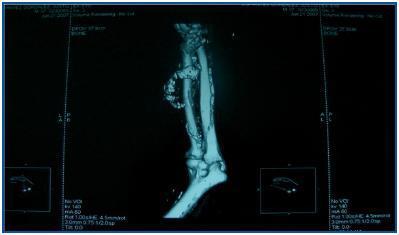
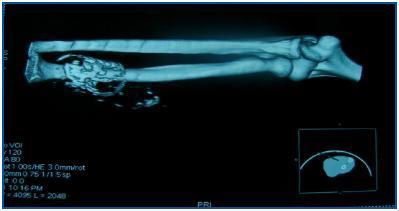
In table 3, patients are shown classified into four groups according to their AVF calcification status. Most of the patients presented no AVF calcifications on spiral CT (27/45, 60%). Various degrees of AVF calcification were found in the rest of the patients, more frequently diffuse calcification (figures 1 and 2).
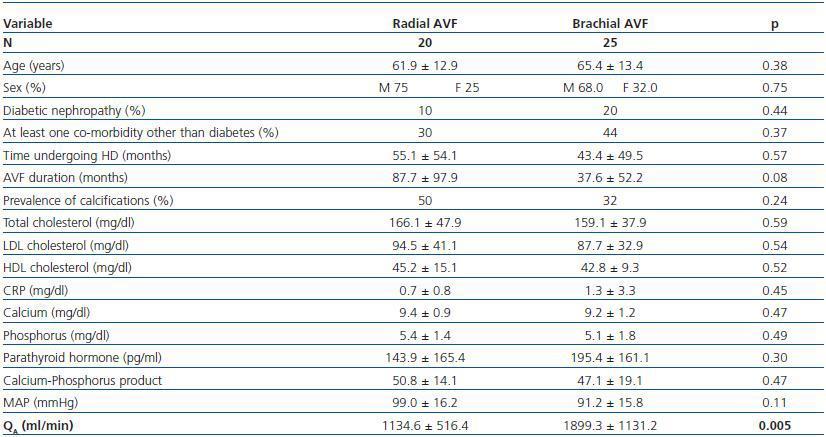
Patients with brachial AVF showed a higher QA compared with patients with radial AVF (1,899.1 ± 1,131.8 vs. 1,134.5 ± 516.4ml/min, p = 0.005), but the MAP or the prevalence of calcifications was not significantly different between both groups (table 4).
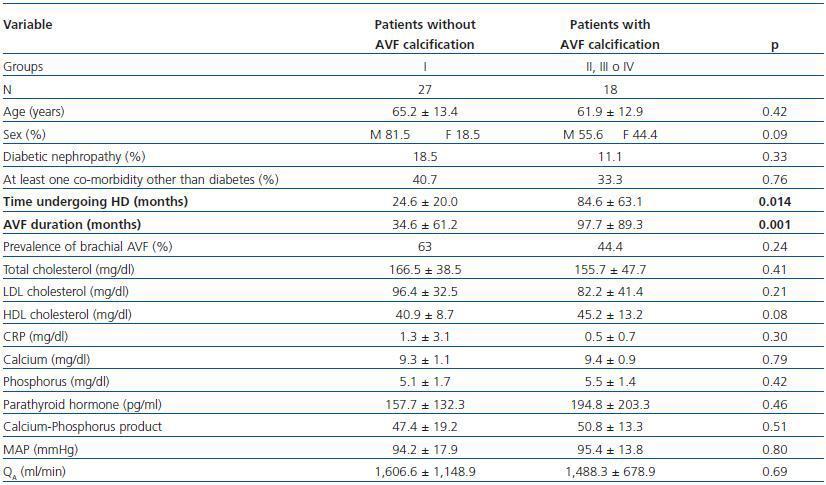
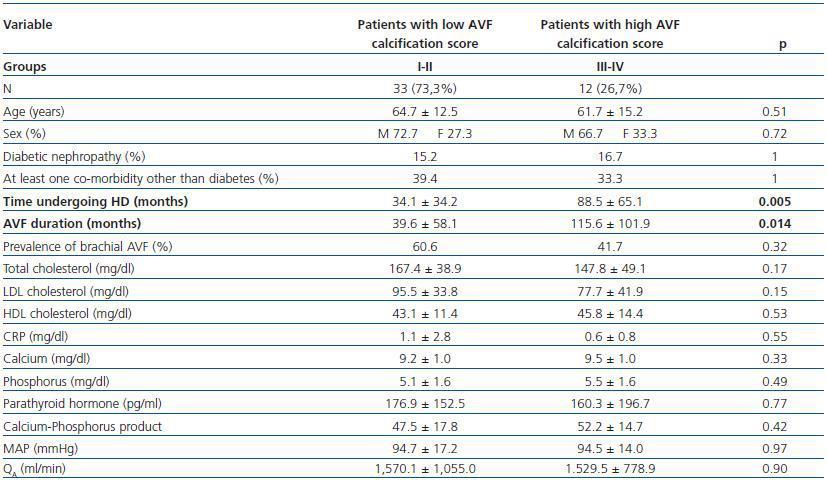
We have performed three different comparative analyses of patient groups after imaging AVF using spiral CT (tables 5,6 and 7):
- Patients showing some signs of calcification (groups II, III or IV) compared with patients with no calcifications (group I).
- Patients with a high calcification score (groups II and IV, 26.7%) compared with patients with a low calcification score (groups I and II, 73.3%).
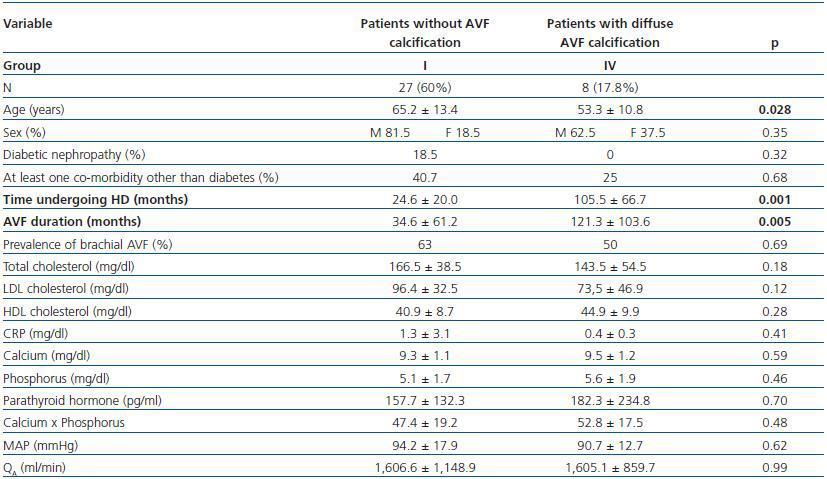
- Patients with diffuse calcification (group IV) compared with patients with no calcifications (group I).
In these three comparative groups, both the presence and the extent of the calcifications show a significant relationship with patient time on HD and AVF duration.
However, we have found no differences relating to the prevalence of brachial AVF, the MAP or the QAof AVF (for all comparisons, p = NS). Nor have we observed a ny significant differences relating to the laboratory parameters that were analysed (tables 5, 6 and 7).
DISCUSSION
In this study, the prevalence of AVF calcification detected by spiral CT was 40%. The literature has paid little attention to the prevalence of calcification in the vascular access5,9 We can cite the retrospective study by Toussaint et al., that used spiral CT with contrast to study 28 patients with dysfunctional brachial AVF.9 These authors observed a low prevalence of AVF calcification in both the feeding artery and the arterialized vein (14.3% of cases) and, furthermore, with a low calcification score.9 In the prospective study carried out by Schlieper et al. referring to 212 patients undergoing dialysis with AVF or a synthetic graft, a 23% rate of vascular access calcification was shown.5 For reference purposes, about 80% of patients on dialysis have calcifications at the level of the coronary arteries.14
In our study, the presence and extent of AVF calcifications is related to both time on dialysis and the duration of the vascular access. Different authors have observed that time on HD is correlated with the presence of coronary artery calcifications detected by spiral CT6 or by electron beam tomography.15 At vascular access level, Schlieper et al. have recently demonstrated that time on HD is an independent predictor of the presence of calcifications.5
Various parameters of calcium-phosphorus metabolism, components of the lipid profile and different inflammatory markers have been considered as modifiable risk factors for the development of vascular calcifications in patients on dialysis.16 The present study found no relationship between the laboratory variables that were examined and the presence and/or severity of AVF calcifications, probably due to it being a cross-sectional study. Likewise, in the comparative study by Moe et al. no significant differences were found for any laboratory parameters when comparing patients with chronic renal disease with (n = 21) and without (n = 50) calcifications in the coronary arteries which were detected by spiral CT.6 In the same way, the abovementioned study by Toussaint et al. did not find any significant correlations between the different laboratory parameters it studied and the presence of calcifications in the carotid artery, subclavian and thoracic aorta that were viewed using spiral CT with contrast.9
In our study, spiral CT scanning found no differences in AVF function owing to the presence and/or extent of calcifications. As in other studies, owing to the larger diameter of the afferent artery, the QA of patients with brachial AVF has been higher than that of patients with radial AVF.17,18 This result does not affect our study because of the homogeneous distribution of patients receiving dialysis via brachial AVF in the three comparison groups (tables 5, 6 and 7). Therefore, the function of a welldeveloped AVF with no stenosis and suitable for chronic HD is not affected by the presence of calcifications that are visible on spiral CT. In this respect, we must refer to the recent article by Tong et al. regarding the scant correlation that exists between coronary calcification measured by electron beam tomography and the presence of obstructive coronary disease.19 Nothing has been published on the repercussions that AVF calcifications detected by spiral CT have on AVF function.
To sum up, the prevalence of AVF calcification detected by spiral CT was 40%. The presence of calcifications in the AVF is related to the length of time the patient has been on HD and the duration of the AVF. The function of a welldeveloped AVF with no stenosis and suitable for chronic HD is not affected by the presence of calcifications that are diagnosed by spiral CT.
Table 1. Characteristics of patients examined under a spiral CT (n = 45)
Table 2. Laboratory parameters examined (n = 45)
Table 3. Patient classification according to the presence and extension of AVF calcifications observed with spiral CT. Mean QA of the AVF obtained for each group is shown (n = 45)
Figure 1.
Figure 2.
Table 4. Patients with radial vs. brachial AVF
Table 5. Patients with versus without AVF calcification
Table 6. Patients with a low versus high AVF calcification score
Table 7. Patients with no presence of calcification versus those with diffuse AVF calcification


