Chronic inflammation and the underlying cardiovascular comorbidity are still current problems in chronic hemodialysis patients. There are few studies comparing the "dialysis dose" with the degree of inflammation in the patient. Our main objective was to determine whether there is a relationship between serum C-reactive protein (CRP) levels and the “dialysis dose” (Kt / V) using ionic dialysance.
MethodsMulticenter cross-sectional study. 536 prevalent chronic hemodialysis patients were included. CRP levels, neutrophil-lymphocyte ratio (NLR) and platelet-lymphocyte ratio (PLR) were collected. Kt was obtained by ionic dialysance and urea distribution volume was calculated from the Watsonˈs formula. The sample was divided into two groups, taking the median CRP as the cut-off point. Dialysis adequacy obtained in each group was compared. Finally, a logistic regression model was carried out to determine the variables with the greatest influence.
ResultsMedian CRP was 4.10 mg/L (q25-q75: 1.67-10) and mean Kt/V was 1.48 ± 0.308. Kt/V was lower in the patients included in the high inflammation group (p = 0.01). In the multivariate logistic regression, the "high" levels of CRP were directly correlated with the Log INL (p < 0.001) and inversely proportional with serum albumin values (p = 0.014), Kt/V (p = 0.037) and serum iron (p < 0.001).
ConclusionThe poorer adequacy in terms of dialysis doses, lower Kt / V values, may contribute to a higher degree of inflammation in chronic hemodialysis patients
La inflamación crónica y la subyacente comorbilidad cardiovascular aún son problemas vigentes en los pacientes en hemodiálisis crónica. Existen pocos estudios que comparen la «dosis de diálisis» con el grado de inflamación del paciente. Nuestro objetivo principal fue determinar si existe una relación entre los niveles séricos de proteína C reactiva (PCR) y la «dosis de diálisis» (Kt/V) utilizando la dialisancia iónica.
MétodosEstudio transversal multicéntrico. Se incluyeron 536 pacientes prevalentes en hemodiálisis crónica. Se recogieron los niveles de PCR, índice neutrófilo-linfocito (INL) e índice plaqueta-linfocito (IPL). Se obtuvo el Kt por dialisancia iónica y el volumen de distribución de la urea (V) mediante la formula de Watson. Se dividió la muestra en dos grupos tomando como punto de corte la mediana de PCR y se comparó la adecuación de diálisis en cada uno. Finalmente, se realizó un modelo de regresión logística para determinar las variables de mayor influencia.
ResultadosLa mediana de PCR fue 4,10 mg/L (q25-q75: 1,67-10). El Kt/V medio fue de 1,48 ± 0,308. El Kt/V fue menor en los pacientes incluidos en el grupo de inflamación alta (p = 0,01). En la regresión logística multivariante, los niveles «altos» de PCR tuvieron correlación directa con el Log INL (p < 0,001) e inversamente proporcional con los valores de albumina sérica (p = 0,014), Kt/V (p = 0,037) y Hierro sérico (p < 0,001).
ConclusiónLa peor adecuación en términos de dosis de diálisis, valores de Kt/V más bajos, puede contribuir a un mayor grado de inflamación en los pacientes en hemodiálisis crónica.
The “dose of dialysis” is a concept that is related to the quality of the hemodialysis received by the patient, it is one of the objectives of the technique; classically, it has been measured by Kt/V or the percentage of urea reduction. Both methods have in common the use of biochemical determination of urea, both pre- and post-hemodialysis. It is usually measured monthly or bimonthly, depending on the center, and it is clearly an indicator of what happens in the rest of the sessions1.
The introduction of monitors capable of obtaining Kt through ion dialysance has made it possible to know the dose of dialysis in each session. This has been an improvement in terms of monitoring the quality of hemodialysis2. If Kt is normalized as a function of total body water, it can obtain Kt/V by ion dialysance. This parameter has a good correlation with the Kt/V measured by urea and a very low intra-individual variability3,4.
In our setting we have high-quality hemodialysis facilities: high-flux dialyzers, the use of online hemodiafiltration techniques, and membranes with greater convective capacity,2 a fact that contrasts with what is found in other settings5, where insufficient dialysis it is still a frequent phenomenon and it is associated with undesirable effects, such as inflammation and malnutrition.
However, the improvement in the quality of hemodialysis in our environment has not definitively eliminated the problem of inflammation in our patients. This is probably due to cardiovascular comorbidities, the persistence of certain uremic toxins, infections, volume overload, biocompatibility of the dialysis membrane, the catheter as vascular access, and kidney disease per se6,7.
Furthermore, parameters related to inflammation, such as C-reactive protein (CRP) and ferritin, are associated with a worse prognosis8. In addition, in recent years it has been shown that cell ratios such as the neutrophil-lymphocyte ratio (NLR) and the platelet-lymphocyte ratio (PLR), present a very good correlation with conventional markers of inflammation, and a main advantage of these cell indexes is that they are easy to obtain from a simple routine blood count, which is why they are quite useful for the prognosis and follow-up of patients with chronic kidney disease9.
Despite the above, currently there are very few studies that relate the degree of inflammation in patients on chronic hemodialysis with the “dose of dialysis” received2,6. For this reason, we have considered carrying out this study, whose main objective is to determine if there is a relationship between the degree of inflammation (measured by PCR) and the "dialysis dose" (measured by Kt or Kt/V by ionic dialysance) in prevalent patients on chronic hemodialysis. In addition, we have introduced in the analysis the measurement of emerging parameters of inflammation, such as NLI and PLI. As secondary objectives, we plan to determine if there is a relationship between the degree of inflammation measured by CRP and other parameters such as serum iron, ferritin, transferrin saturation index, transferrin, NLI and PLI.
MethodsStudy design and populationThis is a cross-sectional, retrospective, multicenter study. The study population is the prevalent patients in out-of-hospital chronic outpatient hemodialysis (Avericum SL) in June 2020, dependent on the Doctor Negrín University Hospital of Gran Canaria and the Doctor José Molina Orosa Hospital, in Lanzarote. There were 536 patients included in the study.
Data CollectionThe computerized and analytical records of prevalent patients on outpatient chronic ambulatory hemodialysis (Nefrosoft®) and the hospital electronic medical record (Selene-Drago) during the month of June 2020 were reviewed. The demographic data collected were: age, sex, height, body surface area, history of diabetes mellitus, length of stay on hemodialysis, dry weight, type of dialysis and vascular access, blood flow, duration of the dialysis session, and number of sessions per week.
Hemodialysis techniqueThe monitors used in the outpatient hemodialysis units were: Flexia ® or Formula ® (Bellco/Medtronic; Mirandola, Italy) equipped with ion dialysance sensors. The monitors were synchronized with the computer program for kidney patients Nefrosoft ® and the data of the sessions were uploaded immediately. In all cases, an ultrapure dialysis fluid was used, defined according to the guidelines of the Spanish Society of Nephrology10. The most frequent prescription was 4 h and 3 times per week. The membranes used were polyethersulfone with high permeability and biocompatibility with a surface area ≥ 1.7 m 2 (Elisio ® 17H, 19H or 21 H; Nipro Medical Corporation, Osaka, Japan). The techniques used were conventional high-flow hemodialysis or online hemodiafiltration, and the prescribed blood flow was the maximum allowed by the vascular access (300-450 ml/min).
Inflammatory stateTaking into account the median value of the CRP of the population under study, the degree of inflammation was considered “high” if the CRP value was above the median and it was “low” if it was below, thus 2 groups configured: “high inflammation group” and “low inflammation group”. Other variables that were analyzed were NLR and PLR, which were defined as the ratio between the absolute number of neutrophils and the absolute number of lymphocytes and the ratio between the absolute number of platelets and the absolute number of lymphocytes, respectively. Given the asymmetry of their values, they were transformed to a logarithmic scale. Likewise, serum iron, ferritin, transferrin saturation index and albumin were also analyzed.
Adequacy and dose of hemodialysisThe type of technique used (hemodialysis or online haemodiafiltration), the type of vascular access (central venous catheter [CVC] or native or prosthetic arteriovenous fistula), blood flow, dialysis time and the number of sessions per week were recorded. The Kt obtained by ionic dialysance was the average obtained from the sessions of the last 45 days prior to the analytical determination. To calculate Kt/V, it was also taken into account the Watson's formula to calculate total body water or «V»11. The target Kt adjusted by body surface area (Kt-bsa) in liters was calculated according to the Lowrie formula: 1 / [0.0069 + (0.0237 / body surface area)]. Body surface area was calculated using the DuBois formula: m2 = weight (kilograms)0.425 × height (centimeters)0.725 × 0.007184. The ΔKt was the difference between the Kt-bsa and the Kt obtained by ion dialysance1,12–14.
Statistical analysisCategorical variables have been presented as frequency and percentages. The quantitative ones, with the mean ± standard deviation if they met the normality condition, otherwise with the median. Normality was assessed using the Kolmogorov-Smirnov test.
Patients were divided according to serum CRP levels into 2 groups (“high degree of inflammation” and “low degree of inflammation”), taking the median of the sample as the cut-off point, which corresponds to the percentile 50th.
To assess whether there were significant differences according to the degree of inflammation, the Student's t test was used in the case of normal quantitative variables, and the Mann-Whitney U test in the case that they did not meet this condition. The chi-square test was used to measure associations in the case of qualitative variables.
Finally, a binary logistic regression analysis was carried out and the stepwise method, LR or Wald forward, was applied to select the set of variables with the best predictive capacity.
The results were considered statistically significant if the p value was < 0.05. We used the SPSS ® 23.0 (SPSS Inc.; Chicago, Illinois, USA) statistical program.
Ethical aspectsThe study protocol was approved by the Ethics and Clinical Research Committee of the Hospital Universitario de Gran Canaria Doctor Negrín (Las Palmas de Gran Canaria, Spain), under code 2020-428-1. The study was conducted following the guidelines of the Declaration of Helsinki. The data was collected in an anonymized database and, as it was a retrospective design study and did not affect the clinical management of the patients, the exemption of informed consent was granted.
ResultsBaseline CharacteristicsThe mean age was 65.64 ± 13.64 years. A 65.1% were men. The proportion of diabetics was 52.4% and the mean time spent on dialysis was 38.07 ± 34.93 months. There were no significant differences in terms of technique, time on dialysis, number or duration of sessions. Blood flow was greater in patients considered to be in the low inflammation group (Table 1).
Baseline characteristics of the patients.
| Characteristics | all patients(N = 536) | Patients with a “high” degree of inflammation | Patients with a “low” degree of inflammation | p |
|---|---|---|---|---|
| Age (years) | 68 (57-77) | 67 (56 - 77) | 68 (58 - 76.25) | 0.605 |
| Women, n (%) | 187 (34.9) | 94 (35.9) | 89 (33.5) | 0.560 |
| Diabetes mellitus, n (%) | 281 (52.4) | 141 (53.8) | 136 (51.1) | 0.537 |
| Time spent on dialysis (months) | 28 (12-58) | 31.5 (13.75 - 64) | 26.5 (11.75 - 55) | 0.06 |
| Type of dialysis (stHD/HDF), n (%) | 437 (81.5)/99 (18.5) | 215 (82.1)/47(17.9) | 214 (80.5)/52(19.5) | 0.636 |
| Vascular access (AVF/CVC), n (%) | 298(55.6)/238 (44.4) | 134(51.1)/128(48.9) | 163(61.3)/103(38.7) | 0.065 |
| Blood flow (mL/min) | 359.65 (334.47-391.95) | 354.89 (331.11 -389.4) | 363.7 (340.34 -394.37) | 0.017 |
| Dialysis duration (min) | 240 (225-240) | 240 (225 - 240) | 240 (221.25 - 240) | 0.253 |
| Sessions per week | 3 (3-3) | 3 (3 - 3) | 3 (3 - 3) | 0.098 |
| V men (L) | 39.43 (36.26-43.52) | 39.84 (36.74 - 44.18) | 34.24 (35.62 - 43.1) | 0.232 |
| V women (L) | 31.38 (28.63-34.4) | 31.96 (28.33 - 34.64) | 31.12 (28.67 -33.46) | 0.336 |
CVC: central venous catheter; AVF: arteriovenous fistula; HDF: online haemodiafiltration; HDst: standard hemodialysis; V: urea distribution volume.
Values are expressed as median (q25-q75) unless otherwise specified.
Regarding vascular access, fistulas (native and prosthetic) were grouped against those with CVCs, and it was found that patients in the group with greater inflammation had a higher percentage of CVCs (128 [55.4%] vs. 103 [44, 6%]) (p = 0.019). However, as will be seen below, in multivariate logistic regression this variable does not influence the results obtained.
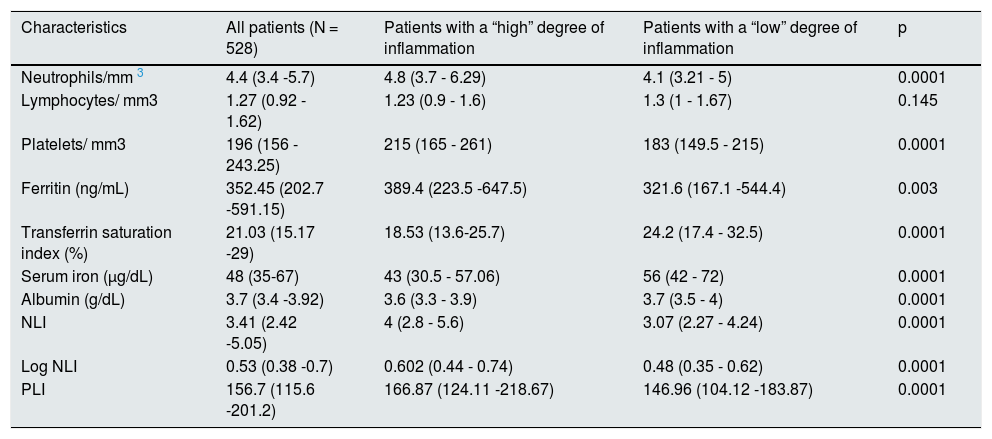
Inflammatory parametersThe median CRP of the sample was 4.10 mg/L (q25-q75: 1.67-10); this was the cut-off point chosen in this study. This value proved to be a good discriminant between the inflammation parameters of both groups. As shown in Table 2, all of them had significant differences. No association was found between groups according to the degree of inflammation, gender and etiology of chronic kidney disease, diabetics vs. non diabetics.
Inflammatory parameters in the study patients.
| Characteristics | All patients (N = 528) | Patients with a “high” degree of inflammation | Patients with a “low” degree of inflammation | p |
|---|---|---|---|---|
| Neutrophils/mm 3 | 4.4 (3.4 -5.7) | 4.8 (3.7 - 6.29) | 4.1 (3.21 - 5) | 0.0001 |
| Lymphocytes/ mm3 | 1.27 (0.92 - 1.62) | 1.23 (0.9 - 1.6) | 1.3 (1 - 1.67) | 0.145 |
| Platelets/ mm3 | 196 (156 - 243.25) | 215 (165 - 261) | 183 (149.5 - 215) | 0.0001 |
| Ferritin (ng/mL) | 352.45 (202.7 -591.15) | 389.4 (223.5 -647.5) | 321.6 (167.1 -544.4) | 0.003 |
| Transferrin saturation index (%) | 21.03 (15.17 -29) | 18.53 (13.6-25.7) | 24.2 (17.4 - 32.5) | 0.0001 |
| Serum iron (μg/dL) | 48 (35-67) | 43 (30.5 - 57.06) | 56 (42 - 72) | 0.0001 |
| Albumin (g/dL) | 3.7 (3.4 -3.92) | 3.6 (3.3 - 3.9) | 3.7 (3.5 - 4) | 0.0001 |
| NLI | 3.41 (2.42 -5.05) | 4 (2.8 - 5.6) | 3.07 (2.27 - 4.24) | 0.0001 |
| Log NLI | 0.53 (0.38 -0.7) | 0.602 (0.44 - 0.74) | 0.48 (0.35 - 0.62) | 0.0001 |
| PLI | 156.7 (115.6 -201.2) | 166.87 (124.11 -218.67) | 146.96 (104.12 -183.87) | 0.0001 |
NLI: neutrophil-lymphocyte ratio; PLI: platelet-lymphocyte ratio.
Values are expressed as median (q25-q75).
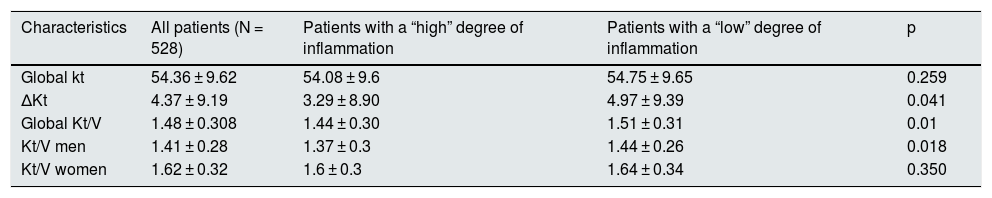
The mean Kt of the 536 patients was 54.36 ± 9.63 L. The Kt-bsa was 50.03 ± 3.92 L and the Kt/V was 1.48 ± 0.308. The mean of the differences (ΔKt) between Kt-bsa and Kt was 4.37 ± 9.19 L.
When the sample was classified according to the degree of inflammation, there were no significant differences in Kt-bsa or Kt, but there were differences in ΔKt (high inflammation: 3.28 ± 8.90 vs. low inflammation: 4.97 ± 9.39) (p = 0.041) and in Kt/V (high inflammation: 1.44 ± 0.30 vs. low inflammation: 1.51 ± 0.31) (p = 0.01).
The percentage of patients who reached the target Kt was 66.9% (n = 344). The group of men with a high degree of inflammation were those with the lowest Kt/V. In women there were no significant differences (Table 3).
Suitability for hemodialysis.
| Characteristics | All patients (N = 528) | Patients with a “high” degree of inflammation | Patients with a “low” degree of inflammation | p |
|---|---|---|---|---|
| Global kt | 54.36 ± 9.62 | 54.08 ± 9.6 | 54.75 ± 9.65 | 0.259 |
| ΔKt | 4.37 ± 9.19 | 3.29 ± 8.90 | 4.97 ± 9.39 | 0.041 |
| Global Kt/V | 1.48 ± 0.308 | 1.44 ± 0.30 | 1.51 ± 0.31 | 0.01 |
| Kt/V men | 1.41 ± 0.28 | 1.37 ± 0.3 | 1.44 ± 0.26 | 0.018 |
| Kt/V women | 1.62 ± 0.32 | 1.6 ± 0.3 | 1.64 ± 0.34 | 0.350 |
Kt/V: “dialysis dose”.
Values are expressed as mean ± standard deviation.
No differences were observed between diabetic and non-diabetic patients in any of these parameters : Kt, Kt-bsas, ΔKt and Kt/V, While Kt, Ktsc and ΔKt were significantly lower in women, Kt/V was significantly higher in women than men: 1.62 ± 0.31 vs. 1.41 ± 0.28 (p < 0.001), respectively.
Higher CRP values were observed in patients with CVC (Table 4). In addition, patients belonging to the quartile with lower ΔKt values had a higher percentage of catheters (Table 5).
Characteristics of patients according to the type of vascular access.
| Characteristics | AVF | CVC | p |
|---|---|---|---|
| Sex (M), n (%) | 83 (27.9) | 104 (43.7) | 0.0001 |
| Age (years) | 67 (57 - 76) | 68.5 (57 - 77) | 0.460 |
| Dry weight (kg) | 72.25 (63.92 - 84.62) | 70 (59.5 - 82) | 0.022 |
| Time on hemodialysis (months) | 37 (17 - 64) | 20 (8 - 47) | 0.0001 |
| Kt (L), mean ± SD | 56.72 ± 9.15 | 51.33 ± 9.38 | 0.0001 |
| Kt/v, mean ± SD | 1.51 ± 0.30 | 1.44 ± 0.31 | 0.016 |
| ΔKt (L), mean ± SD | 6.96 ± 8.9 | 1.91 ± 8.99 | 0.0001 |
| Type of hemodialysis, n (%) | 0.0001 | ||
| stHD | 218 (73.2%) | 219 (92%) | |
| HDF | 80 (26.8%) | 19 (8%) | |
| Diabetes mellitus, n (%) | 154 (51.7%) | 127 (53.4%) | 0.698 |
| Blood flow (ml/min) | 368.97 (347.9 - 398.25) | 346.98 (322.1 - 380.21) | 0.0001 |
| Session duration (min) | 240 (240 - 240) | 240 (210 - 240) | 0.001 |
| BSA (m2) | 1.83 (1.69 - 1.97) | 1.78 (1.62 - 1.91) | 0.002 |
| V men (L) | 39.92 (36.7 - 43.7) | 38.83 (35.5 - 43.3) | 0.108 |
| V women (L) | 31.41 (29.05 - 34.66) | 31.23 (27.98 - 34.1) | 0.500 |
| Ferritin (ng/mL) | 359.75 (206.8 - 579.15) | 342.4 (188.52 - 603.75) | 0.528 |
| TSI (%) | 22.21 (16.94 - 30.51) | 18.8 (13.2 - 27.48) | 0.0001 |
| Iron (μg/dL) | 51 (39 - 68.57) | 45 (30 - 62.6) | 0.0001 |
| Albumin (g/dL) | 3.7 (3.5 - 4) | 3.6 (3.3 - 3.88) | 0.0001 |
| CRP (mg/L) | 3.48 (1.49 - 8.2) | 4.9 (2 - 12.5) | 0.001 |
| Biointact PTH (1-84) (pg/mL) | 203 (127 - 337.7) | 212.9 (116 - 348) | 0.915 |
| INLI | 3.24 (2.31 - 4.63) | 3.64 (2.63 - 5.34) | 0.021 |
| PLI | 152.3 (113.9 - 195.6) | 162.6 (115.9 - 215.2) | 0.130 |
BSA: body surface area; CVC: central venous catheter; SD: standard deviation; AVF: arteriovenous fistula; HDF: online haemodiafiltration; stHD: standard hemodialysis; NLI: neutrophil-lymphocyte ratio; PLI: platelet-lymphocyte ratio; TSI: transferrin saturation index; CRP: C-reactive protein; PTH: parathormone; V: urea distribution volume.
Values are expressed as median (q25-q75) unless otherwise specified.
ΔKt in quartiles.
| Q1 (< − 2.46) | Q2 (2.46 - 4.24) | Q3 (4.24 - 10.91) | Q4 (> 10,691) | p | |
|---|---|---|---|---|---|
| Sex (M), n/% | 49/38 | 50/38.8 | 46/35.7 | 35/27.1 | 0.184 |
| Age (years) | 70 (61 - 77) | 69 (58 - 77) | 67 (56 - 76) | 65 (54 - 77) | 0.087 |
| Dry weight (kg) | 79 (67.2 - 90.5) | 71 (62 - 82.2) | 70.5 (59.75 - 82.2) | 69.5 (62.5 -82.2) | 0.002 |
| Time on hemodialysis (months) | 20 (9 - 46) | 27 (9 - 55) | 33 (15.5 - 64) | 34 (17 - 60.5) | 0.006 |
| Type of vascular access, n (%) | 0.0001 | ||||
| FAV | 54 (41.9) | 67 (51.9) | 77 (59.7) | 94 (72.9) | |
| CVC | 75 (58.1) | 62 (48.1) | 52 (40.3) | 35 (27.1) | |
| Type of hemodialysis, n (%) | 0.0001 | ||||
| stHD | 123 (95.3) | 110 (85.3) | 93 (72.1) | 93 (72.1) | |
| HDF | 6 (4.7) | 19 (14.7) | 36 (27.9) | 36 (27.9) | |
| Diabetes mellitus, n (%) | 78 (60.5) | 61 (47.3) | 68 (52.7) | 62 (48.1) | 0.129 |
| Blood flow (mL/min) | 340.4 (311.59 -362.14) | 354.9 (331.6 -386.6) | 365.6 (343.3 -396.9) | 388.7 (358.6 -427.3) | 0.0001 |
| Duration HD Session (min) | 240 (210 - 240) | 240 (210 - 240) | 240 (240 - 240) | 240 (240 - 240) | 0.0001 |
| BSA (m2) | 1.85 (1.71 -2.01) | 1.8 (1.64 -1.93) | 1.78 (1.66 -1.93) | 1.78 (1.68 -1.92) | 0.016 |
| V Watson Men (L) | 41.69 (37.8 -45.7) | 39.37 (36.55 -43.32) | 38.66 (34.75 -43) | 38.58 (36.18 -42.82) | 0.012 |
| V Watson Women (L) | 32.56 (29.34 -36.21) | 31.93 (27.71 -33.76) | 30.92 (28.15 -34.12) | 31.34 (28.73 -33.4) | 0.211 |
| Ferritin (ng/mL) | 370 (163.95 -735.82) | 350.2 (189 -587.35) | 313.8 (184.9 -484.2) | 378.6 (235.4 -605.2) | 0.476 |
| IST (%) | 19 (13.85 -26.5) | 19.83 (14.22 -28.55) | 24.48 (17.25 -31.62) | 22.53 (16.4 -30.38) | 0.012 |
| Iron (μg/dL) | 48 (32 - 68) | 47 (34 - 62) | 52 (37 - 68) | 49 (35 - 69) | 0.381 |
| Albumin (g/dL) | 3.6 (3.3 - 3.8) | 3.7 (3.4 - 3.8) | 3.8 (3.5 - 4) | 3.7 (3.4 - 4) | 0.002 |
| CRP (mg/L) | 4.25 (1.9 - 11.5) | 4.7 (1.77 - 9.71) | 3.71 (1.53 - 10.31) | 3.6 (1.07 - 8.15) | 0.2 |
| Biointact PTH (1-84) (pg/mL) | 215.8 (127.7 -396.5) | 220 (123.5 -362) | 207 (136 -316) | 173.5 (96.17 -286.2) | 0.061 |
| INL | 3.8 (2.6 - 5.2) | 3.3 (2.4 - 4.5) | 3.2 (2.2 - 5) | 3.3 (2.4 - 4.8) | 0.263 |
| IPL | 163.7 (118.7 -216) | 157.4 (121.4 -199.2) | 157.7 (112.1 -204.7) | 148.5 (111.6 -194) | 0.332 |
BSA: body surface area; CVC: central venous catheter; HDF: online haemodiafiltration; stHD: standard hemodialysis; NLI: neutrophil-lymphocyte ratio; PLI: platelet-lymphocyte ratio; TSI: transferrin saturation index; stHD: standard hemodialysis; M: woman; CRP: C-reactive protein; PTH: parathormone; V: urea distribution volume.
Values are expressed as median (q25-q75) unless specified otherwise.
In the multivariate logistic regression, with the inflammation group as the dependent variable, the following variables were included: sex, diabetes mellitus, total number of neutrophils, lymphocytes and platelets, serum ferritin, transferrin saturation index, serum iron, albumin, parathyroid hormone, Kt, Log PLR, Log NLR, Kt/V, the catheter as type of vascular access, the time on hemodialysis and the duration of the hemodialysis session.
It was observed that the significant predictive variables were serum albumin, Log NLR, Kt/V and serum iron, so that the relationship (coefficient β) was positive with Log NLI and negative with albumin, Kt/V and iron. (Table 6).
Multivariate logistic regression for patients with a "high" degree of inflammation.
| Variables in the equation | Coefficientβ | Standard error | Significance | Exp(B) | [0.6-7] Confidence interval 95% | |
|---|---|---|---|---|---|---|
| Lower limit | Upper limit | |||||
| Albumin | −0.644 | 0.267 | 0.016 | 0.525 | 0.311 | 0.887 |
| Log NLI | 1,909 | 0.454 | 0.000 | 6,750 | 2,773 | 16,429 |
| Kt/V | −0.742 | 0.337 | 0.027 | 0.476 | 0.246 | 0.921 |
| Serum iron | −0.019 | 0.005 | 0.000 | 0.981 | 0.972 | 0.990 |
| Constant | 3.008 | 0.006 | ||||
Currently, insufficient dose of dialysis is gradually a less frequent problem in our environment. In most of the hemodialysis centers in Spain, the quality parameters recommended by the Spanish Society of Nephrology are met2,3,10,15. However, it has not been possible to completely eliminate the problem of chronic inflammation in these patients. Therefore, our study wants to inquire into the relationship that inflammation could have with hemodialysis adecuacy.
In our study, although there was no significant difference in the proportion of techniques (hemodialysis/online hemodiafiltration), there was a difference in the scheduled blood flow, showing higher values in patients with a low degree of inflammation. It could be assumed that the higher the blood flow prescribed, the more adequate the dialysis obtained1,2. This finding is consistent with the greater inflammation found in patients with catheters, something already observed by some authors7. However, having a catheter as vascular access did not influence logistic regression.
Depending on the degree of inflammation, the patients were distributed in the 2 groups that showed significant differences in parameters classically related to inflammation, such as ferritin and albumin, and with emerging markers, such as NLR and PLR 9,15. It should be noted that there were no significant differences in the levels of lymphocytes, which infers that the parameters that most influenced were neutrophils and platelets.
Neutrophils interact with the endothelium and favor the development of atherosclerosis through inflammatory and immunoregulatory responses and the production of extracellular tissue scaffolds (neutrophil extracellular traps). For their part, platelets also play an important role in the so-called “inflamed endothelium”, also favoring the development of atherosclerosis, acting synergistically with neutrophils9,16.
It is known that, in the context of inflammation, there is an increase in hepatic secretion of hepcidin, which induces iron retention in enterocytes and macrophages. Consequently, serum iron decreases and this stimulates the production of fibroblast growth factor 23 in the bone, both directly and through the subsequent increase in erythropoietin production due to iron deficiency17. It should be noted that the increase in fibroblast growth factor 23 is associated to the progression of kidney disease, cardiovascular events and mortality18. In our study, as described in other works, the lowest iron levels were associated with the group considered to have a “high” degree of inflammation19.
In relation to the adequacy of hemodialysis, as already pointed out by Maduell et al.2, the recommendations of the clinical guidelines are still based on analytical Kt/V terms and on the percentage of urea reduction, which are periodically obtained from the patient's laboratory tests; this is an extrapolation that assumes, with all its drawbacks, that all hemodialysis sessions are similar to the sessions in which the analytics were obtained. Therefore, it is recommended the monitoring of the dose of dialysis delivered to the patient in each session. In our population, the percentage of patients who reached the target Kt was 66.9%, a figure that is very similar to those obtained by other Spanish series1.
However, the Kt measured by ion dialysance identifies a considerable percentage of patients who, reaching an adequate Kt/V, do not obtain the minimum Kt, so they are at risk of infradialysis, especially in women and in those with catheter1. In women, it is probably because they have a smaller body volume. This dependence on “V” has been studied in detail by other authors,3 reaching the conclusion that a “good” Kt/V may be a "poor urea clearance based on low body weight or a lower proportion of water", a fact that may explain why in our patients the women had a higher Kt/V but a lower ΔKt than men.
In this line, Maduell et al. described that patients who did not reach Kt-bsa had higher CRP levels2. Our findings show that patients with higher CRP could have a worse adaptation to hemodialysis in terms of Kt/V obtained by ionic dialysance and ΔKt. It should be noted that between the 2 groups patients there were no differences in the Kt, but there were significant differences in the Δ Kt. This finding highlights the importance that all dialysis adequacy parameters should be adjusted to the body surface, something already mentioned by other authors2,12.
An important aspect of our work is the consideration of emerging markers of inflammation such as NLR or PLR. These parameters, given their versatility, are increasingly used in patients with chronic kidney disease9,15,20,21.
Other strengths of the study are the sample size and its multicenter nature. However, we should point out as limitations the cross-sectional design and the circumscription of the population to a single province of our country.
In conclusion, according to results obtained we propose, that poor dialysis adequacy in terms of dialysis dose, low Kt/V and ΔKt values may contribute to a higher degree of inflammation in patients on chronic hemodialysis.
Key concepts- -
Chronic inflammation remains a current problem in chronic hemodialysis patients.
- -
The median CRP of the sample (4.10 mg/L) was the cut-off point chosen to determine the “high” and “low” inflammation groups.
- -
The percentage of patients who reached the target Kt was 66.9%.
- -
The ΔKt and Kt/V were higher in the low inflammation group.
- -
Higher CRP values were observed in patients with catheter, however, this variable did not influence the result of logistic regression.
- -
In multivariate logistic regression, the significant predictors of “high inflammation” were Log NLI (positive), serum albumin (negative), Kt/V (negative), and iron (negative).
- -
Low Kt/V and ΔKt values could contribute to a higher degree of inflammation in chronic hemodialysis patients.
The authors declare that they have no conflict of interest in relation to the publication of this article.
The authors would like to thank all the medical, nursing and administrative staff of Avericum SL for their daily work in each of the centers where this study has been performed.
Please cite this article as: Valga F, Monzón T, Vega-Diaz N, Rodriguez-Perez JC, Ruiz-Santana S. Inflamación y adecuación de la hemodiálisis: ¿están los niveles de proteína C reactiva influidos por la dosis de diálisis recibida? Nefrologia. 2022;42:163–170.


