


Acute kidney injury (AKI) diagnosis is still based on serum creatinine and diuresis. However, increases in creatinine are typically delayed 48h or longer after injury. Our aim was to determine the utility of routine postoperative renal function blood tests, to predict AKI one or 2days in advance in a cohort of cardiac surgery patients.
Patients and methodsUsing a prospective database, we selected a sample of patients who had undergone major cardiac surgery between January 2002 and December 2013. The ability of the parameters to predict AKI was based on Acute Kidney Injury Network serum creatinine criteria. A cohort of 3962 cases was divided into 2 groups of similar size, one being exploratory and the other a validation sample. The exploratory group was used to show primary objectives and the validation group to confirm results. The ability to predict AKI of several kidney function parameters measured in routine postoperative blood tests, was measured with time-dependent ROC curves. The primary endpoint was time from measurement to AKI diagnosis.
ResultsAKI developed in 610 (30.8%) and 623 (31.4%) patients in the exploratory and validation samples, respectively. Estimated glomerular filtration rate using the MDRD-4 equation showed the best AKI prediction capacity, with values for the AUC ROC curves between 0.700 and 0.946. We obtained different cut-off values for estimated glomerular filtration rate depending on the degree of AKI severity and on the time elapsed between surgery and parameter measurement. Results were confirmed in the validation sample.
ConclusionsPostoperative estimated glomerular filtration rate using the MDRD-4 equation showed good ability to predict AKI following cardiac surgery one or 2days in advance.
El diagnóstico de insuficiencia renal aguda (IRA) todavía se basa en la creatinina sérica y la diuresis. Sin embargo, el incremento de la creatinina a menudo se retrasa 48h o más con respecto al momento de la lesión. El objetivo de este estudio es determinar la utilidad de las pruebas analíticas de función renal habituales en el postoperatorio, para predecir la IRA con uno o 2días de antelación, en una cohorte de pacientes intervenidos mediante cirugía cardíaca.
Pacientes y métodosA partir de una base de datos prospectiva, se seleccionó una muestra de pacientes operados de cirugía cardíaca mayor, entre enero de 2002 y diciembre de 2013. La definición de IRA se basó en el criterio de la creatinina sérica utilizado por la Acute Kidney Injury Network. La cohorte de 3.962 casos se dividió en 2grupos de tamaño similar, uno exploratorio y otro de validación. El grupo exploratorio se utilizó para demostrar los objetivos principales y el de validación para confirmar los resultados. La capacidad de predicción de la IRA, de varios parámetros de función renal medidos en la analítica postoperatoria habitual, se evaluó utilizando curvas ROC tiempo-dependientes. Como variable principal se consideró el tiempo transcurrido desde la medida del marcador hasta el diagnóstico de la IRA.
ResultadosSe observaron 610 (30,8%) y 623 (31,4%) episodios de IRA en los grupos exploratorio y de validación, respectivamente. La tasa de filtrado glomerular estimada por la ecuación MDRD-4 demostró la mejor capacidad predictiva de IRA, con valores del área bajo la curva ROC entre 0,700 y 0,946. Se calcularon distintos puntos de corte para dicho parámetro, en función de la gravedad de la IRA y del tiempo transcurrido entre la cirugía y su medición. Los resultados obtenidos se confirmaron en el grupo de validación.
ConclusiónLa tasa de filtrado glomerular postoperatoria, estimada por la ecuación MDRD-4, mostró una alta capacidad de predicción de IRA con uno o 2días de antelación, en pacientes operados de cirugía cardíaca.
Cardiac surgery-associated acute kidney injury (CSA-AKI) has received considerable attention in recent years.1,2 Despite its multifactorial origin, some characteristics of CSA-AKI make it an interesting topic for research: high incidence, a known time of onset, a detailed epidemiology, and several accurate and validated prediction models based on well-defined risk factors.3,4 For all these reasons, cardiac surgery patients are frequently included in studies on biomarkers of acute kidney injury.
The last decade has seen the introduction of new biomarkers,5 some of which have been widely tested,6–8 However, despite more than 10 years of intense research, the new biomarkers of acute kidney injury are not yet ready for clinical use. Clinicians treating this syndrome are still in need of a therapeutic tool to help their patients. The study of the predictive capacity of these biomarkers in different settings, including cardiac surgery (CS), has provided a considerable body of new evidence. Unfortunately, none of these biomarkers has reached the clinical phase,9 and diagnosis and discrimination are still based on serum creatinine (sCr) concentration and urine output.
The estimated glomerular filtration rate (eGFR) based on sCr levels has already been a focus of research in CSA-AKI.10 Preoperative eGFR has been shown to be superior to sCr in predicting the need for renal replacement therapy (RRT) in the postoperative period,11 and is independently associated with other negative outcomes, such as prolonged hospitalisation or in-hospital mortality.12 In this study, we hypothesised that postoperative eGFR may be useful as an early predictor of AKI after CS. To test this hypothesis, we studied the predictive capacity of several common parameters used to measure postoperative renal function in a cohort of cardiac surgery patients. Specifically, we evaluated the use of eGFR calculated using the MDRD-4 (4-variable Modification of Diet in Renal Disease) formula, serum urea and their respective changes over time as biomarkers to predict AKI one or two days in advance. Biomarkers were defined according to the criteria put forward by the Biomarkers Definition Working Group.13
MethodsStudy design and populationRetrospective cohort study performed in a tertiary teaching referral hospital. Data from each adult cardiac surgery patient admitted to the cardiac surgery Intensive Care Unit (ICU) were collected prospectively from the Anaesthesia and Resuscitation department database. Only patients undergoing major surgical interventions between 1 January 2002 and 31 December 2013 were considered. The following types of surgery were included: coronary artery bypass grafting (CABG), valve repair or replacement surgery, combined procedures (CABG+valve surgery), and aortic surgery. Patients undergoing complex repair of congenital heart diseases, pericardiectomies, and transcatheter aortic valve implantation were excluded. We also excluded patients with chronic kidney disease who received any type of RRT before surgery, kidney transplant recipients, cases of early (<24h) postoperative death, patients requiring a left ventricular assist device (LVAD), and patients without a baseline sCr value, or cases where the start date of postoperative RRT was not known. In patients undergoing multiple major surgical interventions during the same stay, only data from the first intervention were considered. A small group of patients included in the study were operated 2 or more times on different admissions over the 12-year period. The study was approved by the Institutional Ethics Committee. Given its retrospective nature, the patients’ informed consent was not required.
Definitions and primary endpointAKI was defined using the sCr criterion put forward by the Acute Kidney Injury Network (AKIN),14 considering three different categories of severity. Patients were always assigned to the category of greatest severity. Baseline kidney function was assessed by preoperative sCr, taking the value closest to the date of the intervention. Day 0 was the day of admission to the ICU after surgery. Serum creatinine concentration was measured at least once a day while in the ICU and also, only if clinically necessary, during the postoperative period on the ward. CSA-AKI was diagnosed solely on the basis of sCr levels measured during the first postoperative week.
Given that sCr elevation usually occurs between one and three days after the intervention, the objective of this study was to evaluate the AKI predictive capacity of renal function parameters measured in routine lab tests or calculated 1 or 2 days in advance. Specifically, we analysed serum urea and eGFR MDRD-4,15 defined as:
eGFR MDRD-4=175× (sCr/88.4)−1.154× (age)−0.203×(0.742 if female)×(1.212 if black), and their respective changes over time: increased urea (Δurea) and reduced eGFR MDRD-4 (ΔMDRD-4). The primary endpoint is the time from the measurement of the biomarkers to the diagnosis of AKI.
Statistical analysisWe performed a descriptive analysis of the frequency of AKI, classified according to severity, during the first week after the intervention. We compared the clinical characteristics and risk factors of groups with and without AKI using standard statistical methods: the Student's t-test or the Mann–Whitney test to compare continuous variables, and the chi-square test or Fisher's exact test to compare proportions. Data were summarised in terms of mean (standard deviation), median (interquartile range) or proportion (absolute and relative frequencies), as appropriate. A p-value <0.05 was considered to be statistically significant.
The total sample was randomised into two sub-samples of similar size. The first sample (exploratory) was used to perform the main analysis, and the second to validate the results. Block randomisation was performed using normal or high sCr as the blocking factor in order to guarantee that both samples presented a similar number of episodes and that groups were homogeneous. Patients were assigned to the normal sCr category if their baseline sCr value was below the 75th percentile (93.7μmol/l for women and 111.38μmol/l for men); if not, they were assigned to the high category. Baseline sCr was chosen as a blocking factor because this variable has already shown a significant association with the development of post-CS AKI in a predictive model3 previously validated in our institution.16 Time-dependent ROC curves were calculated to assess the capacity of each parameter to predict an episode of AKI 1 or 2 days in advance.17 The ROC curve is one of the best statistical tools to describe the discrimination capacity of a diagnostic test when the value of the test is measured on a continuous or ordinal scale, and the result is measured on a binary scale (event/non-event).18 The values obtained from a diagnostic test range from null to perfect, and span the [0.5; 1] interval in their corresponding areas under the curve (AUC). The greater the AUC, the better the discrimination capacity of the test. An AUC of more than 0.7 shows that the test, marker or model has an acceptable discriminatory power.19 In our study, however, the primary endpoint is not a binary value but rather the time to an event, defined as the time from measurement of the parameter to diagnosis of AKI. In such data, therefore, other definitions of sensitivity and specificity are needed,20 and the definitions of cumulative sensitivity and dynamic specificity proposed by Heagerty et al.17 are used in this study. All patients presenting with AKI before a certain postoperative time point were defined as cases (their data were used to estimate cumulative sensitivity), while all the rest were controls (their data were used to estimate dynamic specificity). This means that the status of each patient can change from control to case depending on the postoperative time point. In this study, unlike in diagnostic studies, all patients are assumed to be controls when the parameter is measured18; therefore, parameter measurements from patients with AKI at this time point, if any, will not be included in the analysis.
The predictive capacity of each parameter was analysed on the basis of the 3 categories of AKI, I (mild), II (moderate), and III (severe), and the time (in days) from surgery to biomarker measurement (the day of surgery, 1 day later and 2 days later). A time-dependent ROC curve was constructed for each parameter and for each postoperative day using the survivalROC package of the statistical software R.17 The information obtained from the different ROC curves is summarised by their respective AUCs and their sensitivity at a fixed specificity. In order to extrapolate the results obtained to the entire population from which the sample was extracted, the confidence intervals (CI) for these AUCs were calculated using the bootstrap method. We also show the optimal cut-off points with their corresponding specificities at a fixed sensitivity.
Finally, we estimated the predictive capacity of the parameters in the second sample (validation sample). If the results obtained from this sample were equivalent to those from the exploratory sample, then it is safe to say that they are reliable and reproducible. The simplest method, and the one most widely used to prove equivalence, is Schuirmann's two one-sided test (TOST).21 Equivalence is demonstrated when the 90% CI for the AUC difference is within the acceptance limits (0.8–1.2) (the limits would be [0.8–1.25] if the log transformation is applied). To construct the CI, 500 bootstrap samples from the exploratory sample and 500 bootstrap samples from the validation sample were selected and their corresponding AUCs calculated. The CI was obtained using the rtost function of R's equivalent package.
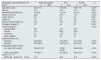
ResultsA total of 4167 major cardiac surgeries were performed over the 12-year study period. A total of 205 interventions were excluded (85 due to the type of surgery, 48 due to preoperative RRT, 38 due to early death, 19 due to previous kidney transplant, 15 were the second intervention during the same admission, five due to missing data, and three involved an LVAD). Some patients met more than one exclusion criterion. Of the remaining 3962 cases, a preliminary exploratory sample of 1980 cases was randomly selected. Table 1 shows the main demographic and clinical characteristics of this sample. The information relating to the validation sample can be seen in Table 1B of the additional material.
Main characteristics and risk factors in the exploratory sample and their correlation with the onset of AKI during the first postoperative week.
| Demographic characteristics and risk factors | Exploratory sample (n=1980) | AKI (n=610) | No AKI (n=1370) | p |
|---|---|---|---|---|
| Age (SD) in years | 67.4 (11.5) | 70.9 (9.9) | 65.9 (11.8) | <0.001 |
| Men (%) | 57.5 | 57.4 | 57.5 | 0.961 |
| Standard EuroSCORE (SD) | 5.9 (2.9) | 7.2 (2.9) | 5.4 (2.7) | <0.001 |
| History of CHF (%) | 20.8 | 29.3 | 17.3 | <0.001 |
| LVEF <35% (%) | 3.6 | 4.3 | 3.4 | 0.294 |
| COPD (%) | 7.0 | 9.5 | 5.9 | 0.001 |
| Previous cardiac surgery (%) | 12.5 | 18.9 | 9.6 | <0.001 |
| Emergency surgery (%) | 3.0 | 4.3 | 2.5 | 0.046 |
| Type of surgery (%) | <0.001 | |||
| Isolated CABG | 30.4 | 24.4 | 33.0 | |
| Valvular | 51.3 | 53.6 | 50.3 | |
| Combineda | 9.7 | 13.8 | 8.0 | |
| Other surgeriesb | 8.6 | 8.2 | 8.7 | |
| CPB times (SD) in min | ||||
| Ischaemia | 64.6 (34.5) | 72.4 (36.9) | 61.1 (32.8) | <0.001 |
| Perfusion | 89.0 (46.0) | 102.5 (51.6) | 83.0 (41.9) | <0.001 |
| Preoperative kidney function | ||||
| sCr, mean (SD) in μmol/l | 94.62 (31.05) | 107.36 (41.58) | 88.94 (22.8) | <0.001 |
| eGFR, mean (SD) in ml/min/1.73m2 | 70.4 (20.1) | 62.4 (22.4) | 73.9 (17.9) | <0.001 |
| eGFR <60ml/min/1.73m2 (%) | 31.3 | 49.3 | 21.2 | <0.001 |
CABG: coronary artery bypass grafting; CHF: congestive heart failure; COPD: chronic obstructive pulmonary disease; CPB: cardiopulmonary bypass; DM: diabetes mellitus; eGFR: preoperative glomerular filtration rate estimated by the MDRD-4 formula; LVEF: left ventricular ejection fraction; sCr: serum creatinine; SD: standard deviation.
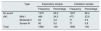
The frequency and severity of AKI in both samples are shown in Table 2.
Distribution of events/non-events in both samples.
| Type | Exploratory sample | Validation sample | |||
|---|---|---|---|---|---|
| Frequency | Percentage | Frequency | Percentage | ||
| No event | 1370 | 69.2 | 1357 | 68.4 | |
| AKI | Mild I | 486 | 24.5 | 475 | 23.9 |
| Moderate II | 64 | 3.2 | 71 | 3.5 | |
| Severe III | 60 | 3.0 | 77 | 3.8 | |
| Total | 1980 | 100 | 1982 | 100 | |
p=0.917 (chi-square test).
Only the results of the best biomarker (eGFR MDRD-4) are shown. The results for the rest of the parameters (urea, Δurea, ΔMDRD-4 and ΔsCr) can be seen in Appendix B of the additional material.
Fig. 1 shows the time-dependent ROC curves corresponding to the 3 categories of AKI, also taking into account the time from surgery to AKI. The curves in Fig. 1A are derived exclusively from data of cases with severe AKI (AKIN stage III) and controls, those in Fig. 1B from cases with moderate AKI (AKIN stage II) and controls, and finally those in Fig. 1C from mild cases and controls. These curves show the estimated cumulative sensitivity and dynamic specificity of eGFR MDRD-4. Estimates have been calculated for prediction one day (continuous line) and two days (dotted line) in advance. As shown, sensitivity and specificity depend not only on the time between measurement and diagnosis of the event, but also on the time from CS to the measurement. One-day predictions are always better (continuous line), particularly when MDRD-4 is measured two days after surgery.
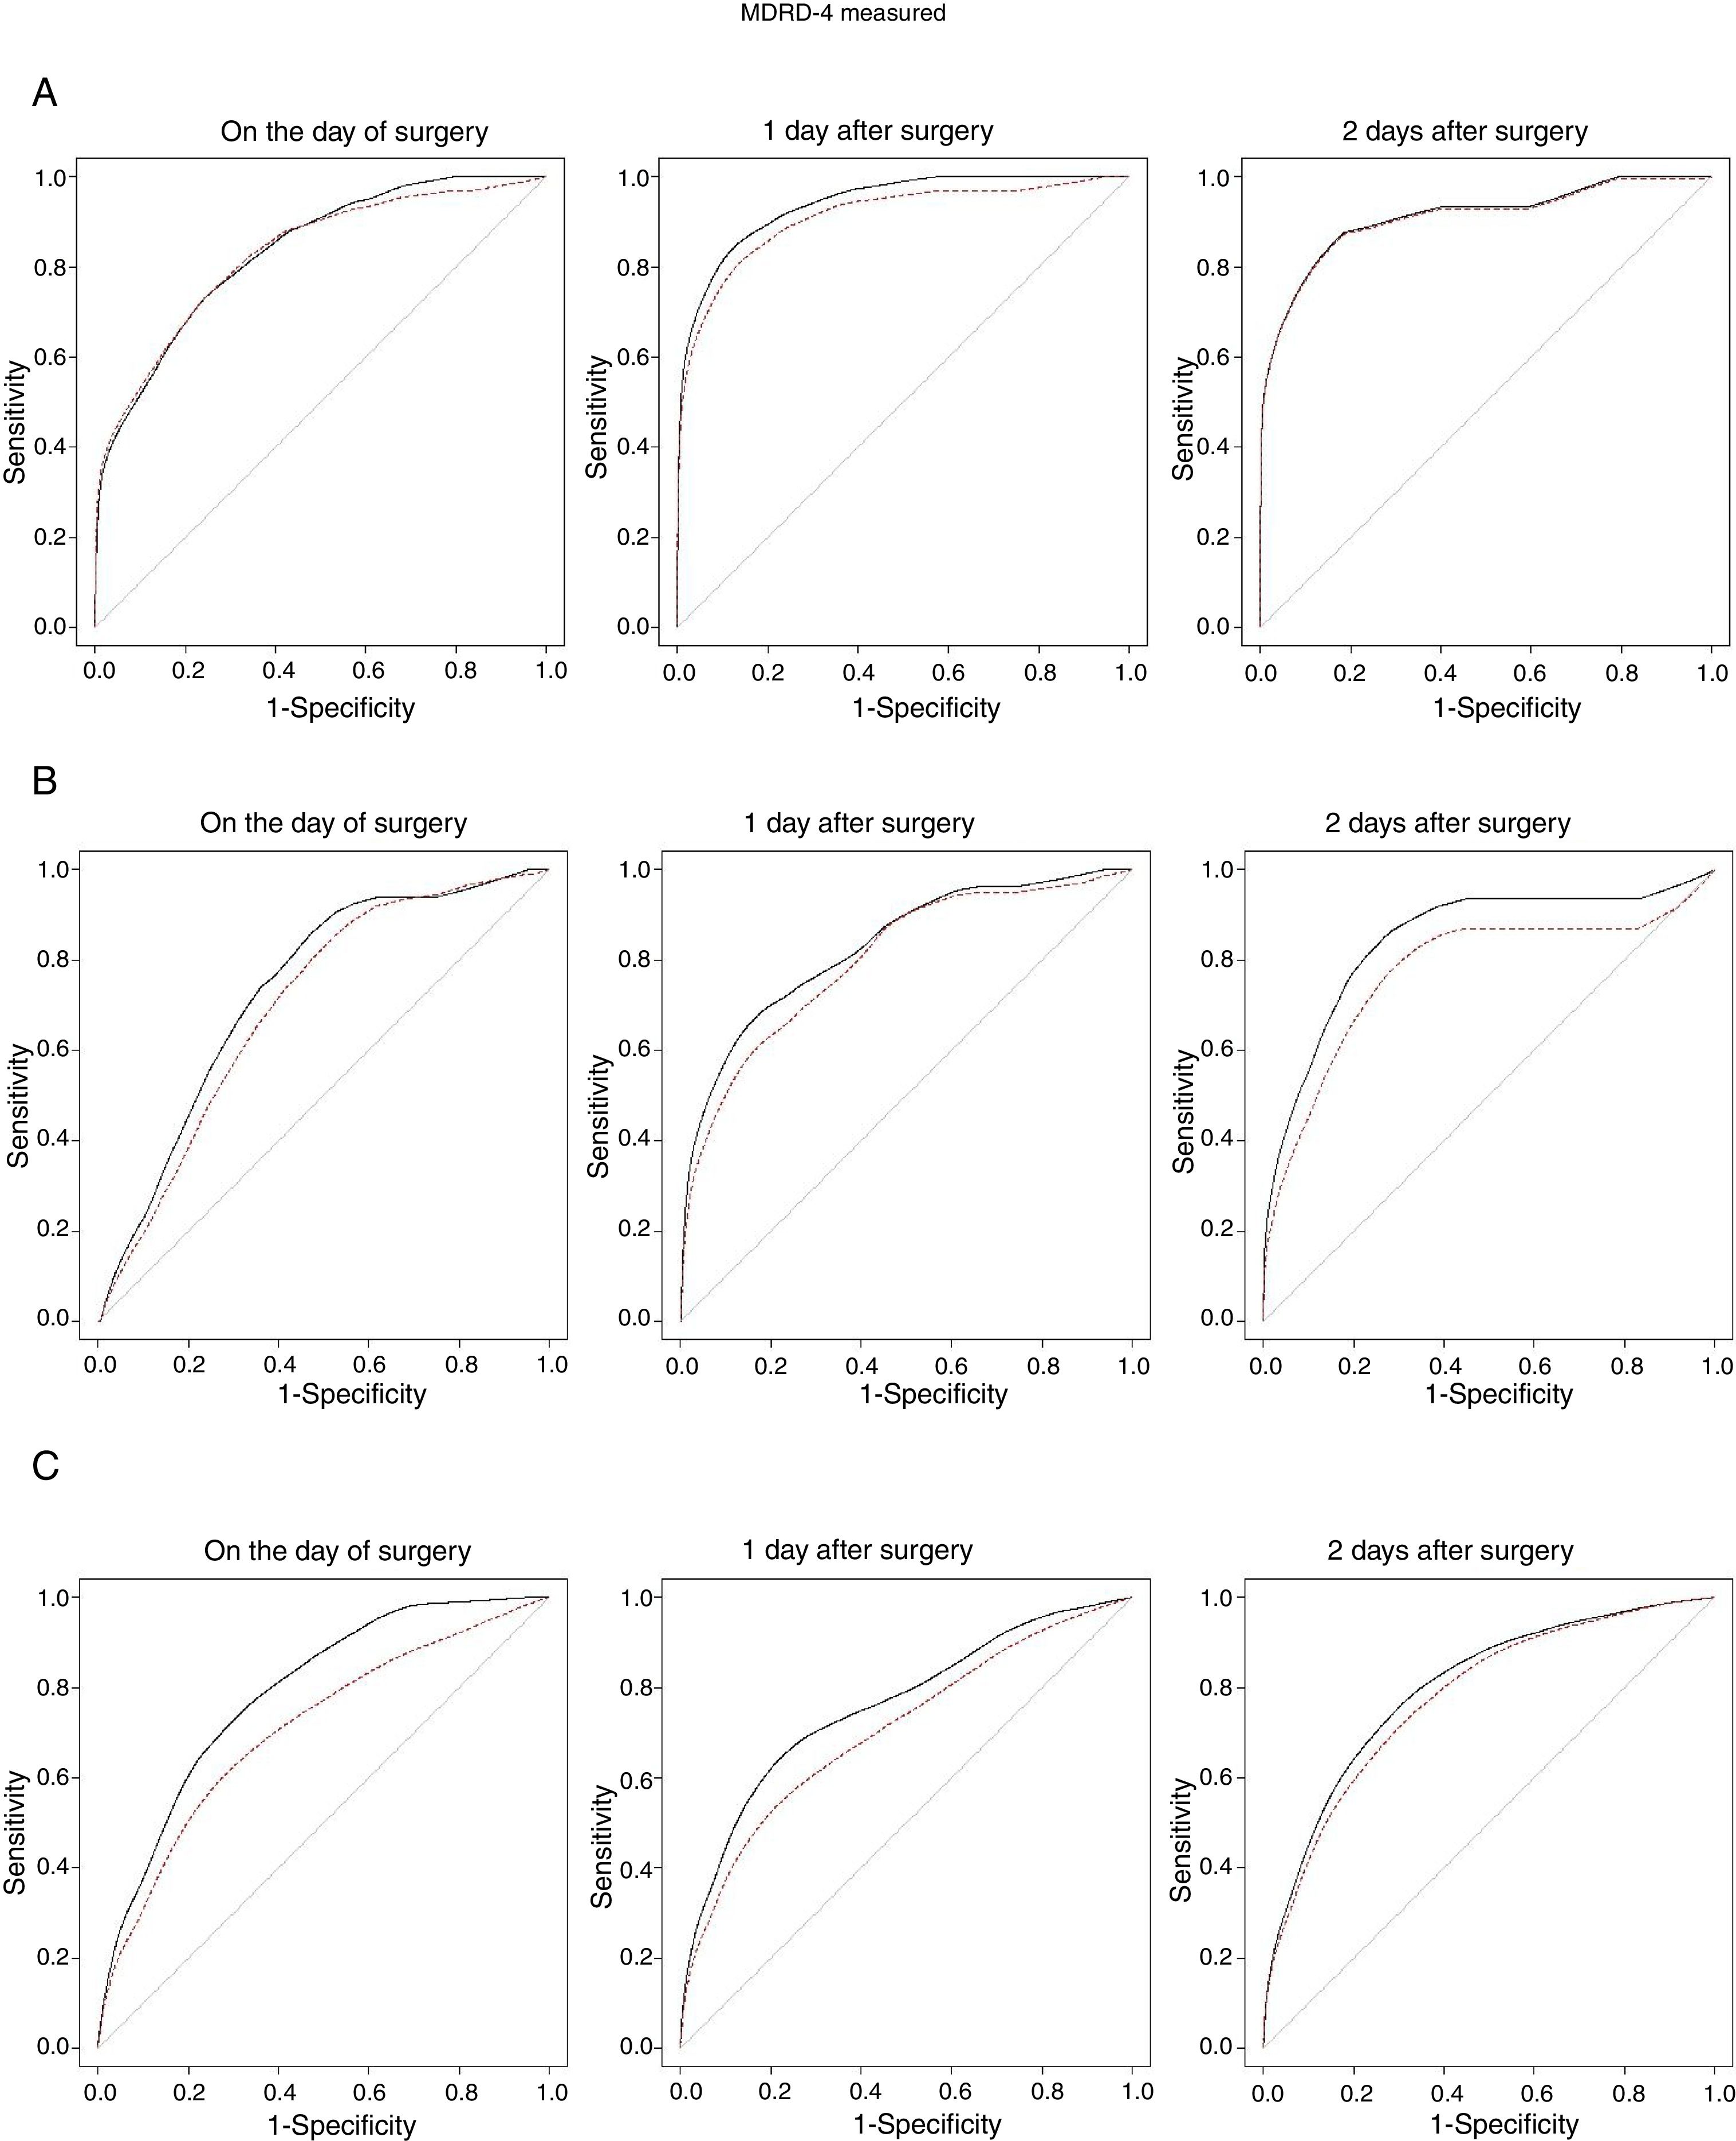
Time-dependent ROC curves (cumulative/dynamic) in the exploratory sample. Cases of AKI versus control: (A) Severe AKI (stage III). (B) Moderate AKI (stage II). (C) Mild AKI (stage I). The unbroken line corresponds to the 1-day prediction and the dotted line corresponds to the 2-day prediction.
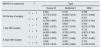
The information provided by these curves can be easily interpreted from their corresponding AUCs (Table 3). The eGFR MDRD-4 biomarker showed a high predictive capacity for AKI in all categories (i.e., mild, moderate and severe) regardless of the day the measurement was taken, with AUC values higher than 0.7 in all cases. Similar results are obtained when sensitivity values are calculated with a specificity of 80% (Table 4).
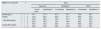
AUC (95% CI) of time-dependent ROC curves (cumulative/dynamic) for eGFR MDRD-4 in the exploratory sample.
| MDRD-4 is measured | ta | Type | ||
|---|---|---|---|---|
| Severe III | Moderate II | Mild I | ||
| On the day of surgery | t=1 | 0.833 (0.775; 0.912) | 0.733 (0.629; 0.814) | 0.788 (0.751; 0.830) |
| t=2 | 0.827 (0.763; 0.905) | 0.700 (0.638; 0.761) | 0.707 (0.672; 0.743) | |
| 1 day after surgery | t=1 | 0.946 (0.901; 0.972) | 0.823 (0.747; 0.910) | 0.763 (0.721; 0.795) |
| t=2 | 0.919 (0.835; 0.962) | 0.797 (0.722; 0.875) | 0.712 (0.673; 0.742) | |
| 2 days after surgery | t=1 | 0.939 (0.810; 0.978) | 0.820 (0.717; 0.936) | 0.794 (0.767; 0.832) |
| t=2 | 0.936 (0.815; 0.974) | 0.759 (0.655; 0.882) | 0.775 (0.749; 0.810) | |
Sensitivity values as a percentage for a fixed specificity of 80%. Exploratory sample.
| MDRD-4 is measured | ta | Type | ||
|---|---|---|---|---|
| Severe III | Moderate II | Mild I | ||
| On the day of surgery | t=1 | 67.4 | 45.4 | 60.4 |
| t=2 | 67.6 | 38.6 | 50.4 | |
| 1 day after surgery | t=1 | 89.4 | 70.0 | 62.0 |
| t=2 | 85.6 | 63.2 | 52.3 | |
| 2 days after surgery | t=1 | 87.9 | 77.4 | 64.1 |
| t=2 | 87.6 | 66.5 | 59.4 | |
The optimal cut-off points for eGFR MDRD-4, with a sensitivity of 80%, are shown in Table 5. Appendix B of the additional material (Table A.4) shows similar analyses using baseline changes in sCr (ΔsCr) as the biomarker. As expected, sCr is not a good predictor, with low AUC values in all cases. Although serum urea, Δurea and ΔMDRD-4 showed an acceptable predictive capacity in some cases, they were never superior to MDRD-4.
Optimal cut-off points for MDRD-4 and their corresponding specificities, establishing a sensitivity of 80% for the exploratory sample.
| MDRD-4 is measured | ta | Type | |||||
|---|---|---|---|---|---|---|---|
| Severe III | Moderate II | Mild I | |||||
| Cut-off point | Specificity % | Cut-off point | Specificity % | Cut-off point | Specificity % | ||
| On the day of surgery | t=1 | 76.1 | 67.1 | 81.0 | 57.7 | 76.9 | 62.1 |
| t=2 | 73.8 | 68.2 | 84.9 | 57.7 | 86.9 | 45.5 | |
| 1 day after surgery | t=1 | 50.8 | 92.0 | 75.0 | 61.7 | 79.2 | 50.6 |
| t=2 | 55.0 | 88.9 | 76.3 | 59.8 | 86.0 | 42.2 | |
| 2 days after surgery | t=1 | 46.3 | 93.4 | 63.5 | 74.5 | 69.5 | 63.8 |
| t=2 | 46.8 | 93.2 | 69.8 | 65.9 | 72.9 | 59.4 | |
The units of the cut-off points for eGFR MDRD-4 are ml/min/1.73m2.
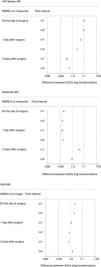
The results obtained from the exploratory sample were validated in the validation sample (n=1982). The 90% CIs obtained from the equivalence tests are shown in Fig. 2. The results from this second sample were similar to those obtained from the first.
Discussion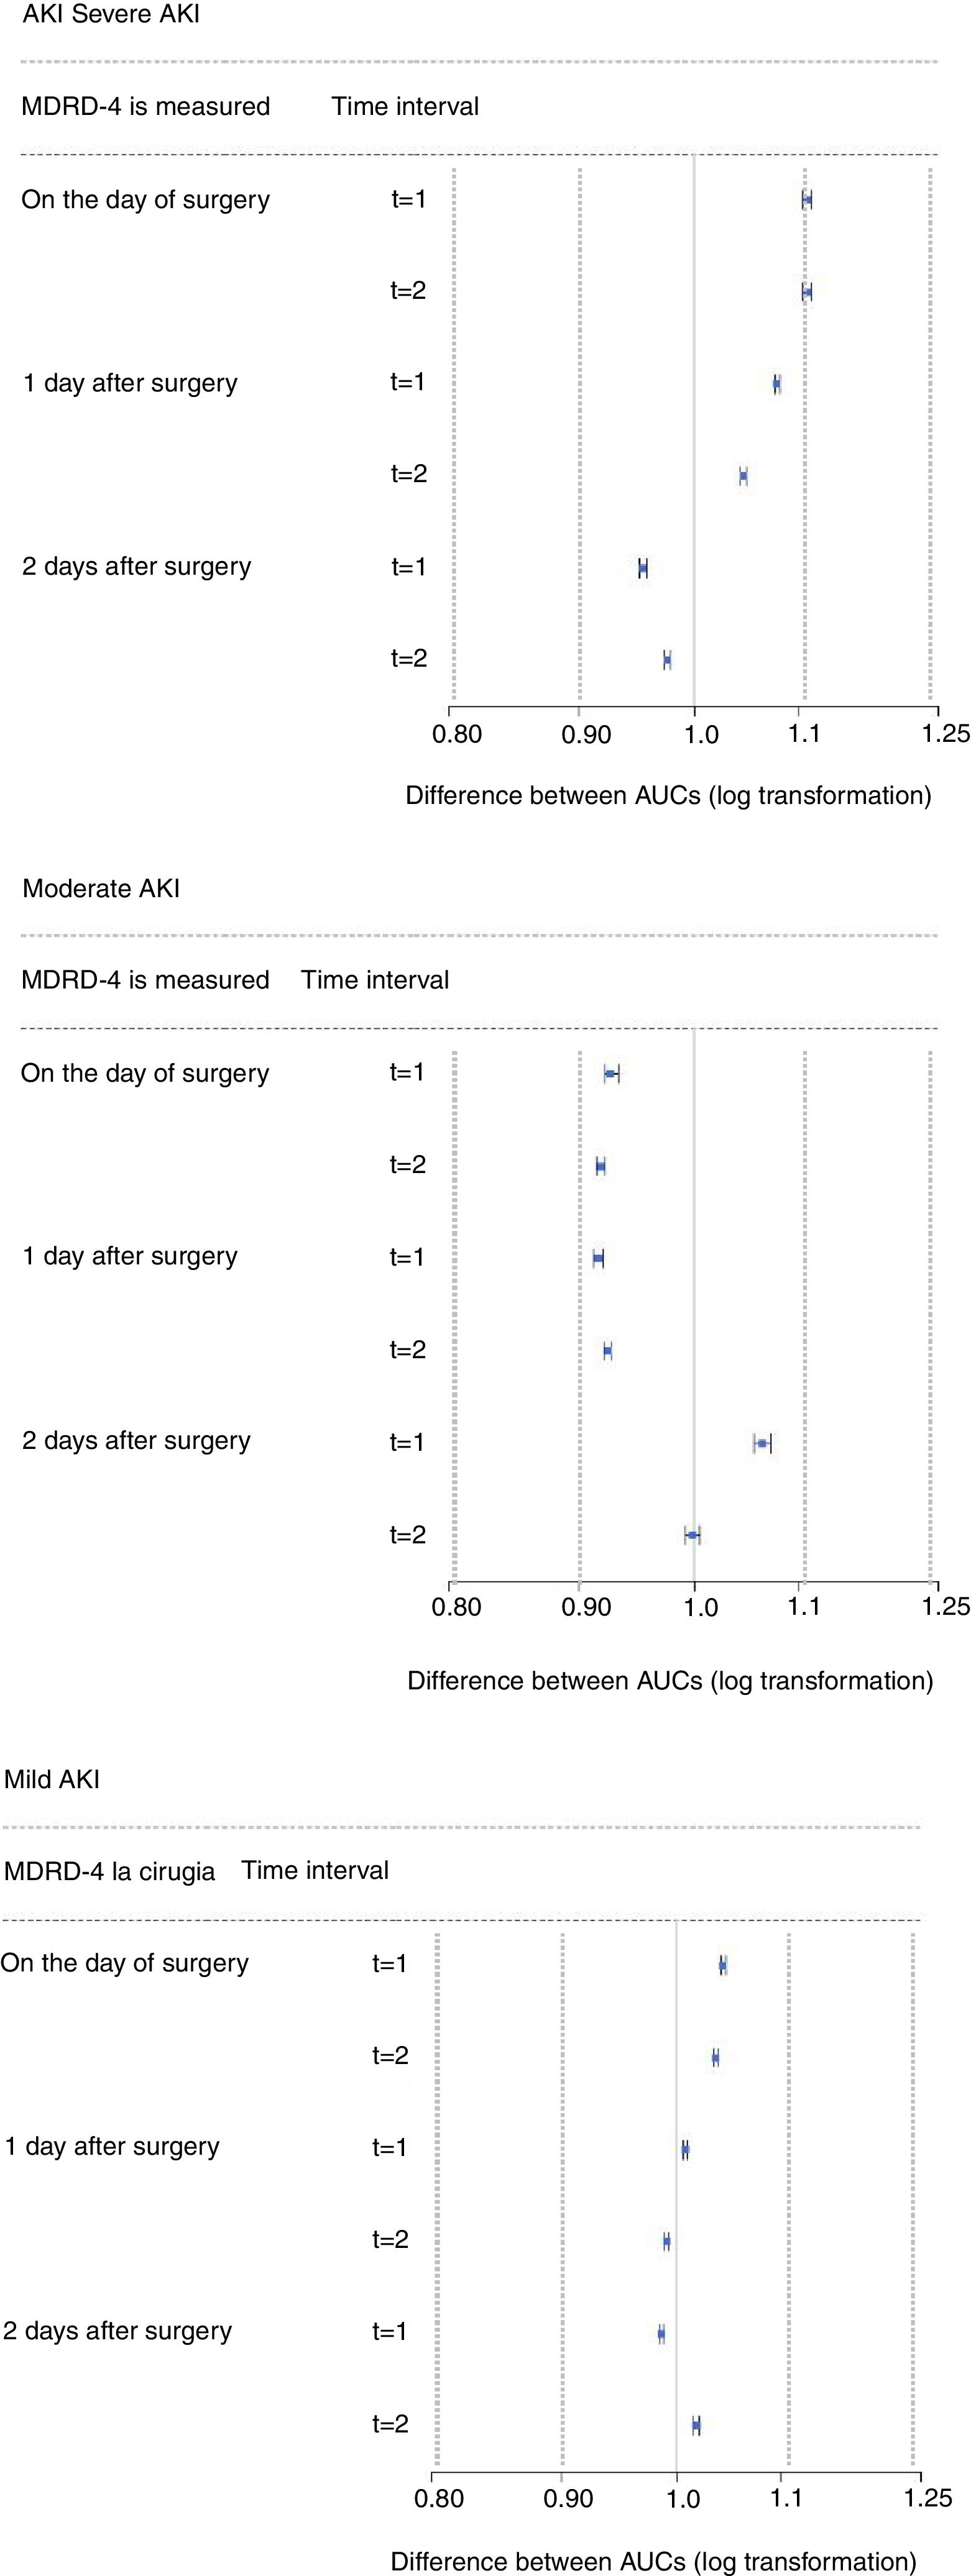
In this study, we used time-dependent ROC curves to evaluate the capacity of certain common, inexpensive kidney function laboratory biomarkers to predict onset of CSA-AKI one or two days in advance. The main finding is that eGFR calculated using the MDRD-4 formula is a reliable predictor of AKI after major CS. The limitations of sCr for the early diagnosis of AKI are well known, and have also been confirmed using this methodology. In the specific context of CS, the usual delay before sCr values become elevated after the intervention is amplified due to the haemodilution and positive fluid balance typical of cardiopulmonary bypass. It is also well known that, in the presence of AKI, eGFR decrease precedes an increase in sCr. Likewise, the determination of GFR based on equations such as MDRD does not reflect real filtration in acute situations. These formulas are unsuitable for patients with AKI.22 In our study, however, eGFR was used as a biomarker to predict a future event, not as a parameter to quantify real-time kidney function. Surprisingly, the estimation of GFR based on sCr weighted by certain demographic characteristics (age, race, gender) was superior to GFR obtained from sCr alone in predicting the onset of AKI.
Severe CSA-AKI, defined by the need for RRT, has a poor prognosis, with hospital mortality rates of around 50%. Various predictive indexes that include preoperative risk factors have been developed3,4,23 and validated16,24 to detect at-risk subjects and improve patient information. New serum and urine biomarkers of AKI have greatly improved the early detection of an episode of AKI in different clinical scenarios, starting with paediatric CS more than a decade ago.25 The usefulness of all these AKI biomarkers has been evaluated with conventional ROC curves. These studies estimate the sensitivity and specificity of the biomarker, the optimal cut-off points, and the time from the peak value of the biomarker to the diagnosis of AKI.
We took a different approach. Cox regression models are used to process time to event data when the aim is to study the association between certain biomarkers and future events. The main problem is that a biomarker can show a close association with the event, and nevertheless, not be useful for discrimination. Heagerty17 introduced the concept of the time-dependent ROC curve as an extension of standard ROC curves for the analysis of time to event data. To our knowledge, time-dependent ROC curves have not been used in the specific context of CSA-AKI with a real set of clinical data. Pepe et al.26 compared different methods of estimating time-dependent ROC curves, but used simulated data. More recently, Pitili et al.27 used time-dependent ROC curves to evaluate a combination of biomarkers to predict the onset of RRT in mechanically ventilated ICU patients. In our study, we used cumulative/dynamic time-dependent ROC curves, the most widely used approach.17
The information provided by time-dependent ROC curves should be interpreted in terms of proportions. For example, one day after surgery (see Table 4), using eGFR MDRD-4 as a biomarker and assuming a specificity of 80%, 89.4% of cases of severe AKI (AKIN stage III) can be predicted one day in advance, and 85.6% two days in advance. As expected, when the biomarker is measured on the day of surgery, the predictive capacity decreases. For example, on the day of surgery, only 67.4% of patients with severe AKI and 45.4% of patients with moderate AKI (AKIN stage II) can be predicted one day in advance. This same result has also been reported with some of the latest biomarkers,28 and is due to both the brief interval from the start of injury to measurement, and to the haemodilution that occurs during cardiopulmonary bypass (CPB), which is when the parameters are measured on admission to the ICU.
We have also provided the optimal cut-off points (Table 5), which are extremely useful when applying the biomarker in daily practice. The eGFR MDRD-4 values measured on the day of surgery did not discriminate between cases and controls in any of the three AKI categories. However, if measured one day after surgery, a patient will be classified as AKIN stage III 24h in advance if their eGFR MDRD-4 is less than or equal to 51ml/min/1.73m2, as AKIN stage II when 51<MDRD-4≤75, as AKIN stage I when 75<MDRD-4≤80, and as no AKI when their eGFR MDRD-4 is >80. From our point of view, this information is particularly valuable, since many patients are discharged to the ward the day after surgery. Using these cut-off points, the value of eGFR MDRD-4 the day after surgery can help decide the best option for the patient. These options include: discharge from the ICU (versus remaining in the unit or transfer to an intermediate care unit), administration of nephrotoxic drugs (suspension, switch or restart), the need for strict glycaemic control, the maintenance of haemodynamic monitoring, and consultation with specialists from the Nephrology Department.29 Recently, Meersch et al.30 showed that the implementation of a “KDIGO measures bundle in cardiothoracic surgery” in patients undergoing CS with a high risk of AKI, identified by means of a new AKI biomarker measured four hours after CPB, reduced the frequency and severity of CSA-AKI.
This study has several limitations. First, its retrospective, single-site design called for prospective, external validation: the cut-off points obtained may not be transferable to other institutions. Secondly, defining AKI on the basis of the AKIN's sCr criterion is open to criticism: we were unable to diagnose AKI using the urine output criterion because the database did not include this variable – a common problem in most retrospective studies. In the specific context of CS, diagnosing AKI on the basis of the urine output criterion is controversial, and has recently been called into question.31 There is no consensus on the optimal definition and classification of AKI in CS, although some authors propose a modified RIFLE classification to avoid over-diagnosis of AKI when both AKIN criteria are used.32 This phenomenon mainly affects patients at AKIN stage I. However, in our sample, the predictive capacity of MDRD-4 improved with the severity of AKI (Table 3). Because prognosis is directly related to the severity of AKI, we believe that over-diagnosis is unlikely in patients with mild AKI, considering that using eGFR MDRD-4 as a biomarker is particularly useful in moderate and severe cases. A final limitation is the effect of the use of baseline values of eGFR MDRD-4. The performance of some new biomarkers (for example, urine NGAL) is known to be affected by the presence of chronic kidney disease,33 and this means that the test is not informative. We did not explore the role of baseline eGFR MDRD-4 values in predicting AKI due to the small number of cases with moderate or severe AKI. In patients with a preoperative eGFR under 60ml/min/1.73m2, the probability of presenting with an episode of AKI and the optimal cut-off points for MDRD-4 may differ from the figures given in Tables 4 and 5.
ConclusionDetermination of eGFR MDRD-4 one or two days after surgery is a good predictive tool for AKI in patients undergoing major CS. Until new, more accurate biomarkers are found, the cut-off points for this routine, low-cost biomarker can help guide decision-making in the ICU. The design of this study, with its sample size, primary endpoint defined as time to event, and the availability of serial measures for the different parameters analysed, is the ideal setting for using time-dependent ROC methodology, and this research will hopefully help to raise awareness and increase acceptance of this methodology.
FundingThis study was partially funded by research project no. MTM2016-75351-R of the Spanish Ministry of Economy, Industry and Competitiveness.
Conflicts of interestThe authors declare that they have no conflicts of interest.
To all the personnel of the Cardiovascular Surgery ICU, for their unfailing help in maintaining the database.

Please cite this article as: Candela-Toha Á, Pardo MC, Pérez T, Muriel A, Zamora J. La tasa de filtrado glomerular estimada es un biomarcador precoz de la insuficiencia renal aguda asociada a la cirugía cardíaca. Nefrologia. 2018;38:596–605.


