Background. A proper measurement of renal function is important for diagnosis and stratification of kidney disease. Several methods have been used to predict glomerular filtration rate, however the results have been variable depending on the population studied. We aimed to compare the performances of 4 glomerular filtration rate tests with inulin clearance in patients with chronic renal insufficiency and in healthysubjects. Methods. Inulin clearances performed in 51 individuals with stable renal function were selected. For each of them, we computed 4 estimates: the 24-hour creatinine clearance, technetium (99mTc-DTPA) clearance, Cockcroft-Gault and Levey formulas. Their respective performance was assessed by correlation (Pearson's correlation coefficient) and agreement (Bland and Altman method). Results. Each glomerular filtration rate test closely correlated with inulin clearance. Nevertheless, all GFR tests displayed considerable lack of agreement with lower limits ranging from 15 to 42 ml / min, for comparison with inulin-technetium and inulin with Levey formula, respectively and upper limits of agreement that could range from 20 to 56 ml / min, for comparison with inulin-technetium and Inulin with Levey formula,respectively. Conclusion. The measurement of glomerular filtration rate determined via different methods shows a wide range of variation when compared with inulin clearance, which should be considered in daily clinical practice during the evaluation of renal function.
Introducción. La medición de la función renal es importante para el diagnostico y estratificación de las enfermedad renales. Varios métodos han sido empleados para predecir la tasa de filtración glomerular, sin embargo los resultados han sido variables según la población estudiada. En este estudio se compararon 4 métodos de medición de la función renal con la depuración de inulina. Métodos. Se realizó depuración de inulina, tecnecio y creatinina y se calculó la filtración glomerular con las fórmulas de Cockcroft-Gault y Levey en 51 sujetos con función renal estable. El análisis estadístico se realizó mediante el coeficiente de correlación de Pearson y con análisis de concordancia (método de Bland y Altman). Resultados. Se incluyeron 51 sujetos de los cuales 35 (68.6%) se encontraban con algún grado de insuficiencia renal. Los 4 métodos evaluados mostraron una correlación significativa con la depuración de inulina. Sin embargo, todos mostraron considerable falta de concordancia, con límites inferiores que variaban desde 15 hasta 42 ml/min, para las comparaciones de Inulina con tecnecio e inulina con la fórmula de Levey, respectivamente, y límites de concordancia superiores que podían ir desde 20 y hasta 56 ml/min, para las comparaciones de Inulina con tecnecio e Inulina con la fórmula de Levey, respectivamente. Conclusiòn. La medición de la tasa de filtración glomerular efectuada a través de diferentes métodos muestra un amplio rango de variación al compararlos con la depuración de inulina, lo cual debe de considerarse en la práctica clínica diaria al evaluar la función renal.
INTRODUCTION
Inulin clearance is the most widely accepted method for estimating glomerular filtration rate (GFR);1,2 however, this is a method that, due to its complexity, cannot be routinely used in clinical practice. This has led to the search for other markers that would make it possible to calculate GFR precisely and with greater ease, especially in a clinical setting.
Serum creatinine levels are not considered appropriate as the only measurement of renal function, especially for the detection of early stages of chronic renal failure and, in cases of advanced kidney disease, basically due to the tubular secretion component.3,4
Some exogenous markers have been proposed as alternatives; among them, radioactive contrast agents such as 51Cr- Ethylene Diamine Tetra-acetic (EDTA), 125I-iothalamate and technetium-99m-diethylene triamine penta acetic acid (99mTc- DTPA).5-7
The advantages of measuring GFR using these radioisotopes include the fact that the measurement of these compounds, even at very low concentrations, is extremely precise and that very small non-toxic amounts may be used. 99mTc-DTPA decays by isomeric transition and has a physical half life of 6.02 hours,8 which sometimes is a practical problem for its use and measurement. However, this also decreases radiation exposure and allows fast GFR assessment. Furthermore, DTPA is exclusively excreted by the kidney.
Creatinine clearance in 24 hour urine has been a widely used tool, but in some patients (children, elderly, patients with pelvic conditions) errors are frequently seen due to incomplete collection of urine samples. Clearance under conditions of “water diuresis” makes it possible to maintain a constant urinary flow and to carry out adequate collection of urine samples in short precise time periods. Meanwhile, different formulas have been developed to estimate renal clearance. One of the most widely used is the one proposed in 1976 by Cockcroft and Gault,9 and, more recently the equation developed by Levey as part of the MDRD Study (Modification of Diet in Renal Disease);10,11 however, these formulae have shown variable results according to the population studied.
Identification and appropriate stratification of patients with renal disease is an important component of clinical nephrology. Consequently, early treatment can be implemented, preventing complications and progression of renal damage.
Our objective was to compare four methods for measuring GFR (technetium clearance, creatinine clearance, Cockroft formula and Levey formula) with inulin clearance, as to correlation and concordance.
MATERIALS AND METHODS
From March 2004 to March 2005, a total of 51 patients underwent procedures of inulin, creatinine and technetium clearance in the Department of Nephrology of the National Cardiology Institute Ignacio Chávez. We included patients > 15 years of age, which had stable renal function for, at least, the last 3 consultations. We excluded pregnant women, patients with anatomical alterations that made it impossible to appropriately collect urine (pelvic conditions or prostate disease), patients that were receiving renal function substitution (peritoneal dialysis or haemodialysis) and patients who could not ingest water due to medical contraindications.
All patients were prescribed a daily water intake of at least 2 litres for 72 hours prior to the study. The studies started at approximately 08:00 hours, fasting, with a period of hydration by means of water intake at a rate of 10-15ml/kg body weight during at least one hour prior to the study; a stable urinary flow was maintained (> 4ml/min), during the rest of the study at a rate of 2-10ml/min.
The administration of inulin was begun at the end of the hydration periods with a loading dose of 22.5mg/kg (Inutest® 25%; Fresenius, Linz, Austria), and immediately continued with an intravenous infusion for 210 minutes. After a 60 minute balance period, sampling was begun (urine and blood) every half hour for 5 periods. The urine samples were taken by spontaneous voiding, and the blood samples, by venopuncture of the contralateral arm to the one receiving the infusion. Inulin concentrations were measured using a standard colorimetric assay (Antrona method) in a spectrophotometer (Spectronic 21D®, Milton Roy). Clearance was calculated using the formula U x V/ (P1 + P2/2) and the GFR was adjusted for 1.73m2 BA. 99mTc-DTPA was administered simultaneously with the inulin. 1.5mCi were administered in an intravenous bolus and subsequently 2mCi were administered in infusion during the remaining 210 minutes. The first samples of urine and blood described in the protocol were analysed. The samples were analysed by duplicate with a well-counter (Gammacord®), that registers the activity of one millilitre from each tube for one minute (count/ml/minute).
Urine and blood samples were also used to measure the corresponding creatinine concentrations for each period. Creatinine was measured in a TRACE 120® autoanalyser using the Jaffé technique.
Estimation of creatinine clearance using the Cockroft-Gault formula was performed according to the original description: ([140 age – age] x weight) ÷ (CrS x 72) (women x 0.85). Furthermore, GFR was calculated according to the MDRD equation: 170 x serum creatinine–0.999 x –age0.176 x 0.762 (if female sex) x 1.180 (if patient is black) x urea nitrogen in blood–0.170 x concentration of serum albumin–0.318.
Statistical analysis
Data are expressed as mean ± standard deviation. The association test between two methods was carried out by simple linear regression analysis, and Pearson’s correlation coefficient was expressed as the result. The Bland and Altman12 method was used to determine concordance between two tests.
We drew a graph for each GFR measurement method and this shows the difference between estimated GFR and GFR measured with inulin and compares them with the average of both measurements. Ninety-five percent of the differences fall between the two limits that define the concordance interval: The lower limit, which is the average of the difference minus 2 standard deviations (SD) and the upper limit which is the average of the difference plus 2 standard deviations (SD).
We have detailed the limits of concordance with their respective 95% confidence interval for each method used to measure the GFR. P < 0.05 was considered significant. We used the SPSS version 15 for Windows statistical program.
RESULTS
This study included 51 patients, of which 16 (31.4%) were healthy subjects that were under study as kidney donors, 12 (23.5%) of the patients had systemic arterial hypertension, 5 (9.8%) suffered from diabetic nephropathy, 4 (7.8%) had focal and segmental glomerulonephritis, 3 (5.9%) were patients that had received kidney transplants and 11 (21.6%) had diverse diseases (systemic lupus eritematosus, antiphospholipid antibodies syndrome, rheumatoid arthritis, Takayasu’s arteritis and thin basal membrane disease). Of the 51 patients included, 28 were men (54.9%) and 23 women (45.1%); the patient’s average age was 39.75 ± 14.89 (range 15-76) years of age, and they had an average weight of 67.95 ± 15.12kg.
The amount of water ingested by the patients during the procedure was, on average, 2,360ml ± 941ml, and an average diuresis was maintained of 1,738 ± 698ml, which meant that the average urinary flow was 6.37 ± 2.62ml/min.
The average results of the different GFR measurement methods are the following: inulin clearance 73 ± 40ml/min/1.73m2, technetium clearance 70 ± 38ml/min/1.73m2, creatinine clearance 73 ± 37ml/min/1.73m2, Cockcroft formula 75 ± 37ml/min/1.73m2 and Levey formula 67 ± 37ml/min/1.73m2.
COMPARISON BETWEEN INULIN CLEARANCE AND 99MTC-DTPA CLEARANCE
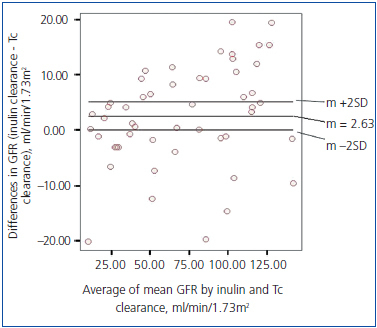
In the population studied, average inulin clearance was 73 ± 40ml/min/1.73m2, whereas average technetium clearance was 70 ± 38ml/min/1.73m2; the average of the difference of both procedures was 2.62ml/min/1.73m2.
The correlation between GFR measured with inulin and GFR measured with technetium was significant and positive (r = 0.97; r2 = 0.94; p < 0.01).
The concordance analysis for the global population showed a lower limit of –15ml/min/1.73 m2 (CI 95%: –20; –11) and an upper limit of 21ml/min/1.73m2 (CI 95%: 16; 25) (Figure 1). When analysing only the healthy subjects (donors), the lower limit of concordance was –19ml/min/1.73m2 (CI 95%: –30; –8) and the upper limit of concordance was 28ml/min/1.73m2 (CI 95%: 17; 39).
Comparison between Inulin Clearance and Creatinine Clearance
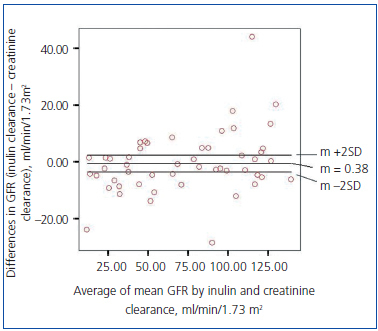
The creatinine clearance average was 73 + 37ml/min /1.73m2, and the average difference between the inulin and the creatinine methods was –0.38ml/min/1.73m2. There was a significant positive correlation between GFR measured with inulin and creatinine clearance (r = 0.96; r2 = 0.92; p < 0.01).
The concordance analysis for the global population showed a lower limit of -22ml/min/1.73m2 (CI 95%: -28; -17) and an upper limit of 22ml/min/1.73m2 (CI 95%: 16; 27) (Figure 2). When analysing only the healthy subjects (donors), the lower limit of concordance was -29ml/min/1.73m2 (CI 95%: -44; - 15) and the upper limit of concordance was 34ml/min/1.73m2 (CI 95%: 19; 48).
Comparison between Inulin Clearance and Cockroft Formula
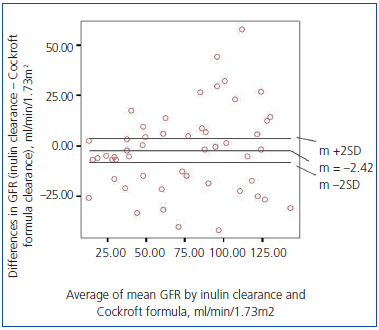
Average clearance with the Cockroft formula was 75 + 37ml/min/1.73m2, and the average of the difference when compared to inulin clearance was –2.42ml/min/1.73m2. A significant positive correlation was found with inulin clearance (r = 0.86, r2 = 0.74, p < 0.01).
The concordance analysis for the global population showed a lower limit of -44ml/min/1.73m2 (CI 95%: -54; -32) and an upper limit of 39ml/min/1.73m2 (CI 95%: 29; 49) (Figure 3). When analysing only the healthy subjects (donors), the lower limit of concordance was -52ml/min/1.73m2 (CI 95%: -77; - 27) and the upper limit of concordance was 55ml/min/1.73m2 (CI 95%: 30; 80).
Comparison between Inulin Clearance and Levey Formula
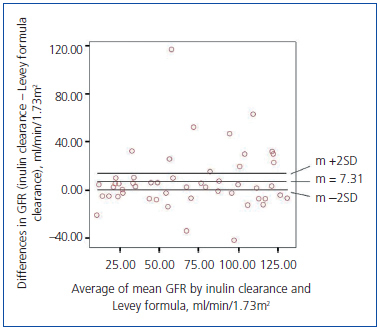
Average clearance with the Levey formula was 67 + 37ml/min/1.73m2, and the average of the difference compared to inulin was 7.31ml/min/1.73m2; there was a significant positive correlation with inulin clearance (r = 0.88, r2 = 0.78, p < 0.01).
The concordance analysis for the global population showed a lower limit of -42ml/min/1.73m2 (CI 95%: -54; -30) and an upper limit of 57ml/min/1.73m2 (CI 95%: 45; 69) (Figure 4). When analysing only the healthy subjects (donors), the lower limit of concordance was -41ml/min/1.73m2 (CI 95%: -64; - 18) and the upper limit of concordance was 58ml/min/1.73m2 (CI 95%: 35; 80).
Table 1 shows the limits of concordance of the 4 renal function tests compared with inulin clearance.
DISCUSSION
Chronic renal failure is a public health problem worldwide; over the last few years the incidence and prevalence of renal disease has increased. This increase may be the result of greater progression of chronic renal failure, of greater treatment availability and of the decrease of mortality. It is estimated that in 2010, in the USA, the number of people with kidney disease treated by dialysis or renal transplant will increase from 340,000 to 651,000.13 This increase in the prevalence of renal failure will also cause an increase in complications related to this condition, mainly cardiovascular events. Additionally, currently in the USA the prevalence of early stages of renal failure is greater than the prevalence of advanced renal disease (10.8 vs. 0.1%).14
Due to all the above, it is very important to detect any renal function deterioration and begin treatment to delay the progression of renal damage. Inulin has been, since its introduction, the ideal substance to measure glomerular filtration, since it is a compound that complies with all the requirements for the ideal marker; however, its clinical application is not practical.
Therefore, for a long period of time, serum creatinine has been used despite the fact that its values also depend on muscular mass, age, sex, variable absorption and tubular secretion. Furthermore, its measurement may be altered by chromogens.15 It has also been demonstrated that it is not a reliable method, since a reduction of approximately 50% in GFR is necessary to increase serum levels of creatinine, which makes early detection of renal failure impossible, therefore GFR estimation using serum creatinine is only recommended in isolated cases. GFR may be estimated using equations such as the Cockcroft- Gault formula and the abbreviated equation of the MDRD study, but any formula using levels of serum creatinine will depend on calibration and variability of the method used for its measurement.16
The formula derived from the MDRD study has been assessed in different studies and has shown contradictory results in the different groups studied. Furthermore, it is less precise in healthy patients, diabetic patients without proteinuria and patients with renal failure but with normal levels of serum creatinine.17-19 Other markers have been used, among which 125I-iothalamate stands out. This has been shown to be a reliable marker of renal function, compared with inulin, and it is mainly used for research; however, this marker is not currently available in our institution.20 99mTc with DTPA was first used in 1970, when Hauser21 published its use in the assessment of cerebral and renal function; it subsequently was used in other studies that supported its use. Furthermore, the results of technetium clearance have been compared with iothalamate clearance, and show an adequate correlation.22 It must be mentioned that technetium is exclusively eliminated by the kidney and it binds to plasma proteins in the range of 5-10%, which explains the underestimation of the GFR in comparison with inulin, that filters freely.23,24
We used short periods for urine and blood collection, as also continuous ingestion of water to maintain constant diuresis. Samples (blood and urine) taken during the procedure made it possible to simultaneously determine the concentrations of inulin, creatinine and technetium for their subsequent comparison.
In this study a significant correlation was found between inulin clearance and technetium and creatinine clearance; the concordance analysis made it possible to determine the significant variability of technetium clearance, with a dispersion of data that in the subgroup of healthy patients (donors) was even greater.
Furthermore, the concordance analysis comparing creatinine clearance with inulin clearance showed a significant range of variation, which was also greater in the group of healthy patients.
Meanwhile, the comparison of inulin clearance with the two formulas used showed an adequate correlation with both formulas; great variability was seen in the concordance analysis, since both formulas could either under or overestimate GFR in more than 40ml/min, in comparison with the inulin method; variation was also greater among the healthy subjects assessed.
It is important to highlight that the concordance analysis used in our study, the one proposed by Bland and Altman, has been used ever more frequently in studies that compare two different methods for measuring clinical values, and has been especially used when the gold standard is to be replaced by another equally reliable but easier method.
Furthermore, correlation analysis only indicates the relationship between two variables, but not their concordance, since data that have a good correlation may have poor concordance, as was clearly shown in this study.
Although it is difficult to find different methods with exact concordance, it is necessary to know whether a new method varies in relation to the reference method, and once this is established, its clinical application can be assessed to determine if it can replace the old method. Other studies that have used this analysis and compared different GFR measurement methods with inulin clearance are the following: the study carried out by Pierrat,25 who found that in 116 adults the dispersion of results with the Cockcroft-Gault and Levey formulas was 31ml/min and 24ml/min, respectively; the study carried out by Mariat,26 in 294 renal transplant receptors, who identified concordance intervals with limits of –35 to 27ml/min with the Cockcroft-Gault formula, –29 to 28ml/min with the MDRD equation and –39 to 26ml/min with creatinine clearance in 24 hour urine; and the study carried out by Kuan,27 that assessed the Levey and Cockcroft formulas in 26 patients with advanced renal failure, with an average inulin clearance of 8.8ml/min, identifying variations when using the Cockcroft formula of –5 to 10ml/min and when using the Levey formula of –7 to 5ml/min, values that in this population of patients indicate significant changes in residual renal function. Our results confirm the greater limitations of estimation methods (formulas) in comparison with measurement methods, although none of the four tests assessed in this study showed acceptable concordance with inulin clearance, since the discrepancies included values even greater than 40ml/min. Irrespective of the method analysed, the limits of concordance were not sufficiently narrow to decide that one of the renal function tests studied could be used as a reference method. This has greater importance in the context of clinical studies, when assessing a potential therapeutic strategy to try and slow down progression of renal damage.
The equations can be used to provide approximate values of renal function; however, a method with less variability is necessary. Our results suggest that technetium clearance could be such method.
Due to the limitations mentioned above, we have proposed a panel of GFR markers, to make it easier to detect reduction of renal function at different stages and in different populations; however, this requires further study in the near future.28 Currently, clinicians need to be aware of the limitations of the different renal function tests used and try to avoid overestimating GFR using only one marker or the different equations proposed, especially when it is necessary to make precise clinical decisions.
CONCLUSIONS
The different renal tests assessed (estimated and measured) showed an adequate correlation with the reference method; however, they all revealed a considerable lack of concordance, especially the two equations studied, which was more evident in the healthy population.
Technetium clearance showed less discrepancy, in comparison with inulin clearance, although none of the tests analysed is capable of substituting this test.
Figure 1. Concordance between inulin clearance and Tc clearance. ¿m¿ is the average of the differences between measured GFR and the aforesaid; ¿m +2SD¿ and ¿m ¿2SD¿ are the upper and lower limits of the concordance interval, respectively.
Figure 2. Concordance between inulin clearance and creatinine clearance. ¿m¿ is the average of the differences between measured GFR and the aforesaid; ¿m +2SD¿ and ¿m ¿2SD¿ are the upper and lower limits of the concordance interval, respectively.
Figure 3. Concordance between inulin clearance and the Cockroft formula. "m" is the average of the differences between measured GFR and the aforesaid; "m +2SD" and "m ¿2SD" are the upper and lower limits of the concordance interval, respectively.
Figure 4. Concordance between inulin clearance and the Levey formula. "m" is the average of the differences between measured GFR and the aforesaid; "m +2SD" and "m ¿2SD" are the upper and lower limits of the concordance interval, respectively.
Table 1. Limits of concordance for renal function tests (ml/min/1.73 m2)

