

The haemodialysis dose is a good marker of dialysis adequacy, and we usually monitor it with Kt/V measure. The dialysis dose monitored with Kt allows a better discrimination, detecting a percentage of the patients that perhaps do not get an adequate dose for their gender or body surface area after treatment with a minimum recommended dose of Kt/V. The objective of this study was to evaluate Kt as a clinical indicator referred to dialysis adequacy in the haemodialysis population. The aim was that more than 85% of the patients would achieve the recommended Kt target for their gender (at least 50 litres in men and 45 litres in women), or their body surface area. In each of the patients (mean 129) the Kt mean value was determined for three consecutive dialysis sessions, one every two months, during the follow-up period (14 months). At the beginning, the Kt/V value was on target (> 1.3) in 93.2% of the patients, but only in 58% according to Kt measure for their gender. After 4 months, we observed that 85% of patients’ Kt target increased for their gender, but only 68% did if we used the Kt individualised for their body surface area. From month 6 to the end of the follow-up period, more than 85% of patients obtained an adequate Kt for their body surface area (p < 0.001). A significant increase of Kt mean (5.4 litres) was observed at the end of the study (p < 0.001). The usual dialysis prescription parameters were modified increasing blood flow rate (34.14ml/min, p < 0.001), session effective duration (8.04 minutes, p < 0.001), dialyser surface area (24.1% of patients changed from helixone 1.3 to 1.6m2, p < 0.001) and haemodialysis modality (56.8% of patients changed from conventional haemodialysis to on-line haemodiafiltration, p < 0.001). We conclude that monitoring dialysis dose with Kt is a good clinical measure of adequacy, and using it as a quality indicator can be done in line with the more demanding quality standards.
La dosis de diálisis es un marcador de diálisis adecuada, y el Kt/V es el indicador más frecuentemente utilizado. La medición de la dosis con Kt permite una mejor discriminación en la adecuación e identifica a un porcentaje de pacientes que quizás no alcanzarían una dosis adecuada para su género o superficie corporal, pese a que el Kt/V supere el mínimo establecido. El propósito de este estudio fue evaluar el Kt como indicador de dosis de diálisis en población prevalente en hemodiálisis, con el objetivo de que más del 85% de los pacientes alcancen un Kt óptimo según el género (cuando su valor es superior a 50 l en varones y 45 l en mujeres) o la superficie corporal. En todos los pacientes (129 de media) se determina el valor promedio del Kt de tres sesiones consecutivas, con periodicidad bimensual, durante los 14 meses de duración del estudio. Al inicio, el 93,2% de los pacientes presentaban un Kt/V mayor de 1,3, frente al 58% con Kt óptimo por género. En el cuarto mes, el 85% de los pacientes alcanzaban el Kt objetivo por género, frente a un 68% según la superficie corporal. A partir del sexto mes y hasta el final, más del 85% de los pacientes alcanzaban el Kt prescrito por superficie corporal (p <0,001), con un incremento del Kt (p <0,001) de 5,4 l entre el inicio y el final del estudio. Se incrementó el flujo sanguíneo en 34,14 ml/min (p <0,001), el tiempo efectivo en 8,04 minutos (p <0,001), el 24,1% de pacientes con un dializador de mayor superficie (p <0,001) y el 56,8% de tratados con hemodiafiltración on-line (p <0,001). Concluimos que, pese a que el Kt se muestra más exigente que el Kt/V, su uso como indicador de calidad de dosis de diálisis es compatible con los estándares de calidad más ambiciosos.
INTRODUCTION
Dialysis dose influences survival of haemodialysis patients1,2 and it has been considered the main cause of mortality of US patients, compared to Europe or Japan.3 It was a good marker of adequate dialysis,4 not only as an isolated factor, since it also influences anaemia correction,5 nutritional status6 and the control of blood pressure,7 among other things.
According to a multicentric American study, current dose recommendations were Kt/V > 1.3 and urea reduction rate (URR) > 70%.1 These figures were supported by the main international (K-DOQI8 and European guides9) and national guidelines.10
By using biosensors incorporated into some dialysis monitors, effective ionic dialysance can be measured with current technology. This was the equivalent of urea clearance, which, multiplied by the length of the session, will give us the Kt value.11
Lowrie et al.12 proposed in 1999 Kt as a marker of dialysis dose and mortality indicator, and they recommended a minimum Kt of 40-45l for women and 45-50l for men. In a study with 3,009 patients,13 when they distributed the patients in quintiles according to their urea reduction rate (URR), they observed a J shaped survival curve. When Kt was used the curve was descendent, that is, a larger Kt correlates with greater survival. In a subsequent study,14 the same authors were able to correlate different values of necessary Kt with body area, taking into account anthropometric differences between subjects of the same sex. These findings were validated in a subsequent study.15 One of the advantages of Kt as a marker of dialysis dose was the possibility of determining Kt in real time, in each dialysis session, as it was a specific measure of dialysis dose, and was not influenced by distribution volume, and, therefore, was independent of the malnutrition seen in a high percentage of haemodialysis patients.16
Recently, Maduell et al.17 identified body surface area (BSA) Kt as a more demanding parameter than Kt/V and urea reduction ratio (URR) to establish an adequate dose of dialysis, since 100% of their sample complied with good dialysis criteria in relation to Kt/V and URR, whereas 31% of the study population did not achieve optimum Kt by sex and only 43% when adjusted to body area (BSA). These data agree with our findings18 in relation to Kt by sex.
The quality guidelines of the Spanish Society of Nephrology (SEN)19 recommend that > 80% of the patients achieve Kt/V values > 1.3 as a standard rule for quality. Alcoy20 and his group consider this should be 85%.
The aim of this study was to determine the possibility to comply with the strictest quality standards for appropriate haemodialysis (> 85% of patients) using Kt as a measurement of dialysis dose.
MATERIAL AND METHODS
This was a prospective study carried out in a population undergoing haemodialysis in our health area. The criteria for inclusion were: CKD patients undergoing treatment with haemodialysis in our health area, 18 years of age or over, and signature of an informed consent. Exclusion criteria were: haemodialysis for less than one month and having a temporary catheter.
Kt was measured in all the patients included in the study by ionic dialysance (OCM Fresenius Medical Care Therapeutic System 5008) for three consecutive sessions in the second week of the month, at 0, 2, 4, 6, 8, 10, 12 and 14 months. Type of haemodialysis, time on haemodialysis, dialyser and blood flow were determined in all patients to achieve the target Kt (from 0-14 months according to sex, and from month 4 to the end adjusted to BSA).
All haemodialysis sessions were carried out with a Helixone® dialyser with an area of 1.3 to 1.6m2. As to the primary variables of the study, these were Kt (average of 3 consecutive dialysis sessions) and percentage of patients that achieved optimum Kt per sex (0-14 months) and body surface area (BSA) (4-14 months). Based on Kt results by sex, this was considered optimum when it was > 50 litres in men and > 45 litres in women. BSA Kt was considered optimum when it was > to the values established in the reference tables.14
The secondary variables were demographic ones (age, sex, time and aetiology of terminal renal failure) and those related to dialysis: vascular access (native arteriovenous fistula, prosthetic arteriovenous fistula or permanent tunnelised catheter), type of haemodialysis (conventional and online haemodiafiltration [OLHDF]), dialyser, effective time and effective flow (measured with a 5008 Fresenius Medical Care monitor). Statistical analysis was carried out with a SPSS 13.0 for Windows statistical program. Quantitative variables were expressed as means, standard deviation and range. Qualitative variables were expressed as frequency and percentage. The comparison of hypothesis for quantitative variables was carried out with Student’s t test and variance analysis (ANOVA); and for qualitative variables Pearson’s chi squared test was used. A p < 0.05 was considered statistically significant.
RESULTS
Table 1 shows the characteristics of the subjects in this study, with no significant differences.
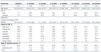
Throughout the study we found appreciable differences both in Kt (p < 0.001) and in percentage of patients that achieved an optimum Kt (p < 0.001) (Table 2). It must be pointed out that at the end of the study, in comparison with the baseline values, there was a significant increase (p < 0.001) both in Kt (5.4 litres) and in percentage of patients with optimum Kt (30.2%). However, the percentage of patients with an adequate dose according to Kt/V was barely modified throughout the study.
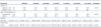
In the fourth month, when we adjusted Kt data for body area, there was a significant reduction (p < 0.001) in the percentage of patients that achieved the desired value (67.9%) when compared with Kt by sex (84.7%). Table 3 shows the evolution of optimized Qb and effective time of haemodialysis, with significant increases (p < 0.001). With reference to baseline values, there was a mean increase of effective time of 8.04 minutes and of real blood flow (p < 0.001) of 34.14ml/min.
Table 3 shows that the percentage of patients in OLHDF increased significantly (p < 0.001) throughout the study: from 22.9% to 79.7% (p < 0.001) at the end of the 14 month period. Similarly, it was possible to see an increase in the percentage of patients with a Helixone dialyser with an area of 1.6m2 throughout the study (p < 0.001). Therefore, at the first cutoff point, this was the dialyser used by 13% of the patients, and at the end of the study the dialyser used by 37.1% of the patients (p < 0.001).
As to results in the subgroup of patients with a tunnelised catheter (p = 0.001) the percentage of patients with an optimum Kt increased significantly (36.4 and 61.1% at baseline and at the end of the study, respectively). During the follow-up period, the percentage of patients in OLHDF increased by 33.3% and the rate of use of dialysers with a larger area increased by 52.4%, without any differences as to effective time and effective blood flow.
DISCUSSION
In this study we analyse the possibility of using Kt as a quality indicator for dialysis, a very demanding17 marker, versus the most ambitious quality standards.20,21 Many studies that have used ionic dialysance also determine Kt/V, and have obtained a good correlation both for haemodialysis22,23 and haemodiafiltration,24 although they usually underestimate analytical Kt/V calculated using the 2nd generation Daugirdas formula. V values were not precise, whether determined using anthropometric formulae or impedance.25
There was a discrepancy between the different ways of calculating dialysis dose. Therefore, using urea reduction rate (URR) and Kt/V, 100% of the patients in the Maduell et al. series17 received an adequate dialysis dose, whereas, based on Kt, more than 1/3 of the sample was underdialysed. Similar data was reported by our group (8% with low Kt/V, 44% according to Kt18) and the baseline results of this study (7 and 42%, respectively). Furthermore, when using Kt/V as a value to determine adequacy, there was a risk of not detecting sub-dialysis, which could negatively affect patient survival, given the relationship found by some authors between deficit in litres of Kt and relative risk of death. Mortality increased by 10% in patients with 4-7 litres, 25% in patients with 7-11 litres and 30% in patients > 11 litres.15
According to the results of our study, the optimum Kt measured based on body area was more demanding than the one based on sex. Thus, in the fourth month the target was achieved in close to 85% as far as sex, with a descent of 17% according to BSA. These data agree with those obtained by Maduell et al.,17 in which the percentage of patients with optimum Kt decrease only 12%. Therefore, from this month to the end of the follow-up period we used Kt according to BSA. However, these differences between the two different ways of classifying Kt can be due to anthropometric differences between individuals of each sex or to differences between the study population and the reference population.14
Both SEN guides for haemodialysis centres19 and the proposal of indicators for the SEN Quality Management Group26 use Kt/V as an indicator of haemodialysis appropriateness, measured using the 2nd generation Daugirdas equation and recommend a value greater than 1.3 in at least 80% of patients. Recently, some studies propose increasing the reference standard to 8520 and 88%.21 However, compliance with this indicator is not simple. Results of the DOPPS study in Spain27 found that 36% of patients were suffering situations of sub-dialysis. In 6 out of 11 determinations in the study performed by Del Pozo et al.20 85% was not achieved, values remained below 80% in 3 of them. In this case, the authors argue that one of the causes of this was incidental patients and suggest that the Kt/V indicator should not be measured in patients until they have been more than 3-4 months in dialysis.
However, recent findings of the multicentric study determining SEN quality indicators for the last quarter of 2007,21 and also data published in the 2007 Annual Report ESRD Clinical Performance Measures Project in the USA,28 with a sample of more than 8,400 patients in the last quarter of 2006, showed improved results with a compliance of 88.1 and 90%, respectively; results that were confirmed in the Spanish study of 2008 with a percentage of patients on target greater than 90%.29
The results of our study indicate that it was possible to comply with this requirement of appropriate haemodialysis and dialysis dose using Kt, with the advantages mentioned above. Therefore, from the 4th month and up to the end of the follow-up period, more than 85% of our patients in haemodialysis presented an optimum Kt according to BSA, independently of the time in haemodialysis. To achieve this, it was necessary to personalize the indications for dialysis for each patient, especially with reference to those factors clearly identified as key elements of the dialysis dose,30 such as blood flow, effective time of dialysis, dialyser and haemodialysis technique. A small increase of Qb (34.14 ml/min), of the time of each session (8.04 minutes), of the area of the dialyser (in 24.1% of patients) and of OLHDF as the prescribed technique (in 56.8% of patients) have been sufficient to achieve and maintain an optimum target Kt. The percentage of optimization from baseline to end of follow-up for Kt was 30.2%, whereas for Kt/V it was 4.1%.
European Guides,9 recommend 4 hour length dialysis sessions, with a frequency of 3 sessions per week; although slightly shorter sessions may be accepted in patients with significant residual renal function and low body weight with no evidence of malnutrition. Although only 3% of the patients at baseline and 2.2% at the end of the study had been prescribed sessions of less than 240 minutes, the effective length of sessions was usually reduced with modern dialysis monitors that interrupt dialysis to carry out pertinent measurements and also have alarms. This should be taken into account when prescribing dialysis.
Haemodialysis with a central venous catheter is somehow less efficient in comparison with the use of an arteriovenous fistula, which means that in many cases it was necessary to increase the duration of the session.31 However, when blood flow was adequate, it was possible to achieve the desired target, even with OLHDF.32 In any case, and in spite of efforts to achieve an optimum dialysis, in our study patients with a tunnelised catheter had worse results than the population as a whole, and achieved an optimum Kt of 36.4% at baseline and 61.1% at the end of the study. In conclusion, in spite of the fact that Kt was considered a marker of dialysis dose as demanding as Kt/V, its measurement as a quality indicator complies with the highest standards that guarantee a good haemodialysis treatment. It was necessary to perform studies to determine optimum Kt according to body area, adapting this to the characteristics of our population.

Table 1. Baseline and demographic characteristics of the sample

Table 2. Results of adaptation of dialysis doses

Table 3. Evolution of effective blood flow, effective time per session, percentage of patients according to dialyser and percentage of patients according to dialysis technique


