Introducción: Un alto porcentaje de pacientes en diálisis presenta niveles séricos disminuidos de triiodotironina libre (T3L), y algunos autores han mostrado su relación con marcadores de inflamación. Niveles bajos de T3L también se han mostrado como predictores independientes de mortalidad en diálisis. Objetivo: Evaluar la incidencia de síndrome T3L baja en un grupo de pacientes en diálisis y analizar su relación con diferentes parámetros de malnutrición e inflamación. Pacientes y métodos: Se estudiaron 32 pacientes estables en diálisis (24 hemodiálisis y 8 diálisis peritoneal), edad (media ± DS) 71,2 ± 11,7 años; 46,9% varones; 15,6% diabéticos; media de tiempo en diálisis 47 ± 43 meses. En cada paciente se cuantificó: tirotropina, T4 Libre y T3L; parámetros bioquímicos relacionados con nutrición e inflamación; parámetros antropométricos, composición corporal mediante bioimpedancia eléctrica con análisis vectorial e ingesta de nutrientes. El análisis estadístico se hizo usando un SPSS 11.0. Resultados: La media de los valores de las hormonas tiroideas fue: TSH 2,2 ± 1,5 U/ml (rango 0,4-5,0), T4L 14,7 ± 2,3 pmol/l (rango: 11,0-23,0) y T3L 4,0 ± 0,71 pmol/l (rango: 3,95-6,80). Sólo dos pacientes (6,3%) mostraron niveles de T4L bajos, y otros dos pacientes aumento de TSH, mientras que 17 pacientes (53,1%) presentaron niveles bajos de T3L. No encontramos ninguna correlación entre los niveles de T3L, T4L y TSH. Los niveles de T3L se correlacionaron con parámetros de inflamación/ nutrición: prealbúmina (r = 0,36; p = 0,04); transferrina (r = 0,40; p = 0,025); proteína C reactiva (r = - 0,38; p = 0,039); y factor de crecimiento similar a la insulina (r = 0,38; p = 0,03); índice de masa corporal (r = 0,51; p = 0,002); circunferencia de brazo (r = 0,65; p = 0,000); perímetro muscular de brazo (r = 0,72; p = 0,000), ángulo de fase (r = 0,57; p = 0,001); porcentaje de masa muscular (r = 0,49; p = 0,005) y porcentaje de masa celular (r = 0,54; p = 0,002). En el análisis de regresión lineal múltiple, el perímetro muscular del brazo fue la única variable que mostró asociación independiente con los niveles de T3L (r = 0,69; p = 0,000). Conclusión: Alrededor del 50% de los pacientes en diálisis tienen niveles séricos disminuidos de T3L sin alteración de TSH o T4L. Estos niveles se correlacionan con parámetros de malnutrición e inflamación. Su determinación periódica podría facilitar al clínico un método accesible y reproducible de detección de estos estados.
Introduction: Low serum free triiodothyronine (FT3) levels have been reported in a high percentage of chronic renal failure (CRF) patients and have been considered as independent predictors of mortality in both haemodialysis (HD) and peritoneal dialysis (PD). A reduction in thyroid function in dialysis patients could be a marker of malnutrition and/or inflammation. Objective: Our aim has been to evaluate the incidence of low T3 syndrome in a group of dialysis patients and analyze its relationship with different parameters of malnutrition and inflammation. Patients and Methods: We included 32 stable dialysis patients (24 HD and 8 DP); mean age ± SD 71.2 ± 11.7 years; 46.9% males; 15.6% diabetics; mean time on dialysis 47 ± 43 months. The following parameters were measured in every patient: thyrothropin (TSH), Free T4 (FT4) and Free T3 (FT3); biochemical data related to nutritional status; anthropometric measurements, bioelectrical impedance vector analysis (BIVA), and dietary survey of three consecutive days. Statistical analysis was performed by using SPSS 11.0. Results: Mean hormonal values of thyroid function were: TSH 2,2 ± 1.5 U/ml (range: 0,4-5.0); FT4 14.7 ± 2.3 pmol/l (range: 11.0-23.0) and FT3 4,0±0.71 pmol/l (range: 3.95-6.80). Only 2 patients (6.3%) showed low FT4 levels and another 2 patients increased TSH levels, whereas 17 patients (53.1%) presented with low FT3 levels. We did not found any correlation between serum FT3, FT4 and TSH levels. We found a correlation between FT3 and inflammation/nutritional parameters: prealbumin (r = 0,36; p = 0,04); transferrin (r = 0,40; p = 0,025); PCR (r = -0.38; p = 0,039); and IGF-I (r = 0,38; p = 0,03); body mass index (BMI) (r = 0,51; p = 0,002); arm circumference (AC) (r = 0,65; p = 0,000), and arm muscle circumference (AMC) (r = 0,72; p = 0,000). FT3 levels were also correlated with BIVA parameters: phase angle (r = 0,54; p = 0,002); muscle mass percentage (r = 0,49; p = 0,005); and cell mass percentage (r = 0,53; p = 0,02), but not with any data of fat mass. AMC was the only variable that independently correlated with FT3 levels in the multivariate regression analysis (r = 0,69; r2: 0,48; p = 0,000). Conclusion: Half of our dialysis patientshave decreased levels of serum FT3 without alteration on FT4 or TSH. Low FT3 levels are correlated bioquimical and anthropometric parameters indicators of malnutrition and inflammation. Periodical measurement of FT3 levels could be used by clinicians as an accessible and reproducible method to detect such states.
INTRODUCTION
Altered thyroid function affecting euthyroid patients with severe conditions has been associated with decreased survival. We refer to low T3 syndrome in order to describe alterations in thyroid function which affect a high percentage of the population (up to 75% of hospitalised patients)1 and involve a decrease in FT3, normal or slightly low free T4 (FT4) and normal thyrotropin (TSH). These changes are interpreted as the body’s adaptive mechanism when faced with disease and occur when there is a decrease in the peripheral conversion of T4 and FT3, without there being any thyroid-specific disease present. A high prevalence of low FT3 levels has also been described in patients with chronic kidney disease (CKD) without a history of thyroid disease,2 and FT3 levels have been identified as independent predictors of mortality both in haemodialysis (HD)3 as well as in peritoneal dialysis (PD)4 patients. It is not known whether the cause of this reduction in FT3 is just the physiological adaptation mechanism that reduces the baseline metabolism when disease is present, or whether it is an alteration associated with CKD or dialysis and its correction could help to improve the survival of these patients. FT3 levels may be low in CKD patients because of various mechanisms, such as: 1) malnutrition: A decrease in food intake could lead to a reduction in the conversion of T4 to FT3 and finally decrease the energy output and stop protein catabolism; 2) inflammation: In CKD, chronic inflammation occurs that may also be associated with the decrease in FT3 during dialysis;4,5 3) kidney failure per se: This is caused by the accumulation of uremic toxins that alter thyroid function, such as metabolic acidosis or a decrease in iodine excretion; or alterations associated with dialysis techniques like the use of heparin during HD or small losses of T4 or T3 in the peritoneal effluent.2 Therefore, reduced thyroid function in dialysis patients could be a marker of malnutrition-inflammation, or be secondary to chronic kidney failure or the particular dialysis technique used.
The main aim of this study was to evaluate the incidence of low T3 syndrome affecting stable patients undergoing dialysis (HD and PD) and its association with the different markers of malnutrition and inflammation.
MATERIAL AND METHOD
This is a descriptive, cross-sectional study, involving chronic dialysis patients (32 in HD and 11 in PD) in the General Hospital of Segovia during the month of April 2008. All patients had been in chronic dialysis for atleast 3 months and were stable from a clinical point of view. «Stable» was defined as no hospital admissions, intercurrent infections or diseases recorded during the month prior to the study. Eleven patients were later excluded from the study: Four due to previously identified thyroid illness and seven who were taking medication that could affect thyroid function.
The TSH, FT4 and FT3 of the cross-section were measured by electrochemiluminescence-based immunoanalysis (ECLIA), using an E170 analyser (Roche Diagnostics, Mannheim, Germany). The sensitivity for the TSH, FT4 and FT3 tests was 0.005mcU/l, 0,3pmol/l and 0.4pmol/l, respectively. The reference values were: TSH 0.4-5mcU/l, FT4 11-23pmol/l and FT3 3.9-6.8pmol/l. We measured antithyroid antibodies (anti-TPO and anti-TG) using an immunoabsorption test (Aeskulisa Aesku Diagnostics, Germany) in order to rule out autoimmune diseases (values above 150U/ml for anti-TPO or 50U/ml for TG were considered positive). At the same time, the biochemical and haematological parameters associated with nutrition and inflammation were tested: albumin, prealbumin, transferrin, cholesterol, hematocrit, creatinine, pH, bicarbonate and C-reactive protein (CRP), using routine laboratory methods in our hospital. Growth hormone (GH) levels and the insulin-like growth factor (IGF-1) were also established using radioimmunoassay in a reference laboratory. The values are expressed in ng/ml. The tests were carried out before the first dialysis session of the week; patients due to undergo dialysis in the afternoon were instructed to fast for at least four hours beforehand.
The average calorie and daily protein intake was established using the three-day dietary survey (software programme Dietsource 3.0 NovartisÆ) and was corrected according to the patient’s ideal weight. The percentage of lipids and carbohydrates was recorded, as well as sodium, potassium and phosphorous intake.
The nutritional status of the patient was evaluated using anthropometric measurements which were carried out midweek after dialysis using standard techniques6 and included: height, weight, body mass index (BMI), triceps skinfold (TSF), arm circumference (AC) and arm muscle circumference (AMC). The results were standardised by calculating the percentage for each case in relation to the 50th percentile of the data obtained from a population of normal Spanish adults of the same age and sex,7,8 considering moderate-severe deficits those cases which were above 80% of the normal population.
In order to obtain a more accurate evaluation of the nutritional status and body composition, a bioimpedance vector analysis (BIVA) was carried out midweek after dialysis (Vectorial BIA 101; Akern, Florencia, Italy), which measured resistance (R), reactance (Xc), phase angle (PA), sodium-potassium exchange (I Na/K), total body water (TBW), extracellular water (ECW), intracellular water (ICW), cell mass, cell mass index (cell mass/height2) (BCMI), fat mass (FM), fat free mass (FFM) and muscle mass. This data was compared to the values of normal subjects of the same age and weight.9
Comorbidity was estimated using the Charlson index, modified by Beddhu.10 The dialysis dose was measured by calculating the KT/V, and protein intake was estimated on the basis of the normalised protein catabolic rate for the current weight (nPCR).
Statistical analysis
The statistical analysis was carried out using the SPSS software package, version 11.0 for Windows. The values were expressed as percentages or averages ± SD; a value of p < 0.05 was considered statistically significant. We used the Chi-squared test to compare percentages and the Student’s T or Mann-Whitney tests to compare averages. We used the Pearson’s chi-square test to establish linear correlation coefficients or the Spearman’s rank correlation test if a variable was ordinal or if its distribution was abnormal. The multivariate analysis was carried out using a multiple stepwise regression analysis which included an analysis of all the variables that were significant in the univariate analysis.
RESULTS
The clinical characteristics of the 32 patients can be found in table 1. The average KT/V in HD was1.6 ± 0.27, and in PD the average weekly KT/V was 2.07 ± 0.27.
The average thyroid hormone values were as follows: TSH 2.2 ± 1.5mcU/ml, FT4 14.7 ± 2.3pmol/l and FT3 4.0 ± 0.71pmol/l. Only two patients (6.3%) presented low FT4 values and another two patients presented increased TSH, whereas 17 patients (53.1%) presented low levels of FT3. We found no correlation between levels of FT3, FT4 and TSH. No patient presented antithyroid antibodies. There were no significant differences between the levels of FT3 according to sex (4.2 ± 0.7 for men vs. 3.8 ± 0.6 for women; ns); the levels of FT3 were significantly higher in PD than in HD (4.5 ± 0.4 vs. 3.8 ± 0.7; p = 0.016). There were no differences in the levels of FT3 according to the type of dialysis. However, PD patients presented higher concentrations of TSH (3.5 ± 1.3 vs. 1.7 ± 1.3mcU/ml; p = 0.002), and BMI was also higher in PD patients (30.6 ± 3.3 vs. 24.8 ± 4.4; p = 0.002) compared with HD patients.
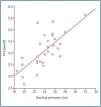
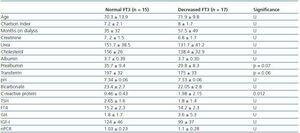
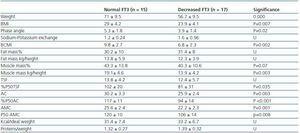
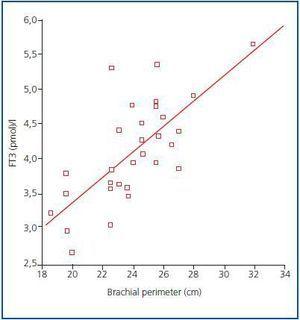
In order to determine what the decrease in FT3 in dialysis was associated with, we compared the clinical, sociodemographic, analytical, anthropometric and BIVA data of patients with low FT3 with the normal values obtained in our laboratory (< 3.95pmol/l). Table 2 shows the analytical and sociodemographic differences between patients with normal and low FT3. There were no differences in the comorbidity rate, age or duration of dialysis. With regard to the biochemical parameters associated with nutrition, patients with lower FT3 had lower levels of prealbumin and transferrin. Although the differences did not reach statistical significance when the averages were compared, apositive linear correlation was confirmed between FT3 and prealbumin (r = 0.36; p = 0.041), transferrin (r = 0.40; p = 0.025) and also with IGF-1 (r = 0.38; p = 0.03). The value of CRP, an inflammation marker, was significantly higher in patients with lowFT3, indicating a negative correlation (r -0.38, p = 0.039). There was no correlation between FT3 and pH or serum bicarbonate. Table 3 shows the anthropometric, bioimpendance and intake data for patients with normal and low FT3. The data associated with patients with low FT3 indicated that their nutritional status was worse (decreased weight, BMI, arm circumference and arm muscle circumference). This data was confirmed by the BIVA, which indicated that patients with low FT3 also presented lower muscle and cell mass, although there were no differences in fat mass. The univariate correlation analysis confirmed the following results: 1) anthropometric data: BMI (r = 0.57; p = 0.001); AC (r = 0.65; p = 0.000); AMC (r = 0.72; p = 0.000); and 2) BIVA data: phase angle (r = 0.55; p = 0.001); muscle mass percentage (r = 0.40; p = 0.02); and cell mass percentage (r = 0.53; p = 0.02), but there was no data regarding body fat. In the multiple stepwise regression analysis all variables which correlated in the univariate analysis were included, as well as age, the Charlson index and the type of dialysis. AMC was the only independent variable and was significantly associated with levels of FT3 (r = 0.69; r2 0.48; p = 0.000). Figure 1 shows the correlation between the levels of FT3 and AC.
DISCUSSION
Recently, low levels of FT32-4 which is not caused by thyroid disease but is the result of deterioration in the peripheral conversion of FT4 to FT3 has been described in a high percentage of dialysis patients. This phenomenon may be comparable to other incidences described in cases of various chronic or acute diseases,1 and is known as euthyroid sick syndrome or low T3 syndrome. However, CKD is different from the rest of the cases of euthyroid sick syndrome because it is not accompanied by an increase in reverse T3 (rT3).11 This is because, despite the fact that rT3 clearance in kidney patients is lower, there seems to be a redistribution of rT3 from the vascular to the extravascular space and an increase in rT3 cellular uptake.
Our data confirms the high incidence of patients with low FT3 levels (53%) undergoing dialysis and without any known thyroid disease, which is probably due to deficient peripheral conversion of T4 and FT3, given that the levels of FT3 did not correlate with FT4 or TSH levels. It has been suggested that the accumulation of uremic toxins or metabolic acidosis may contribute to a decrease in FT3.12 We found no link between pH and bicarbonate levels and FT3 levels. We also found no correlation with the dialysis dose measured using KT/V or with the time patients had spent in dialysis. It is worth considering that, in general, the dialysis doses for our patients were high (average KT/V of HD patients was 1.6 ± 0.27 and average weekly KT/V in PD was 2.07 ± 0.27) and acidosis was corrected relatively well (pH 7.34 ± 0.6 and bicarbonate 22.7 ± 2.8). With regard to the type of dialysis, we found that PD dialysis patients had higher levels of FT3, which slightly contradicts the anticipated results given that in PD greater losses of T4 and T3 in the effluent can be expected.13 However, it has also been demonstrated that these losses are minimal: Less than 10μg of T4 and less than 0.1μg of T3 per day, which is less than 10% and 1% respectively regarding the T4 and T3 production rate. As a result, our findings confirm that the lack of peripheral conversion as a response to malnutrition is much more important that peritoneal loss, and in the case of this study, PD patients recorded better nutritional results, including a higher BMI. We coincide with the findings of other authors and believe that the decrease in FT3 in dialysis patients is mainly the body’s adaptive response to disease with the aim of reducing baseline metabolism and avoiding catabolisms.2 In the case of chronic diseases, sometimes it is difficult to ascertain whether the decrease in FT3 is caused by disease activity or malnutrition associated with the disease activity. Thyroid function is not only altered by fasting, but also by diet composition; therefore, a decrease in carbohydrate intake causes a greater reduction in FT3 than a decrease in protein intake. Insufficient calorie intake, even with adequate protein intake, may cause “euthyroid sick syndrome”.14 We did not find any correlation between levels of FT3 and the total calorie intake (kcal/day) or the corrected calorie intake according to ideal or actual weight. We also found no differences in diet composition between patients with normal and decreased FT3 and for that reason arereluctant to support the hypothesis that a decrease in FT3 in dialysis patients is due to insufficient intake. However, we did find an association between levels of FT3 and some biochemical and anthropometric parameters of malnutrition, such as prealbumin, transferrin, BMI, AC, AMC or muscle mass measured using bioimpedance. Therefore, it seems that FT3 levels are associated with malnutrition but not with a lack of calorie intake. In addition, we found inverse correlation with levels of CRP. During infections or sepsis there is a reduction in thyroid hormones through various mechanisms, however, it fundamentally occurs because of a decrease in peripheral conversion of FT4 to T3. The reduction in thyroid hormones is associated with the severity of the process15 and it seems, at least in part, is mediated by cytokines.16,17 The chronic inflammation that occurs in CKF also seems to be associated with a decrease in FT3 in HD.4,5 In studies by Zocalli et al. a decrease in levels of FT3 was found in both types of dialysis patients when compared with healthy subjects; they also indicate that FT3 levels correlate inversely with levels of interleukin 6 and CRP. The possibility of the decrease in FT3 being the result of disease or age which is associated with a reduction in baseline energy metabolism should also be considered, however in our study we found no correlation between FT3 and age or comorbidity in general, however, there was a correlation with the inflammation parameters.
Recently, the International Society of Renal Nutrition and Metabolism (ISRNM)18 has suggesting replacing the term “malnutrition” with “protein-energy wasting” (PEW) in order to define this situation affecting dialysis patients, given that «malnutrition» in the strictest sense of the word means «insufficient intake» and, the situation that is often observed in these patients is an altered metabolism (excessive metabolism or lack of anabolism), promoted by inflammatory cytokines, which leads to the loss of protein or energy stores. We believe that a decrease in FT3 is the body’s adaptive mechanism to defend itself against protein wasting which is not caused by a lack of intake but rather by inflammation or the lack of anabolizing substances that are associated with CKF. Taking this into consideration, the results of a study carried out by Lim et al.2 are interesting because although doses of FT3 administered to normal subjects did not alter the protein balance, HD patients with low FT3 levels experienced an increased catabolism. This data suggests that patients that experience a decrease in the peripheral conversion of T4 to FT3 are defending themselves against a catabolic situation and that T3 would worsen protein malnutrition by increasing the catabolism.
At present, there is still no reliable marker for muscle mass and protein catabolism in dialysis patients, given that serum creatinine or urea generation may be affected by the dialysis dose. According to the recommendations of the ISRNM,18 the loss of muscle mass should be included in the PEW criteria given that it can be very important both clinically and prognostically. Given the good correlation found in our study between FT3 levels and muscle mass, and taking into consideration that FT3 probably varies quickly in catabolic diseases, we suggest that FT3 levels should be used as an early indicator of catabolism and as a marker to measure the response to certain therapies that aim to treat this, for example, to evaluate the response to nutritional supplements or anabolizing substances.
CONCLUSION
Half of our dialysis patients presented decreased levels of FT3 in serum without altered TSH or FT4 (low FT3 syndrome). This reduction seems to be caused by impaired peripheral conversion of FT4 to FT3. These levels fundamentally correlate with malnutrition and inflammation parameters and could be considered an early marker for catabolism or PEW.
Table 1. Sociodemographic and anthropometric characteristics
Table 2. Sociodemographic and analytical differences between patients with normal FT3 (>3.95) and patients with decreased FT3
Table 3. Anthropometric and BIVA differences between patients with normal FT3 (> 3.95) and patients with decreased FT3
Figure 1.


