


Cardiovascular (CV) morbidity and mortality are markedly increased in non-dialysis patients with chronic kidney disease (CKD). Thus, the precise management of CV risk factors involved in CKD is crucial to improving outcomes. Serum phosphate (Pi) and FGF-23 levels have been linked with a higher risk of CV events in CKD. However, the exact thresholds of Pi and FGF-23, at which the risk of adverse events increases remain unknown.
Materials and methodsWe evaluated the expression of intact FGF-23 (iFGF-23) and Pi in a non-dialysis CKD patient population (n=82; 42M:40F; median age 61 years) and investigated their association with CV and renal outcomes, in a five-year follow-up period.
ResultsAt baseline, the median estimated glomerular filtration rate (eGFR), iFGF-23, and Pi were 45mL/min/1.73m2 (IQ 26.6–73.1), 69.9μg/mL (IQ 33–117) and 3.4mg/dL (IQ 3.3–3.9), respectively. Univariate analysis showed a strong association of both iFGF-23 and Pi with age, Charlson Comorbidity Index, hypertension, and diabetes. In addition, iFGF-23 and Pi were both associated with the composite outcome (major CV and cerebrovascular events – MACCEs, hospitalizations, and all-cause mortality) during follow-up. Moreover, Pi was independently associated with all-cause mortality during follow-up. The segmentation of the population in terciles, according to Pi (<3mg/dL; 3–3.6mg/dL; ≥3.7mg/dL) within reference serum levels, showed a distribution of the fatality of 0%, 20% and 80% (p=0.034), respectively.
ConclusionsOur results reinforce the association of both iFGF-23 and Pi with composite CV outcomes in non-dialysis CKD patients and further suggest that Pi, within current reference levels, may behave as an independent risk factor for mortality in this population. It is suggested that reassessing Pi reference levels for early therapeutic intervention in this population may be justified.
La morbilidad y mortalidad cardiovascular (CV) están marcadamente aumentadas en pacientes con enfermedad renal crónica (ERC) no sometidos a diálisis. Por lo tanto, el manejo preciso de los factores de riesgo CV involucrados en la ERC es crucial para mejorar los resultados. Los niveles de fosfato sérico (Pi) y FGF-23 se han relacionado con un mayor riesgo de eventos CV en la ERC. Sin embargo, los umbrales exactos de Pi y FGF-23, a partir de los cuales aumenta el riesgo de eventos adversos, siguen siendo desconocidos.
Material y métodosEvaluamos la expresión de FGF-23 intacto (iFGF-23) y Pi en una población de pacientes con ERC no sometidos a diálisis (n=82; 42 hombres, 40 mujeres; edad mediana de 61 años) e investigamos su asociación con los resultados CV y renales durante un período de seguimiento de cinco años.
ResultadosAl inicio, la tasa de filtración glomerular estimada (eGFR), el iFGF-23 y el Pi medianos fueron de 45ml/min/1.73m2 (IQR 26.6-73.1), 69.9 μg/ml (IQR 33-117) y 3.4 mg/dL (IQR 3.3-3.9), respectivamente. El análisis univariante mostró una fuerte asociación de tanto iFGF-23 como Pi con la edad, el índice de comorbilidad de Charlson, la hipertensión y la diabetes. Además, tanto el iFGF-23 como el Pi se asociaron con el resultado compuesto (eventos CV y cerebrovasculares mayores - MACCEs, hospitalizaciones y mortalidad por todas las causas) durante el seguimiento. Asimismo, el Pi se asoció de manera independiente con la mortalidad por todas las causas durante el seguimiento. La segmentación de la población en terciles, según los niveles de Pi (<3 mg/dL; 3-3.6 mg/dL; ≥3.7 mg/dL) dentro de los niveles séricos de referencia, mostró una distribución de la mortalidad de 0%, 20% y 80% (p=0.034), respectivamente.
ConclusionesNuestros resultados refuerzan la asociación de tanto iFGF-23 como Pi con resultados CV compuestos en pacientes con ERC no sometidos a diálisis y sugieren además que el Pi, dentro de los niveles de referencia actuales, puede comportarse como un factor de riesgo independiente de mortalidad en esta población. Se sugiere que una reevaluación de los niveles de referencia de Pi para una intervención terapéutica temprana en esta población podría estar justificada.
Chronic kidney disease (CKD) is associated with significantly elevated mortality rates, predominantly driven by cardiovascular (CV) complications, which remain the principal cause of death among these patients.1,2 Therefore, the early identification of reliable biomarkers capable of predicting adverse outcomes is paramount for improving risk stratification and implementing effective therapeutic strategies to halt disease progression and reduce mortality.
Disruptions in mineral metabolism are a hallmark of CKD, often emerging at its earliest stages.3,4 Fibroblast growth factor 23 (FGF-23) has garnered considerable attention among the key players. The FGF-23 levels rise before the onset of overt hyperphosphatemia, acting as an early compensatory mechanism to counter phosphate (Pi) retention. Through its interaction with Klotho-FGF receptor complexes in the kidneys, FGF-23 promotes urinary Pi excretion and suppresses the synthesis of 1,25-dihydroxyvitamin D (1,25(OH)2D).5 Activating Klotho and increasing fractional excretion of phosphate (FEp), serves as a compensatory mechanism to maintain normal serum Pi levels to match dietary intake.6 This response precedes elevations in serum Pi and parathyroid hormone (PTH).7 Experimental and clinical investigations have implicated FGF-23 in left ventricular hypertrophy (LVH), myocardial fibrosis, soft tissue calcifications, and heart failure, independent of traditional CV risk factors.8,9 Persistent hyperphosphatemia, secondary hyperparathyroidism, and vitamin D deficiency have been implicated as risk factors for both all-cause and CV mortality disease.10–12 Nevertheless, the causality of these associations remains a subject of ongoing debate. Although elevated FGF-23 and Pi levels are consistently linked to higher mortality risk in CKD, the precise thresholds at which these factors transition from compensatory to maladaptive remain undefined.13 Recent research suggests that the pathogenic potential of FGF-23 may depend on the co-occurrence of hyperphosphatemia and decreased Klotho expression, a combination frequently observed in advanced CKD.13 Importantly, the early rise in FGF-23 levels—even among normophosphatemic patients—may reflect an underlying inability to effectively regulate Pi homeostasis. This “maladaptive” elevation of FGF-23 could serve as a critical signal, identifying individuals with early-stage CKD who are at higher risk of adverse CV outcomes and who may benefit from intensified Pi management strategies. In addition, prior studies have highlighted that even Pi concentrations within the upper normal reference range are associated with adverse outcomes, suggesting that subtle disturbances in Pi metabolism may be clinically relevant.14
However, associations are not causality. Although hyperphosphatemia and FGF-23 are associated with increased mortality in CKD15,16 it is not clear whether compensatory increases in FGF-23 secretion induce or protect against the increased CV morbidity and mortality observed in CKD. Furthermore, the precise reference values for FGF-23 and Pi, beyond which adverse effects start to be manifested, remain unclear, and the comprehensive impact of each factor involved is not fully understood. In this study, we aimed to examine the relationship of FGF-23 and serum Pi with other biomarkers of kidney disease and CV risk in a non-dialysis CKD population and sought to explore their role as biomarkers of adverse outcomes and mortality during a five-year follow-up period.
MethodsStudy populationEighty-two non-dialysis CKD patients were recruited from the outpatient clinic of the Nephrology Dept. of Unidade Local de Saúde (ULS) São João, EPE, Porto, Portugal. Patients with acute kidney injury, ongoing immunosuppression, recent hospital admission (<2 weeks), recent infections (<1 week), acute heart failure (diagnosed according to appropriate Framingham criteria), and known psychiatric disturbances were excluded from the study. The etiology of CKD was registered, and patients were distributed according to KDIGO CKD categories, using estimated glomerular filtration rate (eGFR) by the CKD-EPI formula.17 Patients with eGFR≥60mL/min/1.73m2 were included if they exhibited persistent albuminuria (urinary albumin-to-creatinine ratio>30mg/g), reflecting evidence of kidney damage despite preserved eGFR.17
Cross-sectional studyAnthropometric measurements, resting systolic and diastolic blood pressure, and a validated Charlson Comorbidity Index (CCI) were assessed in all patients. Blood and urine samples were collected from all participants. Renal function, proteinuria, serum Pi, 25-hydroxyvitamin D [25(OH)D], parathormone (PTH), as well as other relevant biomarkers were evaluated using standard laboratory methods. Intact FGF-23 (iFGF-23) levels were assessed by a two-site second-generation ELISA kit (Immutopics. San Clemente, CA, USA).
Prospective studyAll recruited CKD patients were prospectively followed up for a median of 58 (IQ 30–69) months, to evaluate hard renal and CV outcomes including progression of CKD and end-stage renal disease (ESRD), hospitalizations, major adverse CV and cerebral events (MACCEs), and all-cause mortality. The MACCEs included acute coronary syndrome (ACS), acute heart failure, and stroke.
Cardiovascular death was defined as mortality due to a heart-related cause (death attributable to ACS, heart failure, arrhythmia, or sudden death) or to a cerebrovascular event. Hospitalizations included non-programmed, more than 24-h hospital admissions for medical reasons. Admissions for trauma, surgery, or other scheduled procedures were not considered. A composite CV outcome was established including MACCEs, hospitalizations, and mortality. Renal outcomes included CKD progression, defined as serum creatinine doubling or a >50% decrease in eGFR according to CKD-EPI formula or renal replacement therapy initiation (ESRD) after enrolment.
Ethics approvalThis study was conducted in accordance with the ethical standards of the 1964 Helsinki Declaration and its later amendments. The research protocol was reviewed and approved by the Institutional Review Board, including the local Health Ethics Commission and Data Protection Officer of ULSSJ, Porto, Portugal (CES 251.14). Informed consent was obtained from all individual participants included in the study. Respect for privacy rights was always maintained, and all data were anonymised prior to analysis to ensure confidentiality.
Statistical analysisContinuous variables were described as minimum, percentile 25, median, percentile 75, and maximum deviations, and categorical variables were presented as absolute (n) and relative frequencies (%). Differences in continuous variables were assessed by the Mann–Whitney U test, while Chi-square tests were used to analyze differences in categorical variables. A correlation analysis was performed using Spearman correlation coefficients. Logistic regression models were used to visualize the relationships of both iFGF-23 and Pi, with CKD progression, hospitalizations, MACCEs, and all-cause mortality. All reported p-values were two-sided, and the significance level was set at 5%. All analyses were conducted using SPSS software (Version 26.0 for Windows, SPSS, Chicago, IL, USA).
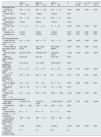
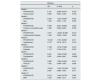
ResultsCohort characterizationAs shown in Table 1, a total of 82 non-dialysis CKD patients (42M:40F) were enrolled in the study: 29 patients were included in stages 1–2, 25 patients in stages 3a–3b, and 28 patients in stages 4–5. The median age was 61 (IQ 46–69) years. The CKD patients in stages 1–2 were younger than patients in CKD stages 4–5 (p<0.001). Proteinuria was observed across all CKD stages, with a trend toward increasing levels as renal function declined (p=0.004). The CCI showed a significant increase across the three groups (p<0.001). Diabetes and hypertension were both more prevalent in patients with CKD stages 4–5 than in patients with CKD stages 1–2 (p=0.009 and p=0.003, respectively). No significant differences were observed among the three groups concerning gender, body mass index and baseline CV disease. In addition, left ventricular mass (LVM) and left ventricular ejection fraction (LVEF) did not differ among the three groups at baseline (Table 1).
Characterization of the non-dialysis patient population by CKD stages (n=82).
| Stage 1–2(n=29) | Stage 3a–3b(n=25) | Stage 4–5(n=28) | p1 | p* 1–2 vs 3a–3b | p* 1–2 vs 4–5 | p* 3a–3b vs 4–5 | |
|---|---|---|---|---|---|---|---|
| Demographic data | |||||||
| Age (years), mean±sd | 49.2±14.3 | 58.0±15.6 | 66.3±13.7 | <0.001 | 0.083 | <0.001 | 0.125 |
| Gender male (n, %) | 11 (37.9) | 17 (68.0) | 14 (50.0) | 0.087 | |||
| Body mass index mean±sd | 29.4±6.8 | 28.9±4.5 | 25.5±4.9 | 0.075 | |||
| Cardiovascular disease, n (%) | 4 (13.8) | 9 (36.0) | 10 (35.7) | 0.104 | |||
| Charlson Index score mean±sd | 1.6±2.1 | 4.4±2.9 | 6.1±2.4 | <0.001 | <0.001 | <0.001 | 0.037 |
| Diabetes, n (%) | 5 (13.8) | 8 (32.0) | 14 (50.0) | 0.0133 | 0.327 | 0.009 | 0.552 |
| Hypertension n (%) | 16 (52.2 | 20 (80.0) | 26 (92.9) | 0.0033 | 0.162 | 0.003 | 0.702 |
| CKD related parameters | |||||||
| eGFR CKD-EPI (mL/min/1.73m2) mean±sd | 97.7±24.1 | 44.5±7.9 | 19.9±7.0 | <0.001 | <0.001 | <0.001 | <0.001 |
| Protein/creatinine ratio (mg/g), median (IQR) | 221.0 (84.0–841.6) | 402.0 (152.0–1035.4) | 981.4 (453.0–2966.0) | 0.0042 | 0.336 | 0.006 | 0.123 |
| iFGF-23, median (IQR) | 28.3 (14.1–54.6) | 67.8 (46.2–91.5) | 145.9 (98.1–219.9) | <0.001 | <0.001 | <0.001 | <0.001 |
| 25(OH)D) (ng/mL), median (IQR) | 22 (14–28) | 22 (7–31) | 24 (14–40) | 0.874 | |||
| Ratio iFGF-23/25(OH)D, Median (IQR) | 4.2 (1.9–6.5) | 4.1 (1.2–6.8) | 7.96 (4.6–8.9) | 0.207 | |||
| Phosphate (mg/dL) mean±sd | 3.0±0.4 | 3.3±0.5 | 3.9±0.6 | <0.001 | 0.118 | <0.001 | <0.001 |
| Fraccional excretion of phosphate (%), mean±sd | 16.9±8.8 | 34.2±15.6 | 40.1±12.9 | 0.010 | 0.010 | 0.001 | 0.325 |
| Calcium (mg/dL) mean±sd | 4.6±0.2 | 4.8±0.3 | 4.5±0.3 | 0.013 | 0.222 | 0.604 | 0.010 |
| Magnesium (mg/dL), mean±sd | 1.62±0.2 | 1.71±0.18 | 1.72±0.23 | 0.319 | |||
| Parathormone (pg/mL) mean±sd | 53.1±24.6 | 75.5±39.3 | 183.6±158.0 | <0.001 | >0.999 | <0.001 | 0.001 |
| Cardiovascular related parameters | |||||||
| BNP (pg/mL) median (IQR) | 30.2 (18.3–70.1) | 74.8 (67.0–105.0) | 74.5 (45.4–327.8) | 0.0302 | 0.189 | 0.036 | >0.999 |
| Left ventricular mass (g) mean±sd | 269.5±163.5 | 175.0±72.6 | 189.5±61.2 | 0.333 | |||
| Ejection fraction (%) mean±sd | 60±9 | 62±8 | 61±8 | 0.921 | |||
| Therapeutics | |||||||
| Cholecalciferol supplementation dosis (UI/day), mean±sd | 1500±503 | 1467±611 | 1500±500 | 0.927 | |||
| Vitamine D analogs, n (%) | 1 (3.4) | 5 (20.0) | 13 (46.4) | <0.001 | 0.235 | <0.001 | 0.240 |
| Vitamine D analogs dosis (mcg/day), median | 0.11 | 0.11 | 0.16 | ns | |||
BNP: B-type natriuretic peptide; CKD: chronic kidney disease; CCI: Charlson comorbidity index; iFGF-23: intact FGF-23.
In this study, parallel with the decrease in eGFR (p<0.001), median iFGF-23 levels (p<0.001), Pi levels (p<0.001), fractional excretion of phosphate (FEp) (p=0.010), PTH (p<0.001) and BNP (p=0.030) progressively increased in the three groups (Table 1). Serum calcium levels were significantly decreased in CKD stages 4–5 in comparison with CKD stages 3 (p=0.010), however, no differences were found regarding 25(OH)D) levels, iFGF-23/25(OH)D ratio and magnesium levels (Table 1).
No specific therapeutic interventions were implemented in this patient cohort; however, a significant difference in prescription rates was observed exclusively for vitamin D analogs. These agents were more frequently prescribed to patients with CKD stages 4–5.
Cross-sectional study: associations of iFGF-23 and Pi with CV-related clinical parameters at baselineAs shown in Table 2, CV risk factors, including hypertension and diabetes, were significantly associated with iFGF-23 (p=0.005 and p<0.001, respectively) and Pi (p=0.027 and p=0.009, respectively) levels at baseline. In addition, iFGF-23 levels were also associated with the presence of CV disease at baseline (p=0.02) (Table 2). Both iFGF-23 and Pi were negatively correlated with eGFR (r=−0.789, p<0.001; r=−0.621, p<0.0019) (Table 3). When we examined the associations of iFGF-23 and Pi, with renal and CV biomarkers we found that iFGF-23 and Pi were both positively correlated with age (r=0.460, p<0.001; r=0.292, p=0.008), CCI (r=0.595, p<0.001; r=0.417, p<0.001) (Table 2); PTH (r=0.595, p<0.001; r=0.506, p<0.001) and BNP (r=0.312, p=0.042; r=0.313, p=0.041) (Table 3).
Associations between iFGF-23 and phosphate levels with patients’ demographic characteristics and comorbidities.
| iFGF-23 | Serum phosphate | |||||
|---|---|---|---|---|---|---|
| Median | p | r | Median | p | r | |
| Gender (M/F) | (59.9/72.5) | 0.492* | (3.40/3.35) | 0.599* | ||
| Age | 0.460 (<0.001)‡ | 0.292 (0.008)‡ | ||||
| Hypertension | 79.63 | 0.005* | 3.40 | 0.027* | ||
| Diabetes | 115.43 | <0.001* | 3.65 | 0.009* | ||
| Dyslipidemia | 78.32 | 0.075* | 3.40 | 0.358* | ||
| Baseline CV disease | 92.00 | 0.02* | 3.50 | 0.137* | ||
| Baseline CbV disease | 121.48 | 0.146* | 3.40 | 0.601* | ||
| CCI | 0.595 (<0.001)‡ | 0.417 (<0.001)‡ | ||||
Correlation between iFGF-23 and serum phosphate levels, with clinical variables in non-dialysis CKD patients (n=82).
| Circulating intact FGF-23 | Serum phosphate | |
|---|---|---|
| CKD related parameters | ||
| eGFR CKD-EPI (mL/min/1.73m2) | −0.789 (<0.001) | −0.621 (<0.001) |
| Protein/creatinine ratio (mg/g) | 0.297 (0.010) | 0.376 (<0.001) |
| Serum phosporus (mg/dL) | 0.558 (<0.001) | – |
| iFGF-23 (mg/mL) | – | 0.558 (<0.001) |
| Parathormone (pg/mL) | 0.595 (<0.001) | 0.506 (<0.001) |
| 25-OH-vitamin D (ng/mL) | 0.142 (0.260) | 0.024 (0.852) |
| iFGF-23/25(OH)D ratio | – | 0.344 (<0.001) |
| Cardiovascular related parameters | ||
| BNP (pg/mL) | 0.312 (0.042) | 0.313 (0.041) |
| Left ventricular hypertrophy | −0.152 (0.674) | 0.128 (0.724) |
| Ejection fraction | 0.073 (0.760) | 0.69 (.772) |
Spearman correlation (significance to p-value<0.05); CKD: chronic kidney disease; eGFR: estimated glomerular filtration rate; i-FGF-23: intact FGF-23; 25(OH)D: 25-hydroxyvitamin D; BNP: B-type natriuretic peptide.
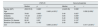
The non-dialysis CKD population was prospectively followed up for a median of 58 months (IQ 30–69). During this period, four patients suffered a MACCE (two patients an acute myocardial infarction and two patients a cerebrovascular event); 19 patients experienced renal function deterioration, of which 10 started dialysis; 19 patients were hospitalised for medical reasons, and five patients died, two of them by MACCE. Twenty-three patients reached the combined cardiovascular outcome (MACCEs, hospitalization, and all-cause mortality) (Table 4).
Cardiovascular and renal outcomes upon follow-up [mean 58months (IQ 30–69)] in the studied population.
| Outcome (n=65) | (n, %) |
|---|---|
| MACCEs | 4 (6.2) |
| Acute myocardial infarction | 1 (1.5) |
| Stroke | 1 (1.5) |
| Composite outcome on CKD progressiona1 | 19 (29.2) |
| Progression to ESRD | 10 (15.4) |
| Hospitalizations | 22 (33.8) |
| All-cause mortality | 5 (8) |
| CV mortality | 2 (3) |
| Composite cardiovascular outcome* | 23 (35.4) |
MACCEs: major adverse cardiovascular and cerebrovascular events; ESRD: End Stage Renal Disease; CV: cardiovascular.
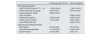
To assess the prognostic value of these mineral metabolism markers, we explored the association of iFGF-23, iFGF-23/25(OH)D ratio, and Pi with renal and CV outcomes, hospitalizations, and all-cause mortality in univariate analysis. Both iFGF-23 and iFGF-23/25(OH)D ratio were significantly associated with the composite CV outcome (52.27 vs. 78.84, p=0.037 and 3.54 vs 8.56, p=0.03), but not with CKD progression (52 vs 80.42, p=0.067; 3.81 vs 6.0, p=0.128), hospitalizations (43 vs 22, p=0.120; 6.0 vs 7.23, p=0.200), all-cause mortality (55.41 vs 97.79, p=0.247; 5.6 vs 5.7, p=0.76) or MACCEs (54 vs. 132, p=0.120; 5.53 vs 8.00, p=0.896) (Table 5). Similar findings were observed in the analysis of patients without vitamin D supplementation (data not shown). On the other hand, serum Pi was significantly associated with both the composite CV outcome (3.25 vs 3.6, p=0.045) and all-cause mortality (3.3 vs 4.0, p=0.020), in univariate analysis (Table 5). When we carried out a stepwise regression analysis, we found that serum Pi, but not iFGF23, proved to be an independent predictor of death, regardless of age, baseline CV disease, hypertension, diabetes, dyslipidemia, iFGF-23 levels, iPTH and BNP (Table 6). In addition, FGF-23 did not predict the composite CV outcome after adjusting for the same variables, including Pi levels. We then divided the population in terciles according to serum Pi levels (<3mg/dL; 3–3.6mg/dL; ≥3.7mg/dL) and observed a distribution of the fatality of 0%, 20%, and 80%, respectively, in the three groups (p=0.034). Detailed analysis showed that among patients who died, serum Pi levels ranged from 3.0 to 4.4mg/dL.
Association between iFGF-23, ratio iFGF-23/25(OH)D, and phosphate with mortality and renal and cardiovascular outcomes during follow-up in the studied population.
| iFGF-23 | Ratio iFGF-23/25(OH)D | Serum phosphate | ||||
|---|---|---|---|---|---|---|
| Median | p | Median | p | Median | p | |
| CKD progression (n=19) | 80.42 | 0.067 | 6.0 | 0.128 | 3.50 | 0.077 |
| All-cause mortality (n=5) | 97.79 | 0.247 | 5.7 | 0.760 | 4.40 | 0.020 |
| Hospitalizations (n=22) | 78.58 | 0.095 | 7.23 | 0.200 | 3.60 | 0.100 |
| MACCEs (n=4) | 132.53 | 0.120 | 8.0 | 0.896 | 3.70 | 0.203 |
| Composite cardiovascular outcomea (n=23) | 78.84 | 0.037 | 8.56 | 0.03 | 3.25 | 0.045 |
Association between mortality and phosphate, adjusted to renal function and other CV risk factors (logistic regression).
| Mortality | |||
|---|---|---|---|
| OR | IC 95% | p | |
| Model 1 | |||
| PHOSPHATE | 6.137 | 0.809–46.573 | 0.079 |
| Renal function | 0.994 | 0.953–1.038 | 0.796 |
| Model 2 | |||
| PHOSPHATE | 6.244 | 1.067–36.543 | 0.042 |
| Age | 1.048 | 0.967–1.136 | 0.253 |
| Model 3 | |||
| PHOSPHATE | 5.948 | 0.981–36.062 | 0.052 |
| Charlson comorbidity index | 1.436 | 0.992–2.080 | 0.055 |
| Model 4 | |||
| PHOSPHATE | 7.577 | 1.0403–40.909 | 0.019 |
| Cardiovascular disease | 1.906 | 0.250–14.545 | 0.534 |
| Model 5 | |||
| PHOSPHATE | 10.943 | 1.727–69.363 | 0.011 |
| Hypertension | 0.170 | 0.016–1.818 | 0.143 |
| Model 6 | |||
| PHOSPHATE | 7.188 | 1.375–37.563 | 0.019 |
| Diabetes | 1.174 | 0.158–8.733 | 0.876 |
| Model 7 | |||
| PHOSPHATE | 8.361 | 1.390–50.295 | 0.020 |
| Dyslipidemia | 0.587 | 0.069–4.981 | 0.0625 |
| Model 8 | |||
| PHOSPHATE | 5.383 | 1.026–33.220 | 0.047 |
| iFGF-23 | 1.002 | 0.998–1.005 | 0.384 |
| Model 9 | |||
| PHOSPHATE | 15.024 | 1.033–218.459 | 0.047 |
| iPTH | 0.997 | 0.989–1.005 | 0.471 |
| Model 10 | |||
| PHOSPHATE | 6.015 | 1.042–34.729 | 0.045 |
| BNP | 1.003 | 0.996–1.010 | 0.397 |
iFGF-23: intact FGF-23; iPTH: parathormone; hemoglobin; BNP: B natriuretic peptide.
In the present study, we examined, in a non-dialysis CKD population under outpatient nephrological care, with renal function spanning all five CKD stages, the associations between the serum levels of iFGF-23 and Pi with CV disease biomarkers and explored prospectively their role as predictors of adverse events and mortality in a 5-year follow-up period. In adjusted models, only serum Pi (independent of other confounders except GFR) remained significantly associated with all-cause mortality. In unadjusted analysis, we found that both iFGF-23 and Pi levels were associated with baseline CV risk factors as well as with a composite CV outcome during follow-up. However, in adjusted analysis, we found that serum Pi levels, but not iFGF-23 were associated with mortality among CKD patients, independent of other confounding factors except GFR. Segmentation of the population into terciles according to serum Pi levels at baseline showed a significant increase in mortality during follow-up among patients with serum Pi levels within the high-“normal” range but not in patients with serum Pi levels below “normal” targets. These findings reinforce the view that high-normal Pi concentrations may carry clinical significance in CKD and are supported by previous studies in both the general population18 and non-dialysis CKD cohorts.19 They also suggest that current reference values for serum Pi in non-dialysis CKD patients may benefit from re-evaluation.20
Several mechanisms may underlie the pathogenicity of elevated serum Pi in CKD, including promotion of vascular calcification via osteoblastic transformation of vascular smooth muscle cells and calcium phosphate deposition,21,22 LVH and myocardial fibrosis23 and statin-resistance due to altered lipid metabolism.24 Indeed, a secondary analysis of the AURORA trial revealed that higher levels of serum Pi may blunt the CV benefit of statin treatment in dialysis patients.24 Endothelial dysfunction has also been implicated in phosphate's pathogenicity. Translational models have shown that Pi loading can impair endothelial function, likely through disruption of nitric oxide signaling.25 Stevens et al. showed that sustained oral Pi loading in 19 healthy volunteers caused endothelial dysfunction, which was accompanied by significant increases in serum FGF-23 and urinary Pi excretion, without significant changes in serum Pi levels.26 Recent data confirm that glycerol-3 phosphate (G3P), secreted by the proximal renal tubular cells, increases in response to Pi loading, with a subsequent increase in FGF-23 before serum Pi concentration rises.27 The deleterious influence of Pi load on endothelial function may be reversible and assume relevance in the CKD population, in which the compromised renal excretion of ingested Pi is counteracted by an increase in FGF-23 levels from the earliest CKD stages. We previously reported in a group of CKD patients with a mean GFR of 49mL/min that the restriction of Pi intake for 14 days from a baseline intake of 1100mg/day to 700mg/day was accompanied by a significant improvement in endothelial function, going along with non-significant reductions in FGF-23, iPTH, and Pi levels.28
As shown in our cohort, the FEp increased significantly with declining renal function, consistent with compensatory responses to early Pi retention. This increase may reflect enhanced FGF-23-mediated phosphaturia in the setting of reduced nephron mass. However, despite this adaptation, serum Pi levels still predicted mortality, and prior studies have demonstrated that heart failure and CV mortality are independent of FEp, in patients with moderate to advanced stages of CKD.29 Therefore, we consider that Pi pathogenicity begins early, even at levels deemed normal, and that its management should be anticipated to prevent CV complications.
In the present study iFGF-23 levels increased with declining renal function and were significantly associated with CV disease and risk factors at baseline, thus reinforcing the role of FGF-23 as an indicator of established CV disease in CKD.30,31 However, iFGF-23 levels were not independently associated with the composite CV outcome or mortality during follow-up. This is in line with findings from previous studies,32–34 and reinforces the view that iFGF-23 may function more as a biomarker of disease burden than as a causal factor.35 Indeed, many controversies exist regarding FGF-23 levels and its role as a predictor versus biomarker of CV disease.32 Elevated FGF-23 levels are not specific to CKD and were also associated with various off-target effects on multiple organs, including fractures,36 infections,37 inflammation,38 hereditary hypophosphatemic rickets39 and even prostate cancer.40 These associations across a wide range of disease states could reflect the pleiotropy of FGF-23 in disease causation. Hereditary disorders of FGF-23 excess share a common biochemical phenotype, including low Pi and normal or low-1,25-(OH)VitD that can be treated with a human monoclonal antibody targeted against FGF-23. Notably, it has been reported that treatment with an anti-FGF-23 monoclonal antibody, although correcting rickets, increased serum Pi to the lower end of the normal range and elevated 1,25(OH)2D levels, was also associated with the development of cardiac calcification.41,42
In this study, a significant proportion of our cohort received vitamin D supplementation, which may influence FGF-23 levels.43 Moreover, other authors have reported that elevated FGF-23 combined with low vitamin D were associated with adverse outcomes.44 Notably, subgroup analysis showed consistent results across treated and untreated groups. As with iFGF-23, the iFGF-23/25(OH)D ratio was also associated with the composite CV outcome only in univariate analysis, however, we acknowledge that FGF-23 more strongly influences 1,25(OH)2D than 25(OH)D levels, and that the generally adequate 25(OH)D levels in our cohort may help explain the absence of significant effects. Toward a deeper understanding of the pathophysiological role of FGF-23 in CKD-associated CV disease, further mechanistic studies may be warranted.
Overall, these findings reinforce the view that early elevation of FGF-23—even in normophosphatemic patients—may represent the impaired ability to maintain Pi balance. This “maladaptive” increase may help identify high-risk individuals who might benefit from intensified therapeutic strategies targeting Pi control.45 Parallel to this, a lower target for Pi levels may warrant additional benefit regarding CV outcomes, particularly in CKD.
We acknowledge some limitations of our study. First, it is a single-center study with a relatively small number of patients and outcomes; second, the results in our ethnically homogeneous population may not be generalizable to other ethnic groups; third, the “snapshot” evaluation of Pi and FGF-23 levels at baseline could underestimate the association with the outcomes during follow-up.
Our study has also strengths that should be emphasized: First, its prospective nature and the significant follow-up period of nearly five years; second, the inclusion of patients from both genders and spanning all five CKD stages; third, the assessment of the intact biologically active isoform of FGF-23 rather than the inactive C-terminal FGF-23 fragment. The data presented here offers valuable preliminary insights that can serve as a foundation for future, larger-scale and more targeted investigations.
In conclusion, our results agree with the view that serum Pi levels within the high-normal range, are a risk predictor for mortality in non-dialysis CKD patients. Our results also suggest that the contribution of iFGF-23 as a biomarker to CV outcomes and mortality in CKD may not outweigh the role of serum Pi levels within the high-“normal” range. Because serum Pi is a biomarker easily affordable, our findings reinforce the need to re-examine contemporary guidelines for serum Pi reference levels in the non-dialysis CKD population. This may allow the establishment of more timely interventions, whether through dietary adjustments or pharmacological measures, aimed at enhancing overall Clinical Outcomes in the CKD Population.
Author contributionsConceptualization, A.C., J.Q.-S. and M.P.; methodology, A.C., J.Q.-S., N.P; software, A.C., J.Q.-S., and C.C.D.; validation, A.C., J.Q.-S. and C.C.D.; formal analysis, A.C., J.Q.-S. and C.C.D.; investigation, A.C., J.Q.-S., N.P.; C.C.D. and M.P.; resources, A.C., J.Q.-S., N.P.; C.C.D. and M.P.; data curation, A.C., J.Q.-S., N.P. and C.C.D.; writing—original draft preparation, A.C., J.Q.-S., and M.P.; writing—review and editing, A.C., J.Q.-S. and M.P.; visualization, A.C., J.Q.-S., N.P.; C.C.D. and M.P.; supervision, M.P. and J.Q.-S.; project administration, J.Q.-S. and M.P.; funding acquisition, M.P., J.Q.-S. and A.C.
All authors have read and agreed to the published version of the manuscript.
Informed consent statementInformed consent was obtained from all subjects involved in the study.
FundingThis work was financed by FEDER-Fundo Europeu de Desenvolvimento Regional funds through the COMPETE 2020-Operacional Programme for Competitiveness and Internationalisation (POCI), Portugal 2020, and by Portuguese funds through FCT-Fundação para a Ciência e a Tecnologia/Ministério da Ciência, Tecnologia e Ensino Superior in the framework of the project “Institute for Research and Innovation in Health Sciences” (POCI-01-0145-FEDER-007274), and a grant from Portuguese Society of Nephrology.
Conflicts of interestAll the authors declare that there is no conflict of interest.
Data availability statementThe data presented in this study are available on request from the corresponding author.
Prof. Doutor Luis Mendonça and Prof. Dra. Inês Alencastre for their insightful comments.