
To analyse the associations between urinary levels of IL-6 EGF, MCP-1 and TGFβ1 and clinical, biochemical and histopathological characteristics in patients with primary IgA nephropathy and their ability to predict the extent of lesions of glomerular and/or interstitial sclerosis.
Patients and methodsA total of 58 patients with IgA nephropathy were studied. We determined the urine levels of IL-6, EGF, MCP-1, and TGFβ1 at the time of diagnosis. The extent of glomerular and interstitial fibrosis was analysed by quantitative morphometry and kidney biopsies were classified according to the Oxford criteria. We analysed the ability of these molecules to predict the extent of glomerular and interstitial fibrosis lesions.
ResultsIL-6, TGFβ1 and MCP-1 were associated with focal glomerulosclerosis and interstitial fibrosis extension but not with the presence of mesangial, extracapillary or endocapillary proliferation. EGF showed a negative association with interstitial fibrosis. By categorising patients according to the Oxford classification, patients with T1 and T2 scores had significantly higher levels of IL-6, MCP-1, TGF-β1 and significantly lower levels of EGF than patients with T0 scores. By multiple regression and logistic regression analyses, the levels of MCP-1, IL-6 and EGF were independent predictors of the fibrosis surface, after adjusting for age and eGFR.
ConclusionThe urinary concentration of IL-6, EGF and MCP-1 provides additional information that significantly improves the estimation of the surface of interstitial fibrosis in patients with IgA nephropathy.
Analizar las asociaciones entre el nivel urinario de IL-6, EGF, MCP-1 y TGFβ1 y las características clínicas, bioquímicas y anatomopatológicas en enfermos con nefropatía IgA primaria y determinar su capacidad para realizar una estimación de la extensión de las lesiones de esclerosis glomerular e intersticial.
Pacientes y métodosSe estudió a 58 enfermos con nefropatía IgA. Se determinaron los niveles urinarios de IL-6, EGF, MCP-1 y TGFβ1 en el momento del diagnóstico. Tras realizar un análisis de la extensión de las lesiones renales mediante morfometría cuantitativa y mediante los criterios de Oxford, se analizó la capacidad de dichas moléculas para estimar la extensión de las lesiones glomerulares e intersticiales de fibrosis.
ResultadosLa IL-6, MCP-1 y TGF-β1 se asociaron a glomeruloesclerosis focal y a la extensión de la fibrosis intersticial, pero no a la presencia de proliferación mesangial, intracapilar o extracapilar. EGF presentó una asociación negativa con la fibrosis intersticial. Al categorizar a los enfermos según la clasificación de Oxford, los enfermos con scores T1 y T2 presentaron niveles significativamente superiores de IL-6, MCP-1 y TGFβ1, y niveles de EGF significativamente inferiores que los enfermos con T0. Tanto mediante regresión múltiple como mediante regresión logística, los niveles de MCP-1, IL-6 y EGF fueron predictores independientes de la superficie de fibrosis, tras ajustar por edad y FGe.
ConclusiónLa determinación de la concentración urinaria de IL-6, EGF y MCP-1 proporciona una información adicional que mejora de forma significativa la estimación de la superficie de fibrosis intersticial.
Mesangial IgA nephropathy is one of the most common primary nephropathies and has a very variable clinical course that ranges from indolent forms to those with rapidly progressive kidney failure.1–4 Approximately 20–25% of patients go on to develop long-term chronic kidney failure. Poor prognosis factors identified to date include the presence of kidney failure, proteinuria that persistently remains above 1g/day, arterial hypertension and mesangial C4d deposits.5 The extent of the glomerular and interstitial lesions has prognostic value in untreated patients, but not in those who have undergone treatment with glucocorticoids or other immunomodulators.6 At present, it is accepted that, after the mesangial deposition of IgA, the kidney lesion results from the activation of the complement through either the alternative pathway, the lectin pathway or both.7 This process results in the generation of various cytokines and growth factors that act as mediators of kidney damage, stimulating cell proliferation and an increase in the production of the mesangial matrix.7,8 There are also data that indicate that the cytokines produced by the mesangial cell may lead to alterations in the structure and function of the podocytes and proximal tubule cells, which are related to the appearance of glomerulosclerosis and interstitial fibrosis lesions.9–11 Of the different molecules that may be involved, interleukin-6 (IL-6),12–15 epidermal growth factor (EGF),16–18 monocyte chemoattractant protein type 1 (MCP-1)19–23 and transforming growth factor β1 (TGFβ1)24 have been the subject to detailed studies. The available data demonstrate a significant correlation between the urinary excretion and the renal expression of IL-615 and EGF,15 as well as a significant correlation between urinary levels of IL-6,15,16 EGF,15,17,18 MCP-122,23 and TGFβ124 and the extent of the interstitial fibrosis lesions and tubular atrophy. These data indicate that the urinary levels of these cytokines and growth factors could provide functional information on the pathogenesis of the kidney lesion or be indirect biomarkers of the extent of the glomerular and interstitial fibrosis.
Three independent studies have demonstrated that the measurement of the urinary excretion of some of these molecules could have prognostic value in IgA nephropathy.15,17,18 In particular, it has been reported that the IL-6:EGF15 ratio might be an indicator of progression towards renal fibrosis and that the MCP-1:EGF ratio could identify patients with a greater risk of progression to chronic kidney failure at the time of diagnosis, irrespective of their kidney function and initial urine protein.17,18 Moreover, the potential prognostic value of urinary EGF excretion has also been highlighted in a recent study that identified it as an independent predictor of progression in three cohorts of patients with glomerular diseases.25 These data indicate that measuring the urinary excretion of one or several of these biomarkers could prove useful in clinical practice. However, to date, no comparative study has been conducted to analyse which of these correlates best with renal fibrosis lesions.
The objective of this study was to analyse the associations between the urinary levels of IL-6, EGF, MCP-1 and TGFβ1 and the clinical, biochemical and anatomopathological characteristics in patients with primary IgA nephropathy, and which of these molecules helps to estimate with more precision the extent of glomerular or interstitial fibrosis lesions.
Patients and methodsA total of 58 patients were studied, all had biopsy proven idiopathic IgA nephropathy. At the time of the kidney biopsy and before initiating any treatment, the clinical and demographic variables were recorded and determinations of serum creatinine and the estimated glomerular filtration rate (eGFR) were performed using the CKD-EPI equation26 urinary sodium excretion and the urine protein:creatinine ratio. The second-void urine sample was also obtained to measure IL-6, EGF, MCP-1 and TGFβ1 levels. In the urine samples, the presence of pyuria was ruled out by means of urine sediment analysis. Urine samples were centrifuged at 1500×g for 10min and stored at −80°C until processing.
When the urine samples were obtained, none of the patients were receiving treatment with angiotensin II receptor antagonists, ACE inhibitors, combinations of both or aldosterone antagonists. None of the patients were treated with steroids or other immunosuppressants, and no patient received paricalcitol. The suitability of the 24h collection was assessed by comparing the total creatinine in the sample with the predicted creatinine: 28−(0.2×age)×kg in men and 23.8−(0.17×age)×kg in women in mg/day.27 Creatinine values were obtained using a compensated IDMS-traceable method (Hitachi Modular P-800 Roche Diagnostics, Berlin, Germany).
Urinary levels of EGF, IL-6, MCP-1 and TGFβ1 were measured using commercial ELISA assays (Quantikine R&D Systems, Minneapolis, USA) in accordance with the manufacturer's instructions. To measure the total TGFβ1 (latent+active), the urine samples were diluted with four volumes of phosphate buffered saline solution and HCl was added until a pH of 2.5–2.0 was obtained. After 30min at room temperature, the pH was readjusted to 7.4 with NaOH.28 All the analyses were performed in duplicate and were calibrated with purified standards and the manufacturers’ reference serums. Intra-analysis precision was calculated by performing ten determinations on the same plate of three samples with known concentrations and were <5% for all molecules, both at a low and high concentration. Inter-analysis precision was determined with ten determinations on different plates of three samples with known concentrations, which were <6.8% for all molecules, both at low and high concentrations. Urinary concentrations were adjusted to the creatinine concentration and were expressed in pg/mg of creatinine (IL-6) or ng/mg of creatinine (EGF, MCP-1 and TGFß1).
The study was performed in accordance with the principles of the Declaration of Helsinki and was approved by the hospital Ethics Committee. All of the patients signed an informed consent form.
Microscopic evaluation of kidney biopsiesThe renal tissue was embedded in paraffin, and 4μm cuts were performed, and subsequently stained with haematoxylin and eosin, Masson's trichrome, Periodic acid-Schiff and Jones’ stain. The immunofluorescence studies were performed on frozen tissue samples, using antibodies against immunoglobulins A, G and M, fibrinogen and C3.
The number of glomeruli with mesangioproliferative lesions and segmental sclerosis were recorded, along with the presence of endo- and extracapillary proliferation and the extent of the interstitial fibrosis by means of quantitative morphometrics using an Olympus WCE2 automated analyser. The kidney biopsies were also classified in accordance with the Oxford international consensus document (2009).29
Statistical analysisTwo means were compared using the Student's t-test for independent data. Proportions were compared using the chi-squared test or the Fisher's Exact test. Pearson's correlation coefficient was used to analyse the correlations between quantitative variables. In order to analyse the relationship between each of the molecules and the extent of the glomerular and interstitial fibrosis lesions, a univariate analysis was performed, followed by a step-by-step multiple regression analysis, taking the fibrosis area as a dependent variable after performing a log transformation and after checking the normality of its distribution. Moreover, the patients were classified into two groups according to the presence (T1+T2) or absence (T0) of interstitial fibrosis lesions in the Oxford classification and, after a univariate analysis for variable selection, a step-by-step logistic regression analysis was performed with a manual input method, based on the –LR change, in order to identify the variables that are independently associated with the presence of interstitial fibrosis. The model was calibrated by risk categories using the Hosmer–Lemeshow test.30 In all cases, a P value <0.05 was considered statistically significant. The SPSS program, version 20.0, was used for the statistical analysis.
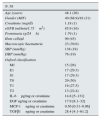
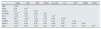
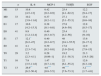
ResultsTable 1 summarises the clinical and anatomopathological characteristics of the patient sample included in the study. Table 2 summarises the correlation matrix among the variables analysed in the study. A statistically significant association was observed between levels of IL-6, MCP-1 and TGFβ1 and the extent of focal glomerulosclerosis. However, this was not seen with the presence of endo- or extracapillary proliferation. Moreover, a positive correlation was observed between the extent of the interstitial fibrosis lesions and urinary levels of IL-6, MCP-1 and TGFβ1. In contrast, a negative association was seen between interstitial fibrosis lesions and the urinary level of EGF. When the patients were categorised according to the Oxford classification (Table 3), no significant differences were observed in any of the molecules analysed, based on the M, E or S criteria. Patients with interstitial fibrosis scores of T1 and T2 presented with significantly higher levels of IL-6, MCP-1 and TGFβ1 and significantly lower levels of EGF than those classified as T0. However, no significant differences were observed between T1 and T2. A significant correlation was observed between urinary levels of IL-6, MCP-1, TGFβ1 and proteinuria. EGF levels were only associated with the interstitial sclerosis score and with the glomerular filtration rate.
Clinical, biochemical and anatomopathological characteristics of the patient sample studied.
| N: 58 | |
|---|---|
| Age (years) | 48.1 (26) |
| Gender (M/F) | 40 (68.9)/18 (31) |
| Creatinine (mg/dl) | 1.18 (1) |
| eGFR (ml/min/1.73m2) | 85.9 (16) |
| Proteinuria (g/24h) | 1.79 (1) |
| Hem cells/μl | 99 (45) |
| Macroscopic haematuria | 23 (39.6) |
| SBP (mmHg) | 138 (18) |
| DBP (mmHg) | 76 (19) |
| Oxford classification | |
| M1 | 15 (26) |
| E1 | 17 (29.3) |
| S1 | 17 (29.3) |
| T0 | 29 (50) |
| T1 | 16 (27.5) |
| T2 | 13 (22.4) |
| IL-6pg/mg or creatinine | 14.8 [5–131] |
| EGF ng/mg or creatinine | 17.9 [8.1–32] |
| MCP-1ng/mg or creatinine | 0.56 [0.31–0.96] |
| TGFβ1ng/mg or creatinine | 28.4 [4.1–61.2] |
EGF: epidermal growth factor; IL-6: interleukin 6; MCP-1: monocyte chemoattractant protein type 1; DBP: diastolic blood pressure; SBP: systolic blood pressure; TGFβ1: transforming growth factor β1.
The qualitative data are expressed as an absolute frequency (percentage). The quantitative data represent the mean±SD or the median and [P25–P75].
Correlation matrix between variables.
| eGFR | FIB | GFS | ENDO | Int. infilt. | IL-6 | EGF | TGFβ1 | MCP-1 | |
|---|---|---|---|---|---|---|---|---|---|
| FIB | −0.46* | ||||||||
| GFS | 0.19 | 0.25** | |||||||
| ENDO | 0.13 | 0.11 | 0.26** | ||||||
| Int. infilt. | −0.21** | 0.46* | 0.28** | 0.07 | |||||
| IL-6 | −0.39* | 0.35* | 0.21** | 0.04 | 0.25* | ||||
| EGF | 0.63* | −0.63* | −0.15 | 0.01 | 0.20 | −0.45** | |||
| TGFβ1 | −0.23* | 0.38* | 0.20** | 0.13 | 0.21** | 0.52* | −0.18 | ||
| MCP-1 | −0.32** | 0.40* | 0.20** | 0.05 | 0.40** | 0.38* | −0.22** | 0.65* | |
| Prot. | −0.57* | 0.28* | 0.26** | 0.03 | 0.24** | 0.29** | −0.11 | 0.44** | 0.45** |
EGF: epidermal growth factor; ENDO: percentage of glomeruli with endocapillary proliferation; EXTRA: percentage of glomeruli with extracapillary proliferation; eGFR: glomerular filtration rate estimated by CKD-EPI; FIB: total interstitial fibrosis area; GFS: percentage of glomeruli with focal segmental sclerosis; IL-6: interleukin 6; Int. infilt.: total interstitial infiltrate area; MCP-1: monocyte chemoattractant protein type 1; Prot.: 24-h proteinuria; TGFβ1: transforming growth factor β1.
Urinary levels of IL-6, MCP-1, TGFβ1 and EGF in the patients, classified according to the Oxford criteria.
| n | IL-6 | MCP-1 | TGFβ1 | EGF | |
|---|---|---|---|---|---|
| M1 | 15 | 10.8 [4.5–12] | 0.42 [0.2–0.9] | 25.4 [4.1–62.2] | 12.2 [9.4–17] |
| M0 | 33 | 10.2 [3.9–11.6] | 0.37 [0.2–1.1] | 27.1 [5.1–55.3] | 13.4 [8.6–16] |
| E1 | 17 | 10.6 [4.2–15.3] | 0.38 [0.1–0.8] | 27.8 [4.6–59] | 12.8 [8.5–17] |
| E0 | 41 | 9.9 [1.2–12.4] | 0.40 [0.3–0.7] | 25.4 [4.2–56] | 13.1 [9–16] |
| S1 | 17 | 12.1* [6.2–47] | 0.40 [0.2–0.7] | 48 [24.1–55.5] | 13.6 [8–17.1] |
| S0 | 41 | 4.1 [2.3–7.4] | 0.39 [0.2–0.8] | 17.8 [3.9–29.4] | 12.9 [7.9–15] |
| T0 | 29 | 3.2 [2.3–4.1] | 0.28 [0.06–1] | 19.2 [3.1–38.3] | 21.3 [14.5–26] |
| T1 | 16 | 7.9 [3.5–11.6] | 1.47 [0.7–1.9] | 22 [6.1–55.2] | 12.6 [6.3–18] |
| T2 | 13 | 26.9** [6.2–50.4] | 4.6*** [0.8–5.5] | 49**** [7.6–73.3] | 3.2***** [1.7–4.8] |
The values represent medians and [P25–P75].
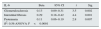
Table 4 summarises the independent predictors of urinary excretion of each of the molecules that were included in the multiple regression analyses, as well as the percentage of variability of the same, explained by the set of independent variables. In all cases, independent and significant associations are observed with the interstitial fibrosis area. In the case of IL-6 and TGFβ1, significant associations are also observed with glomerulosclerosis and, in that of IL-6 and MCP-1, with proteinuria.
Independent predictors of urinary concentrations of IL-6, MCP-1, TGFβ1 and EGF in the multiple regression models.
| IL-6 | Beta | 95% CI | t | Sig. |
|---|---|---|---|---|
| Glomerulosclerosis | 0.13 | 0.09–0.31 | 3.5 | 0.002 |
| Interstitial fibrosis | 0.29 | 0.18–0.42 | 4.4 | 0.001 |
| Proteinuria | 0.11 | 0.06–0.19 | 2.8 | 0.007 |
| R2: 0.56 ANOVA P<0.0001 | ||||
| MCP-1 | Beta | 95% CI | t | Sig. |
|---|---|---|---|---|
| Glomerulosclerosis | 0.41 | 0.22–0.53 | 8.9 | 0.000 |
| Interstitial fibrosis | 0.39 | 0.10–0.75 | 3.9 | 0.002 |
| Interstitial infiltrate | 0.20 | 0.13–0.39 | 2.5 | 0.021 |
| Proteinuria | 0.16 | 0.81–0.22 | 3.7 | 0.035 |
| R2: 0.49 ANOVA P: 0.026 | ||||
| fTGFβ1 | Beta | 95% CI | t | Sig. |
|---|---|---|---|---|
| Glomerulosclerosis | 0.20 | 0.13–0.29 | 3.4 | 0.004 |
| Interstitial fibrosis | 0.18 | 0.05–0.27 | 1.8 | 0.041 |
| R2: 0.47 ANOVA P: 0.035 | ||||
| EGF | Beta | 95% CI | t | Sig. |
|---|---|---|---|---|
| Interstitial fibrosis | 0.25 | 0.16–0.31 | 17.7 | 0.000 |
| R2: 0.39 ANOVA P: 0.008 | ||||
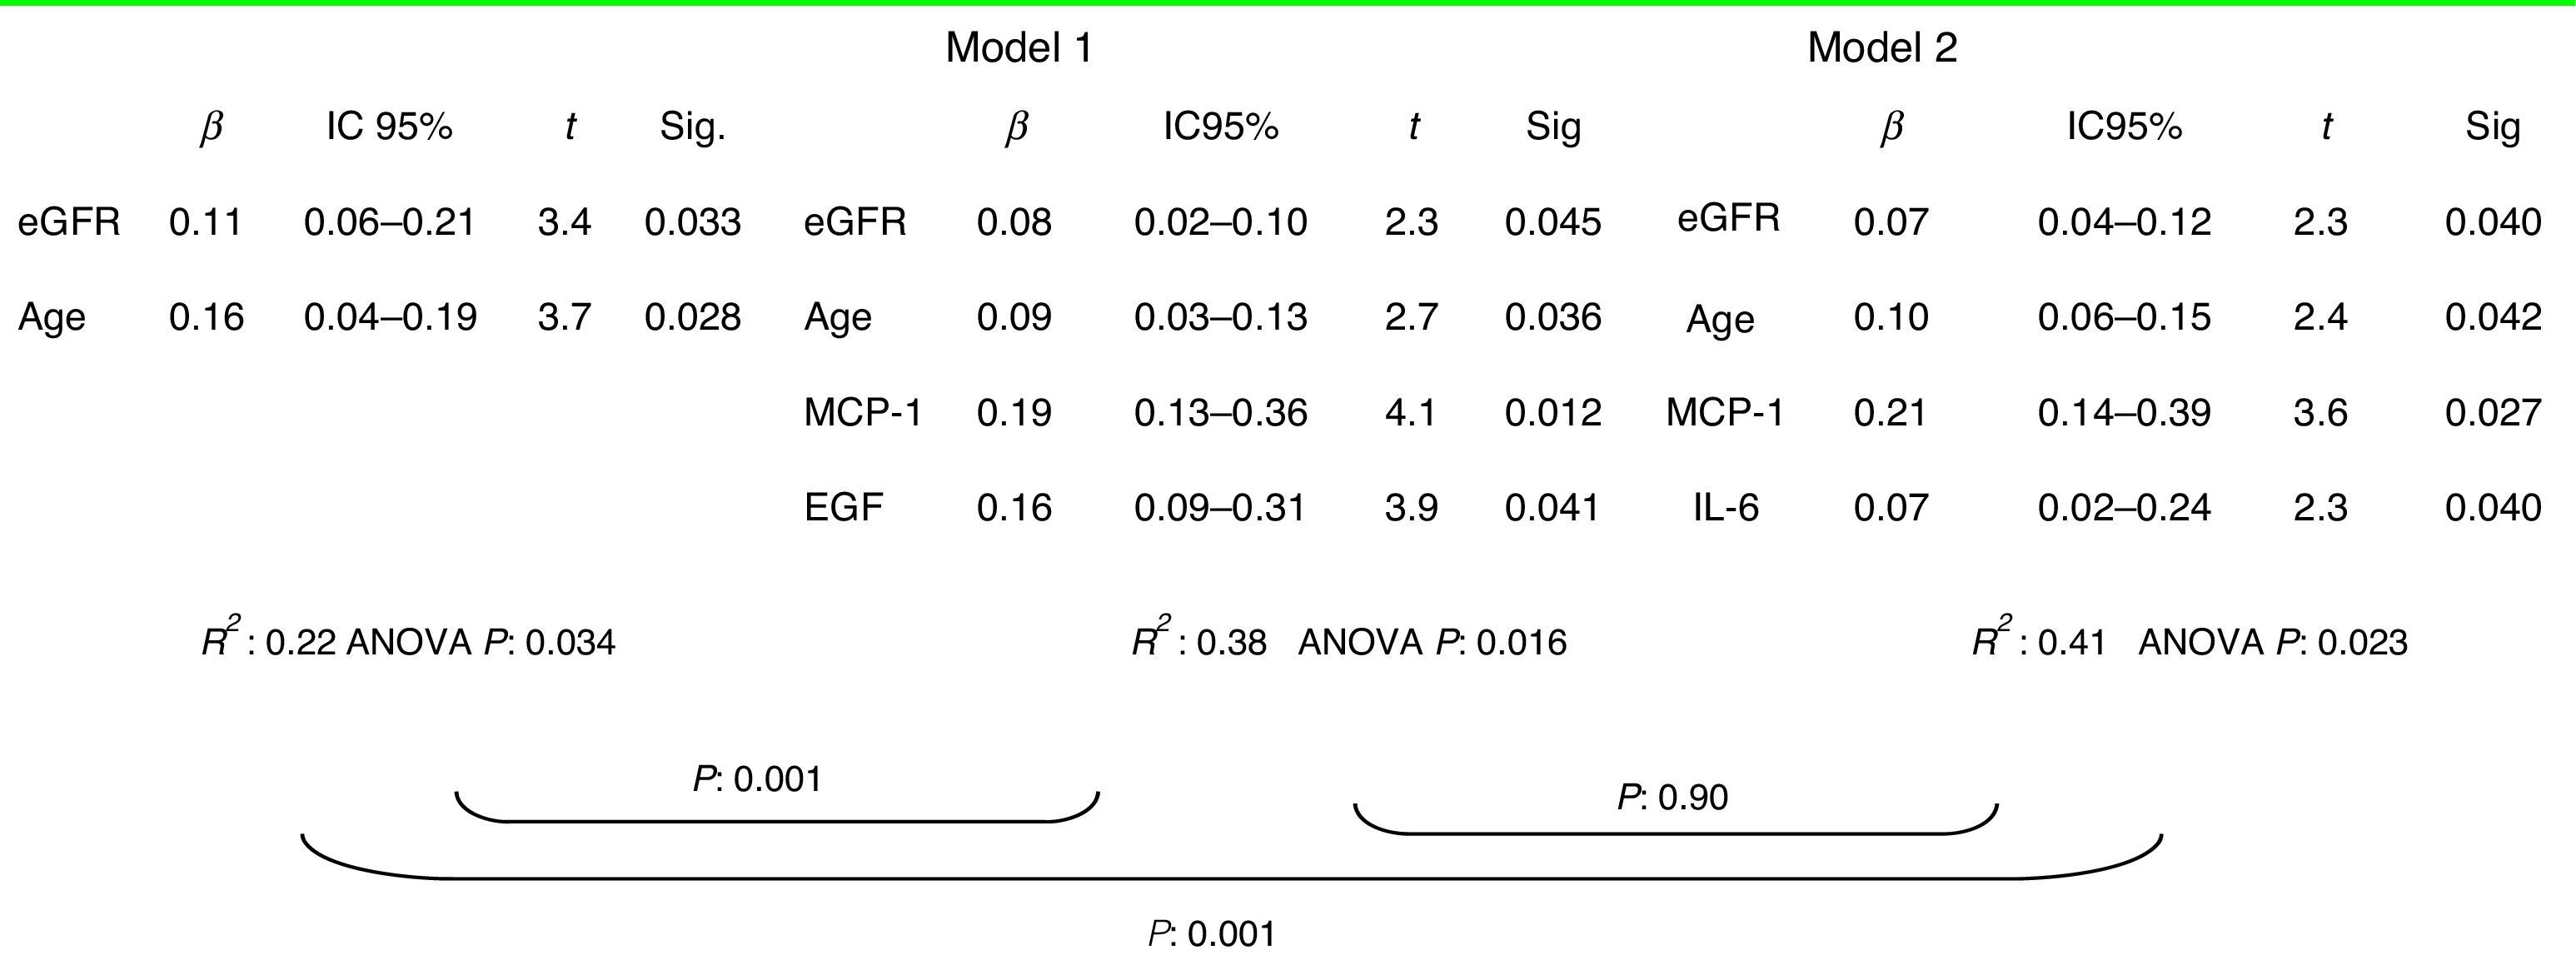
In the multiple regression analyses for prediction the extent of the interstitial fibrosis lesions, the greatest predictive power was seen with the models that included age, the eGFR, MCP-1 and either EGF or IL-6, but not both simultaneously, as co-linearity was detected between the two of them (Table 5).
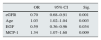
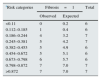
Patients were classified into two categories based on the presence (T1+T2) or absence (T0) of fibrosis in the biopsies according to the Oxford classification. The logistic regression analysis showed the independent predictors of fibrosis to be age, the eGFR, MCP-1 and EGF (Table 6). The model had a good predictive power with an area under the curve of 0.87±0.07 (P: 0.0001) and a good calibration for all the risk categories (Table 7). As well as being associated with glomerulosclerosis and interstitial fibrosis, TGFβ1 levels had a strong significant association with levels of IL-6 and MCP-1. Inclusion of the TGFβ1 level in the models, while maintaining MCP-1 and IL-6, caused co-linearity. However, when the TGFβ1 level was included in both the logistic regression and multiple regression models instead of MCP-1 or IL-6, their predictive capacity was lost significantly.
Logistic regression model for estimating the probability of presenting Oxford grade T1–T2 fibrosis on the kidney biopsy.
| OR | 95% CI | Sig. | |
|---|---|---|---|
| eGFR | 0.70 | 0.68–0.91 | 0.001 |
| Age | 1.03 | 1.02–1.04 | 0.003 |
| EGF | 0.59 | 0.36–0.96 | 0.034 |
| MCP-1 | 1.34 | 1.07–1.68 | 0.009 |
Age (by year) ABC: 0.87±0.07.
P: 0.0001.
EGF: epidermal growth factor (per 1ng/mg creatinine increase); eGFR: glomerular filtration rate estimated using the CKD-EPI equation (per 1ml/min/1.73m2 increase); MCP-1: monocyte chemoattractant protein type 1 (per 1ng/mg creatinine increase).
Calibration of the logistic model by risk category, using the Hosmer–Lemeshow test.
| aRisk categories | Fibrosis=1 | Total | |
|---|---|---|---|
| Observed | Expected | ||
| <0.11 | 0 | 0.2 | 6 |
| 0.112–0.185 | 1 | 0.4 | 6 |
| 0.186–0.244 | 4 | 3.2 | 7 |
| 0.245–0.381 | 5 | 4.2 | 7 |
| 0.382–0.453 | 5 | 4.9 | 6 |
| 0.454–0.672 | 5 | 5.1 | 6 |
| 0.673–0.798 | 6 | 5.7 | 6 |
| 0.798–0.872 | 7 | 7.0 | 7 |
| >0.872 | 7 | 7.0 | 7 |
No significant differences were seen between the number of patients with interstitial fibrosis lesions who were observed and expected by the model in any of the risk categories.
Fibrosis=1: presence of grade T1 or T2 fibrosis.
Chi2: 6.98; P: 0.90.
The results of our study indicate that, in patients with IgA nephropathy, urinary levels of IL-6, EGF, MCP-1 and TGFβ1 are significantly related to the degree of glomerular and interstitial sclerosis observed in the kidney biopsies, but not to endo- or extracapillary proliferative lesions or the degree of mesangial proliferation. The levels of these molecules did not allow us to differentiate between the subgroups in the Oxford classification in regard to the degree of mesangial proliferation, endocapillary proliferation or focal sclerosis, but they were significantly different in patients with stage T1 or T2 fibrosis in relation to T0. In the multivariate models, the best predictor of the interstitial fibrosis area was the glomerular filtration rate, but the models that included eGFR, age, MCP-1 and EGF or IL-6 had a significantly greater predictive capacity, and they therefore provide additional and more accurate information on the interstitial fibrosis area. Moreover, the logistic regression models were able to identify patients that presented T1–T2 fibrosis scores in the biopsies, with a high predictive power and good discrimination for any risk category. Overall, these data indicate that the information provided by measuring the urinary excretion of IL-6, MCP-1 and EGF allows the fibrosis area to be estimated more accurately than the glomerular filtration rate alone and, consequently, they may provide relevant data in clinical practice. Previous studies combining in situ hybridisation and immunohistochemistry techniques have demonstrated that, in IgA nephropathy, the synthesis of IL-6 is increased in mesangial cells, proximal tubule cells and in interstitial infiltrate cells.13–15 Increased IL-6 expression has been correlated to the extent of glomerular and interstitial fibrosis, with or without mesangioproliferative lesions.13–15 The urinary levels of IL-6 observed in our patients, and their correlation with interstitial fibrosis lesions, coincide with previously published data12–15 and, as such, corroborate the idea that the determination thereof may be useful as an indicator of kidney lesion severity. MCP-1 has been identified as one of the molecules that is directly involved in the recruitment of inflammatory cells in the renal interstitium both in experimental models and several glomerular diseases, including IgA nephropathy.20,22 In our patients, MCP-1 is correlated with the glomerular filtration rate and the extent of the interstitial infiltrate and fibrosis, as well as, to a lesser extent, proteinuria, thus coinciding with the data reported in previous studies.19–23 TGFβ1 is considered one of the key modulators of repair after the lesion. However, excessive production has been associated with collagen deposition and scarring.31,32 In various chronic glomerulopathies, it has been demonstrated that the renal expression of TGFβ1 is increased and that urinary levels of TGFβ1 reflect its local production in the kidneys.24,31 The data obtained from our patients coincide with those published previously on IgA nephropathy, on finding a correlation between the urinary levels of TGFβ1 and the severity of glomerular and interstitial sclerosis lesions. In the patients under study, as well as being correlated with glomerular and interstitial fibrosis, the IL-6, MCP-1 and TGFβ1 levels are highly correlated with each other, thus indicating that they probably reflect aspects of a common pathogenic process. The high correlation between the TGFβ1 and MCP-1 levels means that, in predictive models, inputting both variables results in co-linearity and thus no more than one of them can be inserted. The different models analysed have a greater predictive power and better calibration when the MCP-1 level is inserted, in comparison to the TGFβ1 level. EGF is considered a trophic factor for renal tubular cells.33,34 Several studies indicate that the urinary secretion of the same is reduced in the presence of chronic tubular lesions that imply a reduction in the number of tubular cells,17,18 and it has recently been identified as an independent prognostic predictor in patients with various glomerulopathies.25 In our patients, urinary EGF levels were correlated with the glomerular filtration rate and the extent of the interstitial fibrosis lesions and tubular atrophy, thus coinciding with previous evidence and indicating that they might also be an indirect estimator of the extent of interstitial fibrosis lesions and tubular atrophy. Our data also suggest that improvements in the prediction of fibrosis area may also be obtained by determining the excretion of MCP-1 or IL-6. MCP-1 levels contribute significantly as, in the multivariate models, after being adjusted by age and glomerular filtration, they either complement the information provided by the EGF level or appear as an independent predictor in association with IL-6, without taking into account the EGF levels.
The data from our study are limited in the sense that they lack pre-analytical studies to accurately define the type of samples and the most suitable methodology for the processing thereof, having used a single measurement technique and having not been independently validated in other patient cohorts. As such, the predictive models described can only be considered valid for the conditions in which the measurements have been performed and for the group of patients studied. Extending these results to other groups of patients with IgA nephropathy would require previously standardising the technical aspects related to the measurements and independently analysing their reproducibility.
In summary, our data indicate that, in IgA nephropathy, the urinary concentration of IL-6, EGF, MCP-1 and TGFβ1 does not allow for an adequate estimation of the extent of endocapillary or extracapillary mesangioproliferative lesions or the degree of glomerulosclerosis, but does provide additional, non-invasive information that complements that provided by the glomerular filtration rate, after adjusting it by age, and significantly improves the interstitial fibrosis area estimation. Among the biomarkers studied, the EGF and MCP-1 or IL-6 and MCP-1 combinations have a similar predictive value on fibrosis area and seem to be most suitable for performing studies in clinical practice.
FundingThis study was funded with a grant from the Healthcare Research Fund (FIS), file no.: PI14/01831.
Conflicts of interestThe authors declare that they have no conflicts of interest.
Please cite this article as: Segarra-Medrano A, Carnicer-Caceres C, Valtierra-Carmeno N, Agraz-Pamplona I, Ramos-Terrades N, Jatem Escalante E, et al. Valor de los niveles urinarios de interleucina 6, factor de crecimiento epidérmico, proteína quimioatractante de monocitos de tipo 1 y factor de crecimiento transformante β1 para la predicción de la extensión de las lesiones de fibrosis en biopsias de enfermos con nefropatía IgA. Nefrologia. 2017;37:531–538.


