
Anaemia is common in haemodialysis patients and treating it with erythropoiesis-stimulating agents (ESAs) is complex due to many factors.
ObjectivesTo assess the usefulness of the anaemia control model (ACM) in the treatment of anaemia in haemodialysis.
MethodsACM is a software that predicts the optimal dose of darbepoetin and iron sucrose to achieve target haemoglobin (Hb) and ferritin levels, and makes prescription suggestions. Study conducted in dialysis clinics lasting 18months with two intervention phases (IPs) with ACM (IP1, n: 213; IP2, n: 218) separated by a control phase (CP, n: 219). The primary outcome was the percentage of Hb in range and the median dose of ESAs, and the secondary outcomes were transfusion, hospitalisation and cardiovascular events. Clinical and patient analyses were performed. Hb variability was assessed by the standard deviation (SD) of the Hb. We also analysed the patients with most of the suggestions confirmed (ACM compliant group).
ResultsACM increased the percentage of Hb in range: 80.9% in IP2, compared with 72.7% in the CP and reduced the intake of darbepoetin (IP1: 20 [70]; CP 30 [80]μg, p=0.032) with less Hb fluctuation (0.91±0.49 in the CP to 0.82±0.37g/dl in IP2, p<0.05), improving in the ACM compliant group. The secondary outcomes decreased with the use of ACM.
ConclusionsACM helps to obtain better anaemia results in haemodialysis patients, minimising the risks of treatment with ESAs and reducing costs.
La anemia es frecuente en los pacientes en hemodiálisis, y su tratamiento con estimulantes de la eritropoyesis (AEE) resulta complejo debido a múltiples factores.
ObjetivosValorar la utilidad del modelo de control de anemia (MCA) en el tratamiento de la anemia en hemodiálisis.
MétodosEl MCA es un software que predice la dosis óptima de darbepoetina y hierro sacarosa para alcanzar niveles de hemoglobina (Hb) y ferritina deseados, emitiendo sugerencias de prescripción. Estudio realizado en clínicas de diálisis de 18 meses de duración en dos fases de intervención (FI) con MCA (FI1, n: 213; FI2, n: 218) separadas por una fase de control (FC, n: 219). El resultado primario fue el porcentaje de Hb en rango y la mediana de dosis de AEE y los resultados secundarios fueron las transfusiones, las hospitalizaciones o los acontecimientos cardiovasculares. Análisis a nivel de clínica y de pacientes valorando la variabilidad de la Hb mediante la desviación estándar (DE) de esta. También se analizaron pacientes con la mayoría de sugerencias confirmadas (grupo MCA cumplidores)
ResultadosEl MCA aumentó el porcentaje de Hb en rango: 80,9% FI2 frente a 72,7% en FC, y redujo el consumo de darbepoetina (FI1: 20 [70]; FC 30 [80] μg, p=0,032) con menor fluctuación de la Hb (0,91±0,49 en FC a 0,82±0,37g/dl en FI2; p<0,05) mejorando en el grupo MCA cumplidores. En cuanto a los resultados secundarios, descendieron con el uso del MCA.
ConclusionesEl MCA ayuda a obtener mejores resultados de anemia en los pacientes en hemodiálisis, minimizando los riesgos del tratamiento con AEE y reduciendo costes.
The presence of anaemia is one of the most frequent complications of chronic kidney disease (CKD), and the main cause is erythropoietin deficiency.1,2
The use of erythropoiesis stimulating agents (ESAs) to correct anaemia it is a widespread practice that since its initiation has allowed, to improve patients quality of life of has reduced the need of blood transfusions.3–5
However, to date, the management of renal anaemia by the nephrologist is a challenge, due to the complexity of the clinical circumstances and the heterogeneity of the renal population.
Based on recent scientific evidence in relation with cardiovascular safety in patients on ESAs,6–10 the current guidelines recommend the use of the minimum dose of ESAs required to avoid blood transfusions and maintain haemoglobin (Hb) levels between the narrow therapeutic range of 10–12g/dl, a condition that further complicates the therapeutic strategy.2,11,12
It is known that, in spite of the continuous effort to maintain the Hg levels stable and within the recommended ranges, most patients treated with ESA experience some degree of fluctuation in Hb levels throughout time.13–16
This variability does not seem to be negligible. Ebben et al.15 shows that during a 6-month follow-up, only 10% of the patients maintained Hb levels between a specific range and the remaining 90% experienced some degree of fluctuation between the different established ranges. Cyclic fluctuations of Hb were also described in 90% of the patients analysed by Fishbane and Berns.17 Although controversial, the variability of Hb has been associated to worse clinical outcomes, mainly in haemodialysis patients.15,18–20 Currently there are doubts about the definition of variability of Hg levels, their quantification,18,19,21–23 the causes involved and the clinical significance.24–30
Additional important problems in this scenario are dose regimens and resistance to ESAs. Using the minimal required dose of ESAs is opportune to prevent possible unfavourable effects derived from high doses such as hypertension, iron deficiency or thrombotic events, and although controversial but not less important, tumour progression and diabetic retinopathy.16,31 The use minimal required dose of ESAs is not always possible due to the presence of resistance to ESA which occurs in approximately 10–20% of patients with advanced CKD and it is associated with different recurrent pathologies as well as a chronic inflammatory state.32–34 Today there is limited scientific evidence and absence of clinical protocols to establish the optimal strategy to treat anaemia and iron deficiency. Some authors suggest more frequent Hb monitoring in order to reduce the variability and consumption of ESAs, taking into consideration the blood loss and the costs associated with this practice. Current scientific evidence is not sufficient to formulate clinical recommendations.35,36
According to recent studies, the use of computerized models of anaemia based on predictive algorithms could improve the treatment of anaemia in haemodialysis patients.37–39
We have participated in a recent retrospective multinational study published in Kidney International, in which an artificial intelligence model is used to guide the treatment of anaemia in haemodialysis patients.40 In this study, the anaemia control model (ACM) increases the percentage of patients with Hb in range, significantly reduce the variability of Hb and reduce treatment costs. These results are excellent but there is a certain degree of discrepancy between the ACM recommendations and the nephrologist's clinical assessment; thus, we decided to conduct a prospective study to evaluate the impact of the application of ACM in our population of haemodialysis patients.
Patients and methodsAnaemia control modelThe ACM is a software conceived as a tool to help the clinician in making decisions on the prescription of ESA and iron for the treatment of anaemia in haemodialysis patients. It is a model of artificial neural network that uses updated individual data to predicts Hb values based on a prescribing algorithm of darbepoetin and iron. ACM integrates data through an automatic interface module integrated into the clinical data system of FMC, EuCliD®. The integrated data includes anthropometric as sex and height that extracts from the moment of admission, the latest analytical data including Hb, ferritin, saturation index of transferrin (IST), calcium, phosphorus, sodium, potassium, leukocytes, C-reactive protein (CRP), mean corpuscular volume (MCV), mean corpuscular haemoglobin (MCH) and albumin, data from the last dialysis session as dry weight, predialysis weight and Kt/V measured by online clearance monitoring (OCM) and doses of darbepoetin and iron used in the last 90 days, as well as the Hb change with respect to the previous month.
Each time that a Hb value is introduced in the ACM, the program generates a prescribing suggestion of darbepoetin and iron sucrose (Venofer®) in the case of being accompanied of iron kinetic data. This suggestion is a recommendation that always requires the validation of the clinician. If the suggestion is rejected, the clinician must formulate a different prescription and indicate the cause of the non-confirmation (Appendix A). ACM considers temporarily non-eligible to apply the model the patients in the following situations: under 18 years, admission in less than 90 days, transfusion in the last 90 days or insufficient number of dialysis sessions (at least 27 of the 39 expected), either by hospitalisation or vacation.
Study design and statistical analysisACM was launched at the dialysis clinics of FMC Services Murcia in Cartagena and San Pedro del Pinatar in June 2014. The use of ACM was subsequently discontinued during 6 months (November 2014 to April 2015) so it was resumed in May 2015. This interruption period is considered the control phase; therefore, the study was carried out during a total of 18 months (May 2014 to October 2015). The first period (May 2014 to October 2014) is considered intervention phase 1, during which nephrologists use ACM support for the treatment of anaemia. The second period (November 2014 to April 2015) is considered the control phase, in which the treatment of anaemia is carried out in a traditional manner without the ACM support, using the trial-error method to obtain values of Hb between 10 and 12g/dl, according to the protocol of the clinics based on the European Best Practice Guidelines for Anaemia in patients with chronic renal failure.41
During the third period (May 2015 to October 2015), or intervention phase 2, nephrologists again use ACM support for the management of anaemia.
During the study, in both clinics the plan pre-established for analytical monitoring was maintained, Hb levels were measured monthly and iron kinetics (ferritin and IST) were obtained bi-monthly. Controls of the water quality were performed according to the FMC protocol; the results were similar in the different phases of the study complying with the guidelines of the of the Spanish Society of Nephrology.42 Likewise, both in the Cartagena Clinic and in San Pedro del Pinatar, ultrapure water is available to perform hemodiafiltration (HDF) treatments online.
The effects of the use of ACM were evaluated both in the haemodialysis unit and in each individual patient.
All patients included were older than 18 years with at least one haemodialysis session and one Hb determination during the control or intervention phase. Thus, there were 213 patients in the intervention phase 1, 219 in the control period and 218 in the intervention phase 2. The primary outcome was the percentage of Hb values in range and the median dose of EEA administered (expressed as dose/patient/kg/month or dose/patient/month). The Hb level was considered in range if values were between 10 and 12g/dl, or >12g/dl in the absence of treatment with EEA (i.e., without EEA from at least 35 days before the Hb measurement).
The results were calculated for the entire population as a measure of the global impact of ACM. In addition, we performed a subanalysis focused only on the confirmed ACM suggestions, in this case the Hb measurements and the doses of drugs recommended by ACM were separated.
The secondary outcome included the need for transfusion and hospitalisation, the occurrence of cardiovascular events or death. Cardiovascular events were defined as the presence of any of the following: death or appearance of cardiac or cerebrovascular pathology or admissions due to this cause. These events were obtained from the clinical history identified by an ICD-10 code contained in the I00–I99 interval, except codes I80–I89 relating to diseases of the veins, vessels and lymph nodes.
The analysis of the individual patient required at least 5 measurements of Hb in the same dialysis centre during a given period. It was necessary to have a significant number of Hb measurements in each patient to evaluate the fluctuation of them over time. The number of patients fulfilling this requirement were 173 patients in the intervention phase-1, 184 patients in the control phase and 188 patients in the intervention phase-2. The individual variability of Hb was estimated by the standard deviation (SD) of Hb in the three phases.
To assess the ACM contribution, we considered the percentage of Hb values in range and the consumption of EEE discriminating between the ACM suggestions that were confirmed, rejected or null.
The same parameters were also evaluated in the subpopulation of patients with the majority of suggestions accepted (2/3 or approximately 66% of suggestions accepted. The number of patients in the ACM compliant group were 111 the intervention phase-1 and 154 in the intervention phase-2.
Finally, the primary results were analyzed separately in groups of patients according to vascular access (native arteriovenous fistula, prosthetic vascular access or catheter).
The statistical analysis was performed in Matlab®. T-test was used to compare variables with normal distribution and the Wilcoxon test for variables with non-normal distribution. Fisher's test was used to compare proportions. The data are expressed as mean±standard deviation (SD) or median and interquartile range (ICR) depending on the variable. For all tests, a p<0.05 value was considered statistically significant.
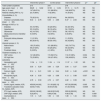
ResultsResults in the dialysis centreBaseline characteristics of haemodialysis patients participating in the study are shown in Table 1.
Clinical characteristics of the patients included in the different phases of the study.
| Intervention phase-1 | Control phase | Intervention phase-2 | p1a | p2b | |
|---|---|---|---|---|---|
| Total number of patients | 213 | 219 | 218 | ||
| Age (years; mean±SD) | 66.29±14.82 | 67.05±14.54 | 67.15±14.70 | NS | NS |
| Sex (n, % men) | 147 (69.01%) | 151 (68.95%) | 146 (66.97%) | NS | NS |
| Patients initiating RRT (n, %) | 23 (10.80%) | 14 (6.39%) | 14 (6.42%) | NS | NS |
| Comorbidities (n, %) | |||||
| Diabetes | 75 (35.21%) | 82 (37.44%) | 84 (38.53%) | NS | NS |
| Charlson comorbidity index (mean±SD) | 6.43±2.76 | 6.45±2.66 | 6.47±2.64 | NS | NS |
| Etiology of CKD (n, %) | |||||
| Diabetes | 40 (18.78%) | 45 (20.55%) | 44 (20.18%) | NS | NS |
| Hypertension | 35 (16.43%) | 36 (16.44%) | 34 (15.60%) | NS | NS |
| Glomerular | 42 (19.72%) | 38 (17.35%) | 36 (16.51%) | NS | NS |
| Obstructive/chronic interstitial nephritis | 0 (0.00%) | 0 (0.00%) | 0 (0.00%) | NS | NS |
| Polycystic kidney disease | 11 (5.16%) | 12 (5.48%) | 11 (5.05%) | NS | NS |
| Other | 85 (39.91%) | 88 (40.18%) | 93 (42.66%) | NS | NS |
| Vascular access (n, %) | |||||
| Native fistula | 150 (70.42%) | 151 (68.95%) | 163 (74.77%) | NS | NS |
| Catheter | 58 (27.23%) | 64 (29.22%) | 49 (22.48%) | NS | NS |
| Prosthetic fistula | 5 (2.35%) | 4 (1.83%) | 6 (2.75%) | NS | NS |
| Treatment modality (n, %) | |||||
| HDF online | 141 (66.20%) | 115 (52.51%) | 112 (51.38%) | 0.004 | NS |
| HD high flow | 72 (33.80%) | 104 (47.49%) | 106 (48.62%) | 0.004 | NS |
| Laboratory | |||||
| Hemoglobin (g/dl; mean±SD) | 11.34±1.10 | 11.34±1.14 | 11.37±1.22 | NS | NS |
| Albumin (g/dl; mean±SD) | 3.93±0.29 | 3.84±0.29 | 3.84±0.27 | 0.001 | NS |
| Calcium (mg/dl; mean±SD) | 9.14±0.41 | 9.30±0.44 | 9.22±0.46 | <0.001 | NS |
| Phosphate (mg/dl; mean±SD) | 4.06±0.93 | 4.26±0.98 | 4.13±0.88 | 0.037 | NS |
| Potassium (mmol/l; mean±SD) | 4.78±0.59 | 4.72±0.57 | 4.82±0.59 | NS | NS |
| Ferritin (ng/ml; median, ICR) | 459.00 [416.00] | 511.00 [422.13] | 457.50 [350.88] | 0.005 | NS |
| Transferrin saturation index (%, median, ICR) | 32.50 [17.00] | 30.00 [15.00] | 31.00 [16.50] | 0.0006 | NS |
| PTH (ng/l; median, ICR) | 222.00 [190.00] | 242.00 [213.63] | 225.00 [220.50] | NS | NS |
| CRP (mg/l; median, ICR) | 5.23 [9.41] | 6.68 [10.39] | 4.66 [7.58] | NS | 0.009 |
| Overhydration (l; mean±SD) | 1.74±1.29 | 1.50±1.33 | 1.88±1.34 | NS | 0.004 |
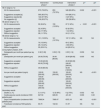
The primary outcome (percentage of Hb in range and consumption of EEA) and the secondary results (deaths, hospitalisations, cardiovascular events and transfusions) are presented in Table 2. During the control phase, the average monthly consumption of darbepoetin increased a 33% in the entire population (from 20μg/month [70] in the intervention phase-1 to 30μg/month [80], p=0.032) and was reduced again in the intervention phase-2 but without reaching statistical significance (20μg/month [80] p=NS). At the same time the percentage of Hb values in range fell by 5.5% (from 78.2 to 72.7%, p=0.002) and then increased by 8.2% (from 72.7 to 80.9%, p<0.001) with the reintroduction of ACM.
Primary and secondary outcomes at the dialysis center.
| Intervention phase 1 | Control phase | Intervention phase 2 | p1a | p2b | |
|---|---|---|---|---|---|
| Hb in range (n, %) | |||||
| All Hb measurements | 873 (78.23%) | 853 (72.72%) | 948 (80.89%) | 0.002 | <0.001 |
| Suggestions accepted [a] | 595 (85.37%) | 819 (86.21%) | |||
| Suggestions rejected [b] | 122 (67.78%) | 3 (37.50%) | |||
| No suggestion [c] | 156 (65.27%) | 126 (58.88%) | |||
| Hb above range (n, %) | |||||
| All Hb measurements | 92 (8.24%) | 159 (13.55%) | 87 (7.42%) | <0.001 | <0.001 |
| Suggestions accepted | 32 (4.59%) | 62 (6.53%) | |||
| Suggestions rejected | 32 (17.78%) | 1 (12.50%) | |||
| Without suggestion | 28 (11.72%) | 24 (11.21%) | |||
| Hb below range (n, %) | |||||
| All Hb measurements | 151 (13.53%) | 161 (13.73%) | 137 (11.69%) | NS | NS |
| Suggestions accepted | 70 (10.04%) | 69 (7.26%) | |||
| Suggestions rejected | 26 (14.44%) | 4 (50.00%) | |||
| Without suggestion | 55 (23.01%) | 64 (29.91%) | |||
| Consumption (median, ICR) | |||||
| Darbepoetin per month per patient per kg (g/kg/m) | 0.32 [1.06] | 0.39 [1.15] | 0.35 [1.14] | 0.039 | NS |
| Darbepoetin per month per patient (g/m) | 20.00 [70.00] | 30.00 [80.00] | 20.00 [80.00] | 0.035 | NS |
| Suggestions accepted | 10.00 [40.00] | 20.00 [60.00] | |||
| Suggestions rejected | 60.00 [70.00]] | 240.00 [365.00] | |||
| Without suggestion | 30.00 [90.00] | 60.00 [120.00] | |||
| Iron per month per patient (mg/m) | 100.00 [200.00] | 150.00 [300.00] | 100.00 [200.00] | NS | <0.001 |
| Suggestions accepted | 100.00 [200.00] | 100.00 [200.00] | |||
| Suggestions rejected | 125.00 [200.00] | 100.00 [200.00] | |||
| Without suggestion | 100.00 [300.00] | 100.00 [400.00] | |||
| Secondary results | |||||
| Deaths (n, %) | 3 (1.41%) | 12 (5.48%) | 6 (2.75%) | 0.032 | NS |
| Cardiovascular events (incidence/1000 patients-year) | 847.50 | 626.09 | 441.23 | 0.009 | 0.02 |
| Days of hospitalization (incidence/1000 patients-year) | 7669.34 | 7995.47 | 6372.19 | NS | <0.001 |
| Transfusion (incidence/1000 patients-year) | 83.70 | 102.64 | 61.57 | NS | NS |
Intervention phase 1:
[a] Hb measurements (n=697) following the suggestions that were accepted by the physician.
[b] Hb measurements (n=180) following the ACM suggestions that were rejected by the physician.
[c] Hb measurements (n=239) that were not eligible for ACM.
Intervention phase 2:
[a] Hb measurements (n=950) following the ACM suggestions that were accepted by the physician.
[b] Hb measurements (n=8) following the ACM suggestions that were rejected by the physician.
[c] Hb measurements (n=214) that were not eligible for ACM.
The analysis of results including only accepted suggestions, both Hg in range and dose of EEA showed a decisive improvement (85.4% of Hb values in range with a median use of darbepoetin of 10μg/month [40] in the intervention phase-1 and 86.2% of Hb values in range with a median of darbepoetin=20μg/month [60] in the intervention phase-2.
The percentage of Hb measurements above the range was higher during the control phase than the intervention phases (intervention phase-1: 8.24%; control phase: 13.55% (p<0.001); intervention phase-2: 7.42%, p<0.001); this effect was even more remarkable if only the laboratory results obtained from the accepted ACM suggestions were considered.
The monthly iron consumption per patient also decreased during the two intervention periods, but this decrease was only significant in the intervention phase-2 (intervention phase-1: 100mg/m [200], control phase: 150mg/m [300], p=NS, intervention phase-2: 100mg/m [200], p<0.001).
Other relevant analytical differences were also observed. It should be noted that during the intervention phases, patients had reduced levels of CRP (intervention phase-2: 4.66mmol/l, control phase: 6.68mmol/l, p=0.009) and of ferritin (intervention phase-1: 459ng/ml; control phase: 511ng/ml, p=0.005) and higher levels of albumin (intervention phase-1: 3.93g/dl, control phase: 3.84g/dl, p=0.001). In addition, during the intervention phase-1, a greater number of HDF treatments were performed, and no significant differences in the rest of the study periods (intervention phase-1: 66.2%, p=0.004; control: 52.51%; intervention phase-2: 51.38%, p=NS).
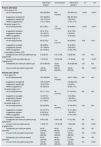
The effect of vascular access on the primary outcome was analysed separately. The results are presented in Table 3 using the same indicators but divided into two categories: native or prosthetic arteriovenous fistula (AVF) versus catheter. It is striking to observe that only in the group of patients with AVF the consumption of darbepoetin varies throughout of the different stages of the study; thus, it increases by 34% during the control phase and decreases by 16% after resuming the use of MCA during the intervention phase-2. In the group of patients with a catheter, the consumption of darbepoetin did not change after the use of ACM and was also 30% higher as compared to the consumption in the group with AVF.
Primary results at the dialysis center according to the vascular access.
| Intervention phase 1 | Control phase | Intervention phase 2 | p1a | p2b | |
|---|---|---|---|---|---|
| Patients with fistula | |||||
| Hb in range (n,%) | |||||
| All Hb measurements | 683 (82.99%) | 643 (73.32%) | 765 (83.61%) | <0.001 | <0.001 |
| Suggestions accepted [c] | 467 (88.95%) | 685 (87.48%) | |||
| Suggestions rejected [d] | 103 (73.57%) | 3 (50.00%) | |||
| Without suggestion [e] | 113 (71.52%) | 77 (61.11%) | |||
| Hb above range (n,%) | |||||
| All Hb measurements | 60 (7,29%) | 119 (13.57%) | 60 (6.56%) | <0.001 | <0.001 |
| Suggestions accepted | 22 (4,19%) | 48 (6.13%) | |||
| Suggestions rejected | 19 (1357%) | 0 (0.00%) | |||
| Without suggestion | 19 (12,03%) | 12 (9.52%) | |||
| Hb below range (n,%) | |||||
| All Hb measurements | 80 (9.72%) | 115 (13.11%) | 90 (9.84%) | 0.03 | 0.03 |
| Suggestions accepted | 36 (6.86%) | 50 (6.39%) | |||
| Suggestions rejected | 18 (12.86%) | 3 (50.00%) | |||
| Without suggestion | 26 (16.46%) | 37 (29.37%) | |||
| Consumption (median, ICR) | |||||
| Darbepoetin per month per patient per kg (g/kg/month) | 0.23 [0.87] | 0.31 [1.05] | 0.26 [0.94] | 0.01 | NS |
| Iron per month per patient per kg (mg/kg/month) | 1.97 [3.67] | 2.03 [4.35] | 1.27 [2.84] | NS | <0.001 |
| Darbepoetin per month per patient (g/m) | 20.00 [60.00] | 20.00 [72.50] | 20.00 [60.00] | 0.01 | NS |
| Iron per month per patient (mg/month) | 125.00 [300.00] | 200.00 [300.00] | 100.00 [200.00] | NS | <0.001 |
| Patients with catheter | |||||
| Hb in rage (n,%) | |||||
| All Hb measurements | 187 (64.93%) | 210 (70.95%) | 182 (71.09%) | NS | NS |
| Suggestions accepted [f] | 128 (74.42%) | 134 (80.24%) | |||
| Suggestions rejected [g] | 19 (47.50%) | 0 (0.00%) | |||
| Without suggestion [h | 40 (52.63%) | 48 (55.17%) | |||
| Hb above range (n,%) | |||||
| All Hb measurements | 32 (11.11%) | 40 (13.51%) | 27 (10.55%) | NS | NS |
| Suggestions accepted | 10 (5.81%) | 14 (8.38%) | |||
| Suggestions rejected | 13 (32.50%) | 1 (50.00%) | |||
| Without suggestion | 9 (11.84%) | 12 (13.79%) | |||
| Hb below range (n,%) | |||||
| All Hb measurements | 69 (23.96%) | 46 (15.54%) | 47 (18.36%) | 0.01 | NS |
| Suggestions accepted | 34 (19.77%) | 19 (11.38%) | |||
| Suggestions rejected | 8 (20.00%) | 1 (50.00%) | |||
| Without suggestion | 27 (35.53%) | 27 (31.03%) | |||
| Consumption (median, ICR) | |||||
| Darbepoetin per month per patient per kg (g/kg/month) | 0.69 [1.69] | 0.60 [1.49] | 0.74 [1.64] | NS | NS |
| Iron per month per patient per kg (mg/kg/month) | 1.98 [3.77] | 1.97 [4.55] | 1.63 [3.52] | NS | 0.005 |
| Darbepoetin per month per patient (g/month) | 50.00 [120.00] | 40.00 [90.00] | 50.00 [110.00] | NS | NS |
| Iron per month per patient (mg/month) | 100.00 [200.00] | 100.00 [300.00] | 100.00 [200.00] | NS | 0.003 |
| Darbepoetin per month per patient (g/month) | 50.00 [120.00] | 40.00 [90.00] | 50.00 [110.00] | NS | NS |
| Iron per month per patient (mg/month) | 100.00 [200.00] | 100.00 [300.00] | 100.00 [200.00] | NS | 0.003 |
p2: refers to the comparison between the control phase and the intervention phase-2.
FAV. Intervention phase-1:
[c] Measurements of Hb (n=525) following the suggestions of anaemia that were accepted by the physician.
[d] Measurements of Hb (n=140) following suggestions of anaemia that were rejected by the physician.
[e] Hb measurements (n=158) that were ACM not eligible.
FAV. Intervention phase-2:
[c] Measurements of Hb (n=783) following the suggestions of anaemia that were accepted by the physician.
[d] Measurements of Hb (n=6) following the suggestions of anaemia that were rejected by the physician.
[e] Hb measurements (n=126) that were ACM not eligible.
Catheter. Intervention phase-1:
[f] Hb measurements (n=172) following the ACM suggestions that were accepted by the physician.
[g] Hb measurements (n=40) following the ACM suggestions that were rejected by the physician.
[h] Hb measurements (n=76) that were ACM not eligible.
Catheter. Intervention phase 2:
[f] Measurements of Hb (n=167) following the suggestions of anaemia that were accepted by the physician.
[g] Measurements of Hb (n=2) following the suggestions of anaemia that were rejected by the physician.
[h] Hb measurements (n=87) that were ACM not eligible.
Concerning the secondary results, the incidence of cardiovascular events had a sustained decrease over time that did not seem to be dependent on the use of ACM (intervention phase-1: 847.50/1000 patients-year, phase control: 626.09/1000 patients-year, p=0.009, intervention phase-2: 441.23/1000 patients-year, p=0.002). Death events seem to be minor during the intervention phases. It is only significant if the intervention phase with the control phase are compared (intervention phase-1: 1.45%, control phase, 5.48) %, p=0.032, intervention phase-2: 2.75%, p=NS). The number of patients requiring transfusions was similar in the three periods of the study.
Results in the individual patientThe characteristics of the cohort of patients considered for the analysis are presented in Table 4. These are all patients selected from the intervention phase-1, control phase and intervention phase-2, and patients that complied with ACM in intervention phases 1 and 2. With the use of ACM in the intervention phase-2 there was a significant reduction in Hb fluctuation (from 0.91±0.49 to 0.82±0.37g/dl; p=0.04), and a significant increase in the percentage of patients with at least 2/3 of their Hb values in range (from 70.1 to 84.0%, p=0.001).
Primary and secondary outcomes at patient and ACM compliant group level.
| Intervention phase 1 | Control phase | Intervention phase 2 | p1 | p2 | |
|---|---|---|---|---|---|
| All patients | 173 patients | 184 patients | 188 patients | ||
| Primary results | |||||
| Hb (g/dl; mean, SD) | 0.85±0.38 | 0.91±0.49 | 0.82±0.37 | NS | 0.04 |
| Patients with >66.6% Hb in range (n, %) | 135 (78.03%) | 129 (70.11%) | 158 (84.04%) | NS | 0.001 |
| Median dosage of darbepoetin (g; median, ICR) | 20.00 [61.62] | 32.50 [80.00] | 20.00 [70.00] | NS | NS |
| Average absolute delta dose of darbepoetinaa(g; median, ICR) | 20.00 [60.00] | 30.00 [80.00] | 22.50 [80.00] | NS | NS |
| Secondary results | |||||
| Patients with cardiovascular events (n, %) | 52 (30.06%) | 35 (19.02%) | 17 (9.04%) | 0.01 | 0.006 |
| Cardiovascular events (incidence/1000 patients-year) | 736.00 | 536.57 | 254.98 | 0.01 | <0.001 |
| Hospitalization days (incidence/1000 patients-year) | 6425.44 | 7,195.75 | 5,443.29 | NS | <0.001 |
| Transfusion (incidence/1000 patients-year) | 81.78 | 111.78 | 66.52 | NS | NS |
| ACM group compliant | 111 patients | 184 patients | 154 patients | ||
| Primary results | |||||
| Hb (g/dl; average, SD) | 0.83±0.41 | 0.91±0.49 | 0.77±0.35 | NS | 0.002 |
| Patients with >66.6% Hb in range (n, %) | 94 (84.68%) | 129 (70.11%) | 139 (90.26%) | 0.005 | <0.001 |
| Median dose of darbepoetin (g; median, ICR) | 10.00 [45.00] | 32.50 [80.00] | 17.50 [55.00] | <0.001 | 0.014 |
| Delta mean absolute dose of darbepoetin (g; median, ICR) | 5.00 [40.00] | 30.00 [80.00] | 15.00 [60.00] | <0.001 | 0.02 |
| Secondary results | |||||
| Patients with cardiovascular events (n, %) | 31 (27.93%) | 35 (19.02%) | 14 (9.09%) | NS | 0.01 |
| Cardiovascular events (incidence/1000 patients-year) | 704.63 | 536.57 | 241.77 | NS | <0.001 |
| Hospitalization days (incidence/1000 patients-year) | 4914.36 | 7195.75 | 3935.42 | <0.001 | <0.001 |
| Transfusion (incidence/1000 patients-year) | 18.07 | 111.78 | 0.00 | 0.02 | <0.001 |
These results are confirmed and even accentuated in the ACM compliant group. For these patients, the fluctuation of Hb was further reduced in the intervention phases, but it was significant in the intervention phase-2 (0.83±0.41g/dl in the intervention phase-1, p=NS, and 0.77±0.35g/dl in the intervention phase-2, p<0.001) and it was also observed an increase in the percentage of patients with the majority of Hb values in range (84.7% in the intervention phase-1, p=0.005, 90.3% in the intervention phase-2, p<0.001).
Secondary outcomes also tended to be reduced during the use of ACM, particularly in the ACM compliant group, where a significant decrease in the incidence of transfusions and days of hospitalisation per 1000 patient-years were observed (although this is not confirmed in the global analysis). Conversely, cardiovascular events show a downward trend over time that does not seem to be dependent on the use of ACM.
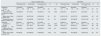
The primary results obtained according to the type of vascular access in the individual patient are presented in Table 5. The data are divided into two categories: native/prosthetic AVF versus catheter. During the intervention phase-2, the group of patients with AVF have a decrease in Hb variability (from 0.88±0.44 to 0.77±0.35, p=0.02), as well as an increase in the percentage of patients with Hb in range (71.85–86.67%, p=0.002). This is more remarkable in the group of confirmed suggestions (ACM compliant group), where the variability of Hb is further reduced, reaching 0.74±0.34 in the intervention phase-2, and the percentage of patients with >66.6% Hb in the range exceeded 90% during the two intervention phases. The consumption of darbepoetin was increased during the control phase, while the percentage of patients with Hb in range was reduced. The group of patients with catheter have a greater consumption of darbepoetin as compared to the group of AVF, but without significant changes in the different phases of the study.
Primary outcome at the patient level according to vascular access.
| Native or prosthetic fistula | CATHETER | |||||||||
|---|---|---|---|---|---|---|---|---|---|---|
| Intervention phase 1 | Control phase | Intervention phase 2 | p1 | p2 | Intervention phase 1 | Control phase | Intervention phase 2 | p1 | p2 | |
| All patients, n | 130 patients | 135 patients | 150 patients | 43 patients | 49 patients | 38 patients | ||||
| Hb (g/dl; mean±SD) | 0.79±0.33 | 0.88±0.44 | 0.77±0.35 | NS | 0.02 | 1.02±0.48 | 1.00±0.58 | 1.00±0.41 | NS | NS |
| Patients with more than 66.6% Hb in range (n, %) | 109 (83.85%) | 97 (71.85%) | 130 (86.67%) | 0.02 | 0.002 | 26 (60.47%) | 32 (65.31%) | 28 (73.68%) | NS | NS |
| Median dose of Darbe (g; median, ICR) | 15.00 [55.00] | 25.00 [75.00] | 20.00 [65.00] | NS | NS | 50.00 [101.25] | 40.00 [73.75] | 40.00 [95.00] | NS | NS |
| Absolute delta dose of Darbea (g; median, ICR) | 10.00 [50.00] | 20.00 [80.00] | 20.00 [70.00] | NS | NS | 40.00 [86.25] | 40.00 [82.50] | 40.00 [110.00] | NS | NS |
| ACM group | 82 patients | 135 patients | 131 patients | 29 patients | 49 patients | 23 patients | ||||
| Cumplidoresb, n | 0.74±0.31 | 0.88±0.44 | 0.74±0.34 | 0.01 | 0.006 | 1.08±0.53 | 1.00±0.58 | 0.90±0.40 | NS | NS |
| Hb (g/dl; mediagram±SD) | 76 (92.68%) | 97 (71.85%) | 120 (91.60%) | <0.001 | <0.001 | 18 (62.07%) | 32 (65.31%) | 19 (82.61%) | NS | NS |
| Patients with more than 66.6% Hb in range (n, %) | 0.00 [30.00] | 25.00 [75.00] | 10.00 [58.75] | <0.001 | NS | 30.00 [93.75] | 40.00 [73.75] | 20.00 [50.00] | NS | NS |
| Median dose of Darbe (g; median, ICR) | 0.00 [30.00] | 20.00 [80.00] | 10.00 [60.00] | <0.001 | NS | 30.00 [80.00] | 40.00 [82.50] | 20.00 [47.50] | NS | NS |
This prospective study, carried out in the dialysis patients from the clinics of Cartagena and San Pedro del Pinatar, compares the results of anaemia obtained during the implementation of a nephrologist aid software for the treatment of anaemia with the results of decision making through the conventional trial-error adjustment.
Analysis of results at the dialysis centre level showed a general worsening of the primary results during the control phase, with a lower percentage of patients with Hb in range when the ACM program was not used; this proves the positive effect of MCA, this effect is more evident in patients with confirmed ACM recommendations.
With respect to the individual patient, ACM achieves a greater number of patients with Hb in range with reduced variability, being this more evident in the ACM compliant group. So we it can be affirmed that the treatment adjustment of anaemia with the help of ACM results in a more efficient consumption of darbepoetin. Certainly, there are different factors inherent to the characteristics of the patient population that could influence the results obtained. In this sense it was noted that during the intervention phases there seems to be a lower degree of inflammation as reflected by the levels of CRP, ferritin and albumin. Another conditioning factor in this situation is the lower number of catheters observed during these phases and the differences in the modality of haemodialysis with a greater number of HDF during the first phase of the study. All these factors may condition better control of anaemia, independently of ACM.
Inflammation is a factor implicated in the higher variability of Hb and in a higher rate of resistance to erythropoietin (ERI).27,34 Both Dellanna et al.43 and Mueller et al.44 analysed data from a large cohort of patients on haemodialysis, showing that lower levels of CRP are associated with better control of anaemia, but they did not find significant differences in ferritin, transferrin saturation or dialysis parameters. In the same line, Molina et al.34 describe a significant decrease in CRP levels and ERI with the use of ultrapure water in patients on high-flux haemodialysis.
Another known factor that can affect the results in anaemia is the patient state of hydration. In the study conducted by Castellano et al.,45 a reduction in the consumption of EEA and ERI was observed after correcting overhydration, measured by bioimpedance, without being able to discriminate whether this difference was due to haemoconcentration or to a decrease in inflammation associated with overhydration.
The differences in the hydration status of our patients, as measured by bioimpedance (BCM®, FMC), are evident. However, the degree to which they have been able to condition haemodilution or haemoconcentration and modify the dose of EEA prescribed by the nephrologist or suggested by the program is difficult to ponder.
It is not possible to draw conclusions regarding the number of cardiovascular events, transfusions and hospitalisations during the study; however the greater number of hospitalisation days during the control phase could explain the greater need for darbepoetin and iron and this may have conditioned, a drug dose carryover a better results during the intervention phase.
If we compare our results with the excellent results obtained in the recent study by Barbieri et al.,40 the use of ACM in our population produced an even greater benefit, achieving more than 80% of patients with Hb in range (76.65% compared to 80.89% in the intervention phase-2) with a lower intake of darbepoetin and iron (0.46/1.67mmol/kg/month vs. 0.35/1.34mg/kg/month). These differences appear to be related to the characteristics of the populations studied. A main factor is greater number of native AVF in our study, reaching 74.7% during the intervention phase-2 versus 65.3% in the study published by Barbieri et al.40
It is widely known that vascular access has a great impact on the results of anaemia in haemodialysis patients. Specifically, in our population, having an AVF was associated with lower EEA consumption, low Hb variability and increased number of patients with Hb levels in range. Similar results have been described by other authors. Thus, Eckardt et al.46 point out that changes in vascular access and not having a fistula are associated with greater Hb variability. The study by Lau et al.22 shows that, unexpectedly, the use of catheters as vascular access in haemodialysis patients is associated with a faster Hb increase, while Pisoni et al.47 found in his DOPPS analysis that the population with catheters is less likely to have Hb levels of 11g/dl or higher.
Although the positive effect of ACM is observed in the entire group of patients analysed, it is more prominent in the subgroup of patients with a large percentage of suggestions confirmed. However, the decrease in the dose of darbepoetin can be seen only in the group of patients with AVF. This finding does not go against the validation or accuracy of ACM, but rather underlines the deleterious effect of the use of catheters in the use of EEA due to blood loss or inflammation, as previously reported by different authors.48,49
Why does the model obtain these good results?We should state that the algorithm has been designed in such a way that it incorporates data on the pharmacokinetics and pharmacodynamics of darbepoetin with a special focus on the erythrocyte maturation time and its lower survival in situations of renal failure. It also uses anthropometric, laboratory, dialysis dose and clinical data to come out with the dose suggestion. On the other hand, MCA considers that the current Hb levels are influenced by the doses of darbepoetin received in the last 3½ months and it bases the recommendations on the doses administered (not those prescribed) taking into account the administration schedule.50 All this together makes the ACM to achieve a great precision, minimizing the fluctuations of human prescription.
What is the nephrologist's attitude about the new tool?Looking at the number of prescription confirmations throughout the study, we observed that number of suggestions accepted increased from intervention phase 1 to intervention phase 2. This translates into a distrust by the nephrologist on the suggestions proposed by the new tool, rejecting a large number of suggestions and obtaining worse results, while in the second phase of intervention, the safety of the model seems to increases, which translates into a greater number of accepted suggestions resulting in more patients with Hb in range and a lower variability in Hg levels. The growing percentage of acceptance makes us think that nephrologists not only agree in simple cases clinically stable, but the is a high confidence in the program, which is demonstrated in the improvement of results at a general level.
During the last decade there have been different prediction algorithms used to improve the treatment of renal anaemia and individualize the dose of ESA in dialysis patients; and the results have been promising results. Noteworthy is the prospective and multicenter study published by McCarthy et al.,51 which describes improvements in Hb variability and a 40% reduction in the dose of darbepoetin in a large population of haemodialysis patients when a biomedical system is applied in patients treated with iron. Although the results seem similar to ours, there are notable differences in both studies that makes comparisons difficult, such as the use of higher doses of darbepoetin both at the beginning and at the end of the study and a greater range of target Hb (10–12.9g/dl).
One of the limitations of the present study is that, despite of being prospective, the value of n is not very large and the follow-up time is insufficient to assess the impact of ACM on cardiovascular morbidity and mortality. Given the characteristics of the program and the need to have sufficient detailed and updated information for each patient, its validation in incident patients may be difficult to analyse (given the small number of incident patients); hospitalisations and vacations results in loss of follow-up and subtracting data to the program. We should consider that it is likely that an analysis including prevalent patients without hospitalisations and with AVF would have reflected more accurately the capabilities of ACM by itself. However, we have tried to reproduce the usual clinical practice while maintaining all factors that the nephrologist has to deal with. Another limitation to consider is that the program has only been validated with darbepoetin and in the haemodialysis population, thus, it cannot be used in other clinical scenarios.
In conclusion, in our study, MCA was an effective tool to help the clinician, improving the results of anaemia in patients on haemodialysis, minimizing the risks of treatment with ESA and reducing costs.
Conflict of interestsC.B., J.I.T. and R.R. have developed the program and they are employees of FMC. The rest of the authors do not have a conflict of interest.
The following are the supplementary data to this article:

Please cite this article as: Bucalo ML, Barbieri C, Roca S, Ion Titapiccolo J, Ros Romero MS, Ramos R, et al. El modelo de control de anemia: ¿ayuda al nefrólogo en la decisión terapéutica para el manejo de la anemia? Nefrologia. 2018;38:491–502.