Kidney donor shortage requires expanding donor selection criteria, as well as use of objective tools to minimize the percentage of discarded organs. Some donor pre-transplant variables such as age, standard/expanded criteria donor (SCD/ECD) definition and calculation of the Kidney Donor Profile Index (KDPI), have demonstrated correlations with patient and graft outcomes. We aimed to establish the accuracy of the three models to determine the prognostic value of kidney transplantation (KT) major outcomes.
Material and methodsWe performed a retrospective study in deceased donor KTs at our institution. Unadjusted Cox and Kaplan–Meier survival, and multivariate Cox analyses were fitted to analyze the impact of donor age, SCD/ECD and KDPI on outcomes.
Results389 KTs were included. Mean donor age was 53.6±15.2 years; 163 (41.9%) came from ECD; mean KDPI was 69.4±23.4%. Median follow-up was 51.9 months. The unadjusted Cox and Kaplan–Meier showed that the three prognostic variables of interest were related to increased risk of patient death, graft failure and death-censored graft failure. However, in the multivariate analysis only KDPI was related to a higher risk of graft failure (HR 1.03 [95% CI 1.01–1.05]; p=0.014).
ConclusionsSCD/ECD classification did not provide significant prognostic information about patient and graft outcomes. KDPI was linearly related to a higher risk of graft failure, providing a better assessment. More studies are needed before using KDPI as a tool to discard or accept kidneys for transplantation.
La escasez de donantes de riñón requiere una ampliación de los criterios de selección de donantes, así como el uso de herramientas objetivas para minimizar el porcentaje de órganos descartados. Algunas variables pretrasplante del donante, como la edad, la definición de donante con criterios de selección estándar/ampliados (standard/expanded criteria donor [SCD/ECD]) y el cálculo del índice del perfil de donante renal (Kidney Donor Profile Index [KDPI]) han demostrado correlación con los resultados del paciente y el injerto. Nuestro objetivo fue evaluar la precisión de 3 modelos diferentes para determinar el valor pronostico en los resultados del trasplante renal.
Materiales y métodosLlevamos a cabo un estudio retrospectivo de TR de donantes fallecidos en nuestro centro. Se realizó un analisis de supervivencia mediante curvas de Kaplan-Meir y Cox no ajustado, ai como un analisis multivariante de Cox para analizar el impacto de la edad del donante, la definición SCD/ECD y el índice KDPI sobre los resultados.
ResultadosSe incluyeron 389 TR. La media de edad de los donantes era de 53,6±15,2 años; 163 (41,9%) procedían de donantes ECD; el índice KDPI medio era de 69,4±23,4%. La mediana de seguimiento era de 51,9 meses. Los análisis de Kaplan-Meier y de Cox no ajustado mostraron que las 3 variables pronósticas de interés estaban relacionadas con un mayor riesgo de muerte del paciente, fracaso del injerto y fracaso del injerto censurado por la muerte. Sin embargo, en el análisis multivariable solamente el índice KDPI estuvo relacionado con un mayor riesgo de fracaso del injerto (HR: 1,03 [IC 95%: 1,01-1,05]; p=0,014).
ConclusionesLa clasificación SCD/ECD no proporcionó información pronóstica significativa sobre los desenlaces del paciente y el injerto. El índice KDPI estuvo linealmente relacionado con un mayor riesgo de fracaso del injerto, por lo que ofrecía una mejor evaluación. Es necesario realizar más estudios antes de usar el índice KDPI como herramienta para descartar o aceptar riñones para trasplante.
The gap between organ supply and the number of patients requiring kidney transplantation (KT) becomes larger along the time.1 In addition, age and comorbidity have increased in parallel both in donors and recipients,2–3 so the evaluation and the use of organs from so-called suboptimal donors has become routine. The dilemma that transplant physicians face every day is whether to accept a kidney from an old donor associated with lower allograft survival4–5 or to discard the organ, remaining the patient on dialysis with a considerable mortality risk while waiting for the next offer.6–8 The development of score tools may help to discriminate organs that can achieve enough renal function for a particular recipient and therefore could be safely accepted, is a prime necessity in order to reduce high organ discarded rates.
Donor age is the most classical factor taken into account for accepting or not a kidney, as older age is related with lower patient and graft survival.3,6 However, several studies have confirmed the survival benefit with KT, even from very old donors, compared with remaining on dialysis.6–8 Therefore, age itself should not be a limiting parameter to accept or discard a kidney graft.
More than fifteen years ago, new criteria were established for the categorization of the donor as expanded (ECD) or standard (SCD) according with four donor variables: age, donor creatinine, cause of death, and history of hypertension.9 This classification has been widely accepted and used worldwide during the last decade. Many studies have reported higher risk of graft failure (return to dialysis or patient death) and/or primary non-function with ECD kidneys than with SCD ones.10,11 However, some studies have also shown the benefit of receiving an ECD KT over remaining on dialysis.6,7,12 In addition, external validation of the ECD criteria in non-US kidney transplant centers and correlation with outcomes have been quite poor.13 Overall, SCD/ECD classification has been more useful for scientific purposes than as a practical tool to discard organs in our setting.
Recently, the Organ Procurement Transplant Network (OPTN) has developed the Kidney Donor Risk Index (KDRI) and Profile Index (KDPI) in the US, looking for improving the predictive ability for poor outcomes of the SCD/ECD classification.14,15 The KDPI is a percentile measure designed to characterize donor-associated risks of the deceased donor kidneys. Higher KDPI values are associated with poorer donor quality and vice versa. In the setting of the US allocation system, a donor with a KDPI >85% is thought to be equivalent to an ECD donor and is considered as a high-risk kidney.15
KDPI is a continuous scale based on more donor characteristics than previous classifications (10 for KDPI vs. 4 for ECD). However, despite being an improved prediction tool over ECD, KDPI has only shown a moderate predictive power.14–16 In addition, as this index has been developed only with US implanted kidneys, the tool applicability to other places with different allocation systems, outcomes and demographic characteristics is unknown and may not achieve the quality standard for outcome predictions.16–19
Our aim was to evaluate the usefulness of KDPI in our KT population. We performed a study assessing the outcomes of deceased donor kidney transplants (DDKT) according to the donor age, the SCD/ECD classification and the KDPI score.
Material and methodsStudy design and data collectionThis was a retrospective patient cohort based study. The initial study cohort included 505 DDKT performed in our center between January 2004 and December 2014. We excluded KT from donors younger than 18 years old (n=10), living donor KT (n=56) and all cases with missing data necessary to calculate the KDPI score (n=50). Finally, 389 DDKT in 377 patients were analyzed.
Clinical data were collected from our local transplant database which includes: baseline demographic characteristics from donors and recipients, transplant characteristics and clinical follow-up variables periodically registered, complications and patient/graft survival. The study was undertaken following the principles in the World Medical Association Declaration of Helsinki, only relying in the official center database.
DefinitionsECDs were defined by the United Network for Organ Sharing (UNOS) criteria as following: age greater than or equal to 60 years old, or age between 50 and 59 years old with at least two risk factors, including death by cerebrovascular accident, history of hypertension, and a creatinine level greater than 1.5mg/dl.9
KDPI was calculated from donor variables including age, race, diabetes, hypertension, serum creatinine, height, weight, hepatitis C seropositive, and cause of death, using the method described by the OPTN.14,15
Delayed graft function was defined as the need of at least one dialysis session within first week after kidney transplantation.20
Hard outcomes evaluated were: patient death, graft failure (defined as the need of renal replacement therapy, preemptive re-transplantation or death with functioning graft), and death-censored graft failure.
VariablesDonor variables included in ECD and KDPI definitions were considered, as well as recipient variables, such as age, sex, ethnicity, hypertension, diabetes, hepatitis C virus, hepatitis B virus, cardiac disease, peripheral vascular disease, underlying kidney disease, maximum cytotoxic panel reactive antibody (PRA) prior to transplant and time on dialysis before transplant. Some transplant variables were also collected: cold ischemic time, delayed graft function and acute rejection proven by biopsy.
Statistical analysisQuantitative variables with a normal distribution are expressed as mean and standard deviation (SD) and the remaining as median and interquartile range [IQR]. Survival curves were performed by Kaplan–Meier analysis and Cox univariate and multivariate analyses were performed. Results are expressed as hazard ratio (HR) with their 95% confidence intervals (95% CIs). In the multivariate analysis only those variables with a p value <0.05 were included. We performed three different multivariate models of survival analysis (patient, graft and death-censored graft survival) for each predictor (donor age, SCD/ECD and KDPI scores). The variable acute rejection proven by biopsy was included as time-dependent covariate in both graft and death-censored graft survival analyses.
We also performed receiver operational characteristic (ROC) curves for assessing the predictive ability of both donor age and KDPI for estimating graft-failure and death-censored graft-failure. The value of marker defined as cut-off was determined by the maximum of Youden index (J=sensitivity+specificity−1).
A p value <0.05 was considered statistically significant. Statistical analysis was performed using SPSS V 21.0 (SPSS Inc., Chicago, IL).
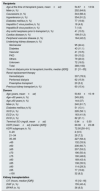
ResultsA total of 505 KT were performed in our center between January 2004 and December 2014. Of them, 389 KT done in 377 patients fully met inclusion criteria. The median time of follow-up was 51.9 months [IQR, 24.6–88.6]. The baseline characteristics of recipients, donors, and kidney transplants are shown in Table 1.
Baseline characteristics of recipients, donors and kidney transplants.
| Recipients | |
| Age at the time of transplant (years, mean±sd) | 54.67±13.54 |
| Male (n, %) | 252 (64.8) |
| Caucasians (n, %) | 344 (88.4) |
| Hypertension (n, %) | 354 (91.2) |
| Diabetes mellitus (n, %) | 77 (19.8) |
| Hepatitis C virus positive (n, %) | 18 (4.6) |
| Hepatitis B virus positive (n, %) | 7 (1.8) |
| Any solid neoplasia prior to transplant (n, %) | 41 (10.5) |
| Cardiac disease (n, %) | 199 (51.2) |
| Peripheral vascular disease (n, %) | 164 (42.2) |
| Underlying kidney disease (n, %) | |
| Glomerular | 95 (24.4) |
| Diabetes | 43 (11.1) |
| Vascular | 41 (10.5) |
| PKD | 59 (15.2) |
| Others | 79 (20.3) |
| Unknown | 72 (18.5) |
| Total | 389 (100) |
| Time on dialysis prior to transplant (months, median [IQR]) | 21 [11–35] |
| Renal replacement therapy | |
| Hemodialysis | 307 (78.9) |
| Peritoneal dialysis | 62 (15.9) |
| Preemptive transplant | 20 (5.2) |
| Previous kidney transplant (n, %) | 60 (15.4) |
| Donors | |
| Age (years, mean±sd) | 53.63±15.19 |
| Age <60 years (n, %) | 245 (63) |
| Age ≥60 years (n, %) | 144 (37) |
| Male (n, %) | 240 (61.7) |
| Diabetes mellitus (n,%) | 51 (13.1) |
| SCD (n, %) | 226 (58.1) |
| ECD (n, %) | 163 (41.9) |
| DCD (n, %) | 82 (21.1) |
| Terminal SCr (mg/dl, mean±sd) | 0.94±0.50 |
| KDPI (mean±sd) (median [IQR]) | 69.36±23.38 |
| KDPI subgroups (n, %) | 72.00 [50–91] |
| 0–20 | 2 (0.5) |
| 21–34 | 28 (7.2) |
| 35–85 | 227 (58.4) |
| >85 | 132 (33.9) |
| ≥60 | 236 (60.7) |
| ≥65 | 207 (53.2) |
| ≥70 | 196 (50.4) |
| ≥75 | 190 (48.8) |
| ≥80 | 169 (43.4) |
| ≥85 | 138 (35.5) |
| ≥90 | 114 (29.3) |
| ≥95 | 77 (19.8) |
| =100 | 32 (8.2) |
| Kidney transplantation | |
| CIT (hours, median [IQR]) | 15 [12–18] |
| DGF (n, %) | 155 (40.4) |
| BPAR (n, %) | 36 (9.3) |
SD, standard deviation; IQR, interquartile range; PKD, polycystic kidney disease; ECD, expanded criteria donor; SCD, standard criteria donor; DCD, donor after cardiac death; SCr, serum creatinine; KDPI, kidney donor profile index; CIT, cold ischemia time; DGF, delayed graft function; BPAR, biopsy-proven acute rejection.
We registered ninety-three graft losses during the follow-up; 53 death-censored graft losses and 40 patients who died with a functioning kidney.
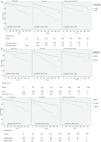
Univariate Cox analysis showed that donor age, ECD status and KDPI score were related with higher risk of patient death, graft failure and death-censored graft failure (Table 2). Same results were obtained with Kaplan–Meier survival curves (Fig. 1).
Cox univariate analysis with variables related to patient death, graft failure and death-censored graft failure.
| Variable | Patient death | Graft failure | Death-censored graft failure | p | ||
|---|---|---|---|---|---|---|
| HR (CI 95%) | p | HR (CI 95%) | p | HR (CI 95%) | ||
| Recipient age (years) | 1.07 (1.04–1.10) | <0.001 | 1.05 (1.03–1.07) | <0.001 | 1.04 (1.02–1.06) | <0.001 |
| Hypertension | 2.09 (0.50–8.68) | 0.308 | 3.14 (0.99–9.91) | 0.051 | 5.44 (0.75–39.36) | 0.093 |
| Diabetes Mellitus | 3.39 (1.76–6.56) | <0.001 | 2.75 (1.76–4.28) | <0.001 | 2.42 (1.35–4.35) | 0.003 |
| Cardiac disease | 4.69 (2.08–10.59) | <0.001 | 2.09 (1.34–3.24) | 0.001 | 1.42 (0.59–3.39) | 0.429 |
| Peripheral vascular disease | 2.78 (1.44–5.39) | 0.002 | 2.23 (1.46–3.40) | <0.001 | 1.79 (1.01–2.96) | 0.047 |
| Neoplasia prior to transplant | 1.68 (0.79–4.04) | 0.237 | 1.83 (1.05–3.19) | 0.031 | 1.86 (0.91–3.82) | 0.087 |
| Previous KT | 1.60 (0.78–3.28) | 0.192 | 1.62 (1.009–2.63) | 0.046 | 1.56 (0.82–2.97) | 0.172 |
| On dialysis before KT (vs. preemptive) | 1.14 (0.57–2.29) | 0.703 | 0.93 (0.57–1.48) | 0.927 | 0.77 (0.41–1.44) | 0.774 |
| Peak PRA (%) | 1.00 (0.99–1.01) | 0.589 | 1.01 (1.01–1.03) | 0.021 | 1.01 (1.00–1.03) | 0.057 |
| Donor age (years) | 1.05 (1.02–1.07) | <0.001 | 1.05 (1.03–1.06) | <0.001 | 1.05 (1.03–1.07) | <0.001 |
| Donor age (years) subgroups | ||||||
| ≥50 | 2.91 (1.38–6.11) | 0.005 | 3.17 (1.89–5.31) | <0.001 | 3.15 (1.58–6.28) | 0.001 |
| ≥55 | 2.79 (1.46–5.34) | 0.002 | 3.40 (2.15–5.36) | <0.001 | 3.87 (2.06–7.25) | <0.001 |
| ≥60 | 3.23 (1.73–6.03) | 0.000 | 3.55 (2.33–5.40) | <0.001 | 3.76 (2.15–6.58) | <0.001 |
| ≥65 | 2.71 (1.41–5.22) | 0.003 | 2.73 (1.78–4.18) | <0.001 | 2.79 (1.61–4.84) | <0.001 |
| ≥70 | 2.94 (1.38–6.25) | 0.005 | 3.30 (2.07–5.25) | <0.001 | 3.70 (2.07–6.60) | <0.001 |
| ≥75 | 3.01 (1.06–8.54) | 0.038 | 3.61 (1.99–6.55) | <0.001 | 4.38 (2.18–8.80) | <0.001 |
| ≥80 | 7.62 (1.78–32.6) | 0.006 | 8.63 (4.09–18.22) | <0.001 | 10.62 (4.68–24.09) | <0.001 |
| ≥85 | 3.08 (1.66–5.79) | <0.001 | 6.68 (0.90–48-50) | 0.060 | 8.44 (1.15–61.71) | 0.036 |
| ECD | 3.65 (1.93–6.89) | <0.001 | 3.17 (2.08–4.85) | <0.001 | 2.75 (1.58–4.79) | <0.001 |
| KDPI | 1.03 (1.01–1.04) | <0.001 | 1.03 (1.02–1.04) | <0.001 | 1.04 (1.02–1.05) | <0.001 |
| KDPI subgroups | ||||||
| ≥60 | 2.62 (1.31–5.26) | 0.007 | 3.39 (2.04–5.65) | <0.001 | 4.03 (1.96–8.20) | <0.001 |
| ≥65 | 2.95 (1.52–5.73) | 0.001 | 3.74 (2.32–6.02) | <0.001 | 4.40 (2.25–8.58) | <0.001 |
| ≥70 | 3.00 (1.56–5.76) | 0.001 | 3.56 (2.25–5.62) | <0.001 | 3.96 (2.10–7.43) | <0.001 |
| ≥75 | 3.15 (1.64–6.04) | 0.001 | 3.37 (2.15–5.27) | <0.001 | 3.43 (1.88–6.27) | <0.001 |
| ≥80 | 4.19 (2.17–8.05) | <0.001 | 3.78 (2.44–5.85) | <0.001 | 3.83 (1.90–6.00) | <0.001 |
| ≥85 | 3.08 (1.60–5.74) | <0.001 | 3.13 (2.07–4.73) | <0.001 | 3.14 (1.81–5.41) | <0.001 |
| ≥90 | 2.60 (1.39–4.87) | 0.003 | 2.92 (1.93–4.40) | <0.001 | 3.19 (1.86–5.46) | <0.001 |
| ≥95 | 2.27 (1.10–4.66) | 0.026 | 2.86 (1.84–4.44) | <0.001 | 3.42 (1.96–5.94) | <0.001 |
| 100 | 1.26 (0.30–5.30) | 0.747 | 2.60 (1.38–4.94) | 0.003 | 3.33 (1.61–6.88) | 0.001 |
| DGF | 2.00 (1.07–3.75) | 0.030 | 2.60 (1.68–4.01) | <0.001 | 3.16 (1.74–5.74) | <0.001 |
| BPAR | 1.41 (0.47–4.26) | 0.539 | 2.48 (1.36–4.54) | 0.003 | 3.48 (2.26–5.36) | <0.001 |
HR, hazard ratio; CI, confidence interval; KT, kidney transplant; RRT, renal replacement therapy; PRA, panel reactive antibodies; ECD, expanded criteria donor; KDPI, kidney donor profile index; DGF, delayed graft function; BPAR, biopsy-proven acute rejection.
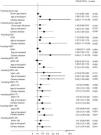
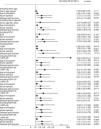
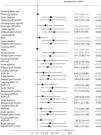
In the multivariate Cox analysis, the variables associated with higher risk of patient death were recipient age at the time of transplantation (HR 1.08 [95%CI, 1.02–1.15]; p=0.013) and recipient cardiac disease (HR 3.56 [1.17–10.78]; p=0.025) (Fig. 2). In the analysis of the risk of graft failure, donor age as a continuous variable was not a risk factor. However, when donor age was transformed into a dichotomous variable (<60 or ≥60 years), an increased risk of graft failure was observed for those recipients who received an organ from a donor ≥60 years (HR 2.07 [1.084–6.27]; p=0.032). We also found that both recipient age at the time of transplant (HR 1.05 [1.01–1.09]; p=0.042), acute rejection (HR 2.36 [1.14–4.85]; p=0.020), and delayed graft function (HR 2.41 [1.17–4.95]; p=0.016) were significant variables that influenced graft failure (Fig. 3). Acute rejection (HR 3.40 [1.59–7.24]; p=0.001) and delayed graft function (HR 3.20 [1.39–7.34]; p=0.006) also had a negative impact on death-censored graft failure (Fig. 4).
When ECD was included as a predictor factor in the multivariate analysis, no impact was detected on patient death, graft failure or death-censored graft failure (Figs. 2–4).
On the other hand, the multivariate analysis showed a 3% higher risk for graft failure per each percentage point of KDPI increase (HR 1.03 [1.01–1.05]; p=0.014). In addition, considering different KDPI cutoffs produced different HR values, corresponding the highest HR to a KDPI greater or equal than 60% (HR 4.50 [1.33–13.40]; p=0.014]. Interestingly, KDPI values higher than 90% or lower than 55% had no significant impact on graft failure. KDPI as a continuous variable and the different KDPI cutoffs failed to show a significant association with patient death or death-censored graft failure (Figs. 2–4).
Both KDPI and donor age ROC curves showed a moderate but significant predictive ability discriminating graft failure and death-censored graft failure (Table 3).
KDPI and donor age ROC curves regarding graft failure and death-censored graft failure.
| KDPI | Donor age | |||||
|---|---|---|---|---|---|---|
| AUC | p-Value | Cut-off (sensitivity and specificity)a | AUC | p-Value | Cut-off (sensitivity and specificity)a | |
| Graft failure | 0.679 | <0.001 | 79.5 (0.66 and 0.63) | 0.674 | 0.032 | 54.5 (0.72 and 0.58) |
| Death-censored graft failure | 0.687 | <0.001 | 67.0 (0.79 and 0.52) | 0.677 | <0.001 | 54.5 (0.76 and 0.55) |
ROC, receiver operating characteristic; KDPI, kidney donor profile index; AUC, area under curve.
The present study evaluated the predictive value of three different ways (donor age, the SCD/ECD classification and the KDPI score) of assessing the quality of deceased kidney donors at the time of transplant on outcomes. Initial univariate survival analysis showed that all three predicted patient death, graft failure and death-censored graft failure. Nevertheless multivariate adjustment including other significant variables evidenced a poor correlation, exposing a weak predictor power for these tools in our cohort. Donor age above 60 years was marginally related to prognosis, but donor age as a continuous variable was not significantly related. Unlike SCD/ECD classification, KDPI was related with an independent higher risk of graft failure, highlighting the relevance of other factors such as recipient age, acute rejection and delayed graft function in worse outcomes.
Some studies have described a negative impact of donor age on graft survival, especially for donors older than 60 years old.4,5,21 Most of these studies were performed in the US, where the population comprises different demographic and epidemiological characteristics and makes inaccurate the interpretation of the results in our population. In our cohort, over one-third of donors were older than 60 years old. The unadjusted analysis of patient and graft survival showed inferior results for those recipients that received a kidney from an older donor. However, the negative effect of donor age was only observed in increased risk of graft failure among recipients older than 60 years. Other factors showed stronger influence (recipient age in patient death and delayed graft function/acute rejection in graft failure). In 2004, a multicenter European study including more than 3000 patients showed that the higher the donor age was, the poorer the patient and graft survival.22 In contrast to our study, death-censored graft survival was not evaluated, being patient death the second cause for graft loss. Probably, the absence of this aspect in the analysis weakens the applicability of the results. Furthermore, another reason that could explain the discordant results with our study is the exclusion of acute rejection in the multivariate analysis. Acute rejection shows a strong association with an increased risk of graft loss in our cohort mitigating the weight of donor age.
Besides age, donor comorbidities such as established hypertension and death from cerebrovascular accident are also surrogate markers of poorer graft function and survival. In order to incorporate these parameters as a guide in the organ acceptance decision-making, the concept of ECD was introduced in the US in 2002.9 Several publications reported worse survival with ECD kidneys than with SCD ones,23 but others, mainly developed in European settings, showed similar outcomes.24 Querard et al. has recently performed a meta-analysis to evaluate the different impact of SCD/ECD kidneys on outcomes,13 concluding that the use of ECD donors associates with higher risks of patient death and graft failure.25 The main limitation of this meta-analysis is that the five publications included reported US experiences and therefore the external validation of these results is questionable. In our study, 41.9% of donors were classified as ECD. Despite of an impact of ECD vs. SCD in the unadjusted analysis and survival curves on hard outcomes, these findings were not confirmed when adjusted in the multivariate analysis.
In an attempt to improve the predictive ability of the SCD/ECD classification based on four variables, the system of donation and transplantation US has developed the Kidney Donor Profile Index (KDPI). Lower KDPI values are associated with better donor quality and long expected longevity.14,15 In 2014, from a total of 11,807 DDKT performed in the US, only 965 (8.9%) came from a donor with a KDPI score >85%. Data provided for OPTN/SRTR from KT performed between 2004 and 2011, showed lower graft survival with higher KDPI values, falling from 80.6% 5-year survival with kidneys from donors with a KDPI <20%, to 60% in KT from donors with a KDPI higher than 85%.26 In our cohort, the median KDPI score was 69.3%, and 35% of all donors had a KDPI higher that 85%. However, we noticed better results than previously described in the US cohorts in terms of 5-year graft survival, presenting with 87.5% in KT from donors with KDPI 20–84.9% and 69% in KT from donors with KDPI ≥85%. KDPI was clearly related with higher risks of patient death and graft failure in the univariate analysis, but similar to the other two scores evaluated before, when we performed the multivariate analysis this influence become more diffuse. KDPI maintained a significant adjusted correlation with a higher risk of graft failure, with a significant 3% of increased risk of graft failure per each point of KDPI increased. Additionally, we analyzed the impact of KDPI according to different cutoffs and found an increased risk of uncensored graft failure in kidneys with a KDPI between 60% and 85%, without statistically significance above or below this values. We hypothesized that the absence of higher risk of graft failure with KDPIs below 60% or over 90% could be related to a potential positive effect of better matching among lower KDPI donors with younger recipients and among older donors with the highest KDPI values with older recipients, both settings related with lower risk of graft failure. As Tullius et al. reported, immunosenescence may contribute to the relative low risks associated with low quality kidneys.27 Accordingly, Hernandez et al. showed that kidneys with very low quality, defined by the authors as kidneys from donors with KDPI between 81 and 100% had lower relative risk of graft loss among the recipients ≥80 years old compared to recipients <80 years old.28 In our cohort, those recipients who received a kidney from a donor with a KDPI >90% had a mean age of 67±6.9 years and those who received a kidney from a donor with a KDPI >60% of 44.4±10.6 years. These data can be supported by recent results from our group, which show that younger recipients are the ones to get the major benefit receiving a kidney from a very old donor (≥75 years) in terms of better survival compared to those who remained on dialysis waiting for a better kidney.6 However, this finding also could also be secondary to a smaller comparative sample sizes in the extreme KDPI values in our cohort.
The KDRI-AUC for graft loss reported in the US population is 0.60.14 Although we found similar values both for donor age and KDPI, this should not be considered as high discriminative ability for graft-failure as acceptable values are over 0.70.16
There is not enough evidence to validate the KDPI as an organ quality assessment tool in a non-American transplant program with different allocation systems and different KT outcomes. To our knowledge, few studies have assessed KT outcomes related with KDPI score in non-American cohorts. Gandolfini et al. associated higher KDPI values with poorer graft outcomes in an Italian cohort of 442 marginal kidneys allocated to a single or a dual kidney transplantation.29 The study was designed to evaluate the utility of pretransplant donor biopsy in order to decrease the discarded rate of organs with high KDPI values. In contrast, we analyzed the graft survival taking into account other variables as donor age or ECD/SCD classification. In addition, they only consider kidneys from marginal donors missing information for lower values of KDPI. A Korean study evaluated the predictive value of ECD/SCD, KDRI (the index from which the KDPI is derived) and the time zero biopsy regarding 1-year graft survival and graft function in 362 DDKT cases.30 After the multivariate analysis, KDRI was correlated to overall graft survival at one year. In this study patient death and death-censored graft failure were not analyzed and the follow-up was shorter than in our study.
Very recently, Sanchez-Escudero et al. reported kidney graft survival stratified by KDPI and pre-transplant donor biopsy Remuzzi score. The authors concluded that graft survival in patients that received organs with the highest KPDI values (>91%), was similar between kidneys with Remuzzi score 0–3 than 4. Therefore, they postulated pre-tansplant donor biopsy as a supporting tool to accept or reject an organ with a high KDPI value.31 However, this study did not compare in the utility of KDPI score vs. SCD/ECD classification or donor age itself to evaluate the donor eligibility in our environment.
The limitations of our study are those derived of its single-center and retrospective condition. We also need to highlight that the sample size and, especially the low number of cases of graft losses and death-censored graft losses could have reduced the statistical power of the multivariate survival analysis.
Unfortunately, data about kidney graft donor biopsies were not available and a better correlation with histology could not be performed. However, this is the first study that analyzes the KDPI prognostic value on KT outcomes with a long follow-up. Final evidence will come from prospective studies.
We conclude that in our setting, the information provided by isolated donor age and SCD/ECD status is very limited to qualify these variables as good enough criteria for accepting an organ or not. Instead, KDPI calculated with the United States formula relates with higher risk of graft failure. Our results show KDPI as a better assessment tool than donor age or the SCD/ECD classification, albeit not enough to be considered as an organ quality assessment tool in our environment. Development of predictive scores by regions may better help in the organ acceptance decision.
Conflicts of interestThe authors have no conflicts of interest to declare.
FundingMJP-S has support from a Rio Hortega contract, ISCIII. MC and JP are supported by grants FIS ISCIII-FEDER PI13/0598, PI16/00617 and RedinRen RD16/0009/0013.
ContributorsCA-C MJP-S and JP designed the study, performed the analysis and validation of the data. DR-P and AB contributed in data analyses. CA-C and MJP-S drafted the initial report, while all authors contributed to the final manuscript and approved it. CA-C and MJP-S contributed equally.
Xavier Duran Jordà, MStat, PhD. AMIB – Methodological assessment and Biostatistic, IMIM – Institut Hospital del Mar d’Investigacions Mèdiques.


