


The prevalence of Sarcopenia varies between 1.5% and 68% among patients with chronic kidney disease (CKD). This wide range is due to the different diagnostic tools and the cut-off points used. Early diagnosis and intervention of sarcopenia are essential because of its association with poorer quality of life (QoL), higher hospitalization rates, and adverse events. The “European Working Group on Sarcopenia in Older People (EWGSOP2)” consensus review suggests ultrasound as an emerging tool to quantify muscle mass. Our objective is to describe the prevalence of sarcopenia risk in peritoneal dialysis (PD) and the utility of ultrasound in our setting.
Material and methodsWe conducted an observational study in prevalent PD patients at the Puerta de Hierro University Hospital between January and October 2023. Clinical, efficacy, analytical and nutritional parameters were collected, along with functional performance measured by SPPB, frailty (FRAIL scale), risk of malnutrition (MIS scale), bioimpedance (BCM) and estimation of appendicular skeletal muscle mass using Lin’s formula. Ultrasound measurement of supramuscular fat, Axes (X and Y) and the area of the rectus femoris muscle (RFM) were also included, adjusted for height and body surface area. We classified patients at risk of sarcopenia based on handgrip strength according to EWGSOP2 criteria, adjusted for sex. This study was approved by the Ethics Committee of Puerta de Hierro University Hospital (No. 16/2023).
ResultsWe evaluated 38 patients, with a mean age of 65.4 years (SD 14.9), 65.8% were male. 52.6% had a reduced lean tissue index (LTI) and 23.7% had a reduced fat tissue index (FTI), with a mean phase angle (PA) of 4.5 (SD 1.1). We classified 42.1% as patients at risk of sarcopenia based on handgrip strength. They were older, had more comorbidities, poorer nutrition according to the MIS scale, and showed worse scores on frailty and functional capacity. Similary, they had a lower LTI, lower appendicular skeletal muscle mass, and lower quadriceps muscle thickness (Y axis 8.5 mm (SD 2.4) vs 11.8 mm (SD 3.3) p = 0.002). Patients at risk of sarcopenic had lower phosphorus levels and higher C-reactive protein (CRP) levels. The predictive capacity of ultrasound for classifying patients at risk of sarcopenia was AUC 0.78 (0.64−0.93) for Y Axis, similar to those obtained with the LTI and PA of bioimpedance.
ConclusionsSarcopenia risk is highly prevalent in PD and is related to age, comorbidity, malnutrition and inflammation in patients. Ultrasound is an accessible, safe, low-cost and easy-to-use tool at the bedside. This method helps us to quantify muscle mass and assess its quality. We propose the thickness of the RFM (Y axis) as the best complementary parameter given its good correlation with bioimpedance and its diagnostic value for sarcopenic risk. Our experience will serve as a basis for future studies that allow us to define specific cut-off points in PD and design monitoring and intervention protocols.
La prevalencia de Sarcopenia varía entre el 1.5% y el 68% de los pacientes con enfermedad renal crónica (ERC). El amplio intervalo se debe a las distintas herramientas diagnósticas y puntos de corte utilizados. Es preciso establecer un diagnóstico e intervención precoz de sarcopenia, por su asociación a peor calidad de vida (QoL), mayor tasa de hospitalización y eventos. La revisión del consenso “European Working Group on Sarcopenia in Older People (EWGSOP2)”, propone la ecografía como herramienta emergente para cuantificar la masa muscular. Nuestro objetivo es describir la prevalencia de pacientes en riesgo de sarcopenia en diálisis peritoneal (DP) y la utilidad de la ecografía en nuestro medio.
Material y métodosRealizamos un estudio observacional en pacientes prevalentes de DP en el Hospital Universitario Puerta de Hierro durante el periodo de enero a octubre del 2023. Se recogen parámetros clínicos, de eficacia, analíticos y nutricionales junto al desempeño funcional medido por SPPB, fragilidad (escala FRAIL), riesgo de desnutrición (escala MIS), bioimpedancia (BCM) y la estima de la masa apendicular esquelética mediante fórmula de Lin. Se añade la medición ecográfica de la grasa supramuscular, los ejes (X e Y) y el área del recto anterior del cuádriceps (RAC), ajustada por altura y superficie corporal. Clasificamos los pacientes con riesgo de sarcopenia según la fuerza palmar por los criterios EWGSOP2 ajustados por sexo. Este estudio fue aprobado por el Comité de Ética de Investigación con Medicamentos del Hospital Universitario Puerta de Hierro (Nº 16/2023).
ResultadosEvaluamos 38 pacientes, con edad media de 65.4 años (DE 14.9), el 65.8% eran varones. Un 52.6% tenía un índice de masa magra (LTI) disminuido y un 23.7% un índice de masa grasa (FTI) disminuido, con un ángulo de fase (AF) medio de 4.5 (DE 1.1). Clasificamos al 42.1% de los pacientes como riesgo de sarcopenia según la fuerza palmar; eran mayores, comórbidos, peor nutrición por la escala MIS y peores puntuaciones de fragilidad y capacidad funcional. De igual modo, tenían un menor LTI, menor masa muscular esquelética apendicular y menor grosor del cuádriceps (Eje Y 8.5 mm (DE 2.4) vs 11.8 mm (DE 3.3) p = 0.002). Los pacientes con riesgo de sarcopenia tenían niveles más bajos de fósforo y mayores de proteína C reactiva (PCR). La capacidad predictiva de la ecografía para clasificar a los pacientes con riesgo de sarcopenia fue de AUC 0.78 (0.64−0.93) para Eje Y, similar a las obtenidas con el LTI y AF de la bioimpedancia.
ConclusionesEl riesgo de sarcopenia es altamente prevalente en DP y se relaciona con la edad, comorbilidad desnutrición e inflamación de los pacientes. La ecografía es una herramienta accesible, segura, de bajo coste y fácil de utilizar a pie de cama. Este método nos sirve para cuantificar la masa muscular y valorar la calidad de la misma. Proponemos el espesor del músculo RAC (Eje Y) como el mejor parámetro complementario, dada su buena correlación con la bioimpedancia y su valor diagnóstico de riesgo sarcopénico. Nuestra experiencia servirá de base a futuros estudios para definir puntos de corte específicos en DP y diseñar protocolos de seguimiento e intervención.
The term sarcopenia defines a syndrome characterized by loss of muscle mass and decreased strength associated with aging, described in 1989.1 Senescence contributes to the development of this syndrome. It has been shown that from the fourth decade of life onwards, skeletal muscle begins to decline and is one of the most important causes of functional deterioration and loss of independence. This process is influenced by extrinsic factors, such as poor nutrition and a sedentary lifestyle, and also by intrinsic factors, such as hormonal changes, inflammation, loss of muscle proteins, oxidative stress and alteration of factors that regulate myogenesis.2
This syndrome can be seen also in less elderly people, with chronic diseases and inflammation leading to malnutrition, due to malabsorption, reduced intake or low physical activity.3 In certain patient profiles it is very difficult to distinguish whether the cause of sarcopenia is aging per se or the associated disease; this is the case of patients with chronic kidney disease (CKD). These patients are dealing with a long-lived population with associated comorbidity and, many cases have a maintained state of inflammation.
In contrast to sarcopenia associated with aging, which progresses slowly and is due to age-related hormonal and metabolic changes, sarcopenia in CKD is accelerated and multifactorial.4 Multiple processes converge in CKD, such as metabolic acidosis, insulin resistance, vitamin D deficiency and increased oxidative stress, as well as chronic inflammation with decreased caloric and protein intake, which leads to increased protein catabolism.5 In addition, there are other contributing factos such as: dialysis technique, age, hormonal imbalance and very restrictive diets, which decrease protein synthesis and contribute to a negative protein balance.6
It is important to establish an early diagnosis of sarcopenia due to its negative impact on quality of life (QoL), hospitalizations and adverse events.5,7,8 Its prevalence ranges from 1.5% to 68% of dialysis patients. This wide range is explained by the lack of consensus about the definition of sarcopenia in CKD patients.7,9 and the variability of the diagnostic tools available and the protocols used by each center.10 The anthropometric parameters regularly used, such as weight, height or body mass index (BMI), do not reflect sarcopenia correctly, since the skeletal muscle mass lost is replaced by fat and the total weight is maintained through a process known as myostasis11 which is seen in sarcopenic obesity. This situation has the capacity to alter muscle functionality and constitutes a powerful predictor of disability and mortality.12
The consensus review of the European Working Group on Sarcopenia in Older People (EWGSOP2) published in 2019, recommends a practical approach to the diagnosis of sarcopenia. It proposes screening for sarcopenia by assessing handgrip strength to detect “dynapenia” (decreased muscle strength)6 and classifying these individuals as “at risk for sarcopenia”
This information itself should lead us to propose a diagnostic/corrective intervention, followed by an assessment of total muscle mass to confirm the diagnosis of sarcopenia.
The reference method recommended by this group for the assessment of muscle mass is DEXA (dual energy X-ray absorptiometry), although the reality is that it not available in most nutrition units and its use is limited to research protocols, so multifrequency bioimpedance is chosen as an alternative procedure.
Bioimpedance is a widespread tool in our CKD and dialysis patient care setting, which is presently positioned as the reference standard for overhydration and nutrition. With this technique it is not possible to directly measure muscle mass, since what it estimates is the lean mass index, which contains muscle, skin, bones and viscera. Furthermore, it has limitations related with the patient's body structure (as in extreme cases of obesity or malnutrition), temperature or even a state of overhydration, which can alter the measurements.13–15 In addition, there are some contraindications that limit its use: the use of some types of implantable cardiac devices, certain metallic prostheses and pregnancy. For this reason, endocrinology and geriatrics units have begun to look for new tools for the direct measurement of muscle mass such as ultrasound, whose main advantage is its safety, availability in nephrology, low cost of consumables and portability, which allows bedside assessment (POCUS), which means that its use is becoming increasingly widespread.
Given this situation of relevance of sarcopenia as a prognostic factor, but without specific evidence in peritoneal dialysis (PD) and lack of recommendations in clinical guidelines, it was decided to implement a protocol for the systematic evaluation of sarcopenia for all patients in our PD program.
MethodsAn observational study was conducted in incident (one week after starting PD) and prevalent patients of the peritoneal dialysis unit of the “Hospital Universitario Puerta de Hierro Majadahonda” between January and October 2023. Patients included had to be clinical stable (no admissions in the last 3 months, no active infectious or neoplastic processes). Clinical data, etiology, technique, efficacy and laboratory data were collected by nephrologists and nurses in a structured electronic medical record. In addition, functional performance and frailty data were collected, along with muscle mass and risk of malnutrition. This study was approved by the Research Drug Ethics Committee of the Hospital Universitario Puerta de Hierro (N. 16/2023).
- —
Muscle strength was assessed by dynamometry (kg), with a CAMRY dynamometer model: EH101, calculating the greatest of 3 measurements of hand grip strength in the dominant limb. Since we do not have specific guidelines for CKD and we know that these are patients with a state of chronic inflammation and accelerated senescence, we assumed the recommendations of the EWGSOP216, considering the limit of decreased muscle strength in palmar grip <27 kg in males and <16 kg in females. Patients below the cutoff point were classified as being at risk of sarcopenia.
- —
Frailty was assessed using the FRAIL scale, which consists of 5 questions that correspond to 5 domains: fatigability, endurance, ambulation, comorbidity, and unintentional weight loss.17 Patients were considered frail with a score equal to or greater than 3 points.
- —
Functional performance was measured with the Short physical performance battery (SPPB).18 which consists in the evaluation of 3 simple exercises performed in a specific order to avoid fatigue and ensure reproducibility.
- 1
Balance test in 3 positions: feet together, semi-tandem and tandem.
- 2
Gait speed test in 4 m
- 3
Test of rising from the chair 5 times without supporting the arms.
- 1
The total SPPB score results from the sum of the 3 tests and ranges from 0 to 12. Thus patients are classified according to their score: from 0 (severe disability) to 12 (robust patient).
The malnutrition inflammation scale (MIS) was used to assess the risk of malnutrition in our patients: the normal range is ≤3; mild 3–5; moderate 6–8 and severe ≥8.
Measurement of body composition was performed using multifrequency bioimpedance equipment (BCM ® Fresenius Medical Care, Bad Homburg, Germany), following the standard protocol and the manufacturer's recommendations. Infomation was collected on weight, height, BMI, overhydration status (OH), fat tissue index (FTI), lean tissue index (LTI), total body water and phase angle (PA) at 50 kHz. Appendicular skeletal muscle mass (ASM) was estimated by bioimpedance using Lin’s formula: ASM (kg) = −1.838 + 0.395 × total body water (L) + 0.105 × body weight (kg) + 1.231 × male sex – 0.026 × age (years).19 This result was divided by height (m) to calculate the ASM index (ASMI). Diminished muscle mass is considered when it is below 5.5 kg/m2 in women and 7 kg/m2 in men, as published by EWGSOP2.
Muscle mass was measured by ultrasound using Digital Color Doppler Ultrasound equipment (SonoScape, China), following previously published protocols.20,21 The measurement was performed in B mode and with a linear probe (6−12 MHz), in the lower third of the imaginary line between the anterosuperior iliac spine and the patella of the dominant leg, in supine decubitus, with the muscle relaxed and with the transducer perpendicular to the longitudinal axis. We proceeded to measure the thickness of the rectus femoris muscle (RFM) X-axis/Y-axis, the area and supramuscular fat, as detailed in Fig. 1. To avoid errors in the measurements, we used the mean of 3 consecutive measurements from the same observer. These measurements were adjusted for height (Y axis /[height]2) and patient body surface area (Y-axis/BSA). For the calculation of body surface area we used the Du Bois and Du Bois formula.22
 and supramuscular fat. GSM: Supramuscular fat.")
Data were recorded in a database designed for this purpose. Continuous variables are shown as mean and standard deviation (SD) or median and interquartile range (IQR), according to their distribution. Categorical variables are shown as frequencies or percentages. Comparisons between groups were performed with Student’s t or Mann-Whitney or χ2, depending on the nature of the variables. Correlation analysis for quantitative variables was performed with Pearson’s test. To estimate the capacity of ultrasound to discriminate patients at risk of sarcopenia, we calculated ROC (receiver operating characteristic) curves, using as an indicator the area under the curve (AUC) and its 95% confidence interval. A value of p < 0.05 was considered to be significant. The analyses were performed with the statistical package Stata v. 16.0 (Stata Statistical Software: Release 16, 2019. College Station, TX: StataCorp LLC).
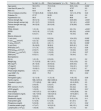
ResultsBaseline characteristics of the patientsThirty-eight patients were evaluated, mean age of 65.4 years (SD 14.9), 65.8% were males who had been on PD for a median of 14.1 months IQR [1.3−37.6]. A 44.7% were on hemodialysis, 5.3% had a non-renal solid organ transplant, and 5.3% had a non-functioning renal transplant. A 47.37% were classified as pre-fragile and 34.2% as frail. The prevalence of comorbidities was: 86.8% had hypertension, 36.8% diabetes, 36.8% had history of atrial fibrillation and 31.6% had ischemic heart disease. These characteristics are similar to those previously described by the GCDP.23 The rest of the baseline characteristics, as well as the analytical data and values obtained by bioimpedance and ultrasound of the entire sample, are summarized in Table 1. In the population studied 52.6% had decreased LTI and 23.7% decreased FTI; this is according to the values proposed by the manufacturer adjusted for age and sex, with the mean phase angle of 4.5 (SD 1.1). Appendicular skeletal muscle mass was estimated from the data obtained by bioimpedance with Lin's formula and, as indicated in EWGSOP2, 55.3% had a sex-adjusted decreased appendicular muscle mass index, with a mean of 5.7 kg/m2 (SD 1.4) in women and 6.7 kg/m2 (SD 1.0) in men. In addition, it was found a trend toward a higher risk of sarcopenia in diabetic patients.
Baseline characteristics of patients classified by risk of sarcopenia.
| No riska (n = 22) | Risk of sarcopeniaa (n = 16) | Total (n = 38) | p | |
|---|---|---|---|---|
| Age (years) | 59.6 (151) | 73.5 (10.8) | 65.5 (14.9) | 0.002* |
| Less than 65 years (%) | 54.5 | 37.5 | 47.37 | 0.3 |
| Male (%) | 63.6 | 68.7 | 65.8 | 0.7 |
| Time on dialysis (months) | 17.0 [3.9−35.2] | 8.3 [0.6−38.2] | 14.1 [1.3−37.6] | 0.40 |
| Diabetes (%) | 27.27 | 50.00 | 36.8 | 0.2 |
| Hypertension (%) | 90.9 | 81.2 | 86.8 | 0.4 |
| Palmar strength (kg) | 30.0 (7.4) | 17.8 (5.2) | 24.9 (8.9) | <0.001 |
| Palmar strength women (kg) | 23.1 (3.7) | 12.8 (2.3) | 19.1 (6.1) | <0.001 |
| Palmar strength men (kg) | 34.0 (5.9) | 20.0 (4.6) | 27.8 (8.8) | <0.001 |
| SCALES | ||||
| FRAIL SCALE. | 1.3 (1.2) | 2.9 (1.5) | 2.0 (1.5) | <0.001* |
| SPPB | 10.6 (1.8) | 5.7 (3.5) | 8.5 (3.6) | <0.001* |
| MIS | 6.3 (4.1) | 9 (4.4) | 7.5 (4.5) | 0.06 |
| Muscle ultrasound | ||||
| Y axis (mm) | 11.8 (3.3) | 8.5 (2.4) | 10.4 (3.3) | 0.002* |
| Y-axis height (mm/m2) | 4.2 (1.2) | 3.0 (0.8) | 3.7 (1.2) | 0.002* |
| Y-axisbs (mm/m2) | 6.6 (1.9) | 4.8 (1.1) | 5.8 (1.8) | 0.002* |
| X-axis (mm) | 35.4 (8.2) | 38 (8.2) | 36.5 (8.1) | 0.30 |
| RFM area (cm2) | 3.7 (1.4) | 2.9 (0.9) | 3.4 (1.2) | 0.06 |
| RFM areaBSA (cm2/m2) | 2.0 (0.7) | 1.7 (0.4) | 1.9 (0.6) | 0.07 |
| RFM area height (cm2/m2) | 1.3 (0.4) | 1.0 (0.3) | 1.1 (0.4) | 0.07 |
| GSM (mm) | 8.5 (5.1) | 7.1 (3.0) | 7.9 (4.4) | 0.3 |
| Bioimpedance | ||||
| OH (L) | 1.6 (1.5) | 2.5 (2.0) | 2.0 (1.7) | 0.2 |
| Weight (kg) | 71.3 (15.2) | 68.1 (16.1) | 70.0 (15.5) | 0.5 |
| IMC (kg/m2) | 25.1 (5.5) | 23.9 (5.2) | 24.6 (5.3) | 0.5 |
| LTI (kg/m2) | 13.4 (3.1) | 10.9 (2.4) | 12.4 (3.1) | 0.01* |
| FTI (kg/m2) | 10.9 (6.1) | 11.9 (6.3) | 11.3 (6.1) | 0.7 |
| Phase angle (degrees). | 4.9 (1.1) | 3.8 (0.7) | 4.5 (1.1) | 0.008* |
| Low ASMIa (%) | 40.9 | 75.0 | 55.3 | 0.04* |
| Laboratory | ||||
| Hemoglobin (g/dL) | 12.1 (1.6) | 11.3 (1.6) | 11.8 (1.6) | 0.09 |
| Ferritin (ng/mL) | 598.4 (310.0) | 852.5 (933.3) | 705.4 (651.0) | 0.3 |
| Transferrin (ng/mL) | 177.0 (23.2) | 186.1 (48.0) | 181.0 (35.5) | 0.5 |
| Kt/V | 2.6 (0.5) | 2.3 (0.7) | 2.5 (0.6) | 0.2 |
| RRF (ml/min/1.73 m2) | 5.2 (2.8) | 5.5 (5.8) | 5.3 (4.2) | 0.8 |
| nPCR (g/kg/D) | 1.0 (0.2) | 0.9 (0.1) | 0.9 (0.2) | 0.01* |
| Urea (mg/dl) | 116.5 (15.1) | 121.9 (36.1) | 119.0 (25.8) | 0.6 |
| Total cholesterol (mg/dl). | 134.7 (19.6) | 140.6 (37.2) | 137.0 (28.1) | 0.6 |
| Albumin (g/dl) | 3.8 (0.3) | 3.6 (0.5) | 3.7 (0.4) | 0.09 |
| Prealbumin (mg/dl) | 33.7 (7.4) | 27.3 (13.9) | 31.0 (11.0) | 0.11 |
| Total protein (g/dl) | 6.1 (0.6) | 6.1 (0.9) | 6.1 (0.7) | 0.8 |
| Phosphorus (mg/dl) | 5.0 (0.9) | 4.3 (1.3) | 4.7 (1.1) | 0.04* |
| C-reactive protein (mg/l) | 4.7 (4.7) | 16.3 (21.2) | 9.6 (15.1) | 0.02* |
| Lymphocytes (×103/μL) | 1.6 (0.6) | 1.9 (2.3) | 1.7 (1.5) | 0.5 |
Data are shown as mean (standard deviation), median [interquartile range], or number and percentage.
RRF: residual renal function; FTI: fat tissue index; GSM: thigh supramuscular fat; HF: heart failure; ASMI: appendicular skeletal muscle mass index; LTI: lean tissue index; MIS: Malnutrition Inflammation Score; nPCR: normalized protein catabolism rate; OH: relative overhydration; RFM: rectus femorismuscle; SPPB: Short physical performance battery.
With respct to palmar strength, all patients were able to perform the measurement. Overall, 42.1% of the patients presented decreased palmar strength adjusted for sex and were classified as patients at risk of sarcopenia. The mean value was 19.1 kg (SD 6.1) in women and 27.8 kg (SD 8.8) in men, with 44% of men and 38.5% of women having decreased palmar strength. We observed that patients with decreased handgrip were older, although 37.5% were younger than 65 years. Likewise it was associated with greater comorbidity, worse nutrition by MIS scale and worse frailty and functional capacity scores by FRAIL and SPPB scales. Similarly, they tended to have lower muscle mass measured by ultrasound and lower lean mass estimated by bioimpedance. In the risk group, 75% of the patients had a decreased ASMI, with significant statistical differences with respect to the non-risk group. These patients are those classified as sarcopenic (decreased handgrip + decreased ASMI), which in our cohort accounted for 31.6%. With regard to hydration parameters, a tendency to overhydration was observed in the at-risk group.
Regarding analytical parameters, patients at risk of sarcopenia had lower phosphorus levels, with a tendency to lower albumin and prealbumin levels, as surrogate values of malnutrition (Table 1). However in this group of patients there is a negative correlation between of plasma albumin levels and overhydration (r2 = –0.26; p = 0.046), which could justify the reduction of Albumin. Similarly, it should be noted that patients at risk of sarcopenia present higher levels of C-reactive protein, with no apparent correlation with overhydration.
Ultrasound measurements of the rectus femoris muscle (RFM) are summarized in Table 1 and it is emphasized a significant reduction in thickness (Y) without changes in the horizontal axis (X), with a tendency to greater supramuscular fat. The parameters corrected for patient height and body surface area behaved in the same manner.
The parameters of ultrasound measurements with the best discriminative power were the Y-axis height (AUC 0.78; 95% CI 0.63−0.93) and Y-axis (AUC 0.78; 95% CI 0.64−0.93) (Fig. 2).

The discriminative power of the estimates obtained by bioimpedance (AF and LTI) for risk of sarcopenia by handgrip presented similar ROC curves, with values of 0.81 and 0.75, respectively.
Assessment of nutritional status according to the MIS scaleThe mean MIS score was 7.4 (SD 4.4), 31.6% of patients were at severe risk of malnutrition (MIS > 8) and 34.2% at moderate risk (MIS 6–8). There were no significant differences when stratifying by sex (severe risk in women 30.8% and of men 32.0%; p = 0.6).
The phase angle decreases with the progression risk of MIS malnutrition showing a significant linear trend (5.0 [SD 1.1] vs. 4.6 [SD 1.2] vs. 3.7 [SD 0.7]; p = 0.03). Measurement of supramuscular fat decreased as MIS-measured risk increased (10.5 [SD 5.7] vs. 6.9 [SD 3.3] vs. 6.3 [SD 2.5]; p = 0.03). No significant differences were found in the rest of parameters measured by ultrasound.
Correlation of nutritional, functional parameters and ultrasound dataNo significant relationship was observed between values of albumin, total protein, vitamin D and BMI with ultrasound parameters; only prealbumin was positively correlated with the ultrasound measurement of quadriceps thickness Y-axis showing r2 = 0.11 (p = 0.04).
The correlation analysis of the values obtained by ultrasound as the Y-axis of the RFM has an adequate correlation with the phase angle, something similar happens with the Y-axis corrected for body surface and height (Fig. 3). It is important to emphasize that the ultrasound assessment of supramuscular fat showed an adequate correlation with FTI (r2 = –0.51; p ≤ 0.001) and was negative with LTI (r2 = –0.13; p = 0.02).

If patients are divided into frail and non-frail according to the FRAIL scale, the frail patients have a lower quadriceps thickness than the non-frail (Y-axis: 8.8 mm [SD 3.3] vs. 11.3 mm [SD 3.1]); p = 0.03). If the analysis is made according to their functional status measured by SPPB, patients with a severe limitation (SPPB ≤ 6) present a lower Y-axis than the rest (7.82 mm [SD 2.6] vs 11.5 mm, [SD 3.0]; p = 0.04.
DiscussionWe have observed that almost half of our patients on PD present palmar strength compatible with risk of sarcopenia, that it is associated with age, cardiovascular comorbidity, and frailty assessed by scales and malnutrition/inflammation. However, there is a considerable percentage of patients younger than 65 years who have decreased muscle strength, supporting the theory thath these patients have accelerated senescence with early sarcopenia. We know that there is a nonlinear relationship between chronological age and palmar strength from infancy to senescence,24 but we do not know specific cut-off points for a population with renal disease.
Previous studies in the CKD popultion describe a high prevalence of sarcopenia that is associated with worse clinical outcomes, with increased disability, frailty and mortality. In our study, 31.6% of the patients were classified as sarcopenic (decreased handgrip + ASMI reduced), this figure is somewhat higher than those published in this specific population, but we know that studies on the prevalence of sarcopenia in dialysis patients yield highly variable results, depending on the populations, the methods used to measure muscle mass, and the diagnostic criteria.10
In a meta-analysis analyzing the prevalence of sarcopenia in CKD, it was observed that 46.5% of patients on PD were at risk of sarcopenia, data similar to the observed in our population. Similarly, in such study it was observed that 51.5% of patients on hemodialysis were at risk, a percentage that decreases to 19.6% in non dialysis CKD patients.25 Therefore, it is essential the prevention and early diagnosis of this syndrome.1,26 In this sense, it seems reasonable that an inexpensive, innocuous, accessible and easily reproducible technique, such as ultrasound, should be routinely used by trained specialists.
Presently, we now know that weight, height and BMI, parameters traditionally used in nutritional assessment, are not sensitive enough to detect early changes in body composition.27 The most widespread method for diagnosing sarcopenia in nephrology is bioimpedance, which estimates the index of lean mass, fat mass and hydration status, from which, using formulas, it is possible to estimate appendicular skeletal muscle mass. To define a decrease in muscle mass, it is necessary to calculate the ASMI, information obtained by DEXA, but, given its high cost and lack of availability, from the clinical point of view, the guidelines recommend the use of formulas based on bioimpedance. We have opted for Lin's formula, which has been validated for use in patients in hemodialysis, and has a high predictive power for the diagnosis of sarcopenia.19
It is important to keep in mind that bioimpedance measurements can be affected by extreme hydration situations or changes in body geometry. For example In the case of PD patients, a full abdomen causes an overestimation of LTI.28 Although the phase angle has been shown to be the best marker of malnutrition, and it also reflects properties of cell membranes and the balance between intracellular and extracellular water, it can vary physiologically depending on age, sex, BMI, race and in the case of extreme values of body composition.29,30 In other studies performed in PD patients with the aim of assessing the possibility of using bioimpedance as a substitute for the overall subjective assessment of protein-energy wasting, it has been found that the sensitivity and specificity of bioimpedance to distinguish malnourished patients was low.31 In addition, although a bioimpedance measurement requires a similar time to that of ultrasound, it has certain limitations, such as the exclusion of certain patients (prostheses or pacemakers) and the expenditure of consumables for each measurement.
In this line, the European Working Group on Sarcopenia (EWGSOP2) identifies ultrasound as a potential tool to assess muscle mass with the advantage of simultaneously performing a quantitative and qualitative assessment.16 There are already studies that validate its capacity to estimate muscle mass by comparing it with DEXA, magnetic resonance imaging and computed tomography.32,33
Ultrasound has been postulated as an affordable and harmless tool to assess body composition parameters, so its use is spreading rapidly in specialties such as nephrology. The association of bedside ultrasound with other recognized tools, such as bioimpedance, allows for a better assessment of our patients. However, it is necessary to define the specific cut-off points for our population, the most efficient follow-up plan and the predictive value of these parameters on clinical episodes.
The RFM ultrasound is a harmless and affordable technique that correlates well with classic impedance estimators (LTI and phase angle) and has the same predictive value of sarcopenia risk. There are few previous published studies on muscle mass ultrasound in patients on dialysis or with kidney disease. Souza's group compared ultrasound with tomography and found a difference of 3.97 mm, showing a strong correlation between both methods in pre-dialysis patients.32 In the hemodialysis population, it has been shown that ultrasound of the rectus femoris of the quadriceps discriminates patients with protein wasting syndrome based on muscle thickness and area.34 Despite being an emerging and attractive technique due to its ease of use, we currently lack defined cut-off points and protocols, which makes it difficult to apply in daily clinical practice.
We propose the value of the RFM thickness (Y axis) as the most relevant parameter for monitoring the estimation of muscle mass. The loss of RFM mass estimated by area is significant, but the Y axis is more discriminating, since the sarcopenic muscle is more flaccid and, although it maintains the X axis, it loses thickness and increases supramuscular fat. The Y axis analyses are confirmed in the indices corrected by height or body surface of the patient, necessary for its standardization.
Our work describes for the first time the usefulness of ultrasound to assess muscle mass in patients on PD. The SARCUS working group proposes to protocolize the different parameters to establish more homogeneous measures that allow data to be analyzed in a more universal manner.35
In our analysis, we observed that the evaluation by ultrasound of the quadriceps muscle proved to be a good indicator of the patient's total muscle mass, with a good correlation with lean mass measured by bioimpedance and with muscle strength assessed by handgrip. It is this force, measured by dynamometry, what is recommended by the EWGSOP2 group as a practical tool for defining interventions, since this parameter is independently associated with adverse outcomes in the general population, such as prolonged hospital admissions, poor functional performance, decreased quality of life and increased mortality.36 Dynapenia (reduction in strength measured by handgrip) and sarcopenia (loss of strength and muscle mass) are not identical concepts, although the practical criteria of EWGSOP2 indicate dynapenia as the most accessible parameter that identifies the risk and, by itself, should prompt us to intervene and protect the patient.
We also observed that patients classified as frail presented a significantly reduced quadriceps muscle mass measured by ultrasound as compared to non-frail patients. This is also maintained when analyzing the thickness of the quadriceps (Y axis) according to its functional capacity measured by SPPB.
It should be noted that the measurement of supramuscular fat in the thigh correlated adequately with fat parameters measured by bioimpedance, so that, in addition to measuring muscle mass, we can have a reference for overall body fat.
It should be kept in mind that there is an adequate relationship between the values obtained by ultrasound and by the multiple tools currently used to assess the patient both from a nutritional point of view and from an overall comprehensive approach. Likewise, we have shown that ultrasound has a high predictive capacity to discriminate patients at risk of sarcopenia. It must be taken into account that ultrasound alone measures one point of the patient, therefore it is necessary to use ultrasound together with other tools for an adequate assessment of body composition.
Our study is limited by the fact that it was perfomed in a single center and by the sample size which is common in Spain, where PD units have an average of 20 patients and stay on PD for only 2 years. In addition, it is a one-off measurement that does not take into account the evolution of the technique, although the definition of a measurement protocol carried out by a single observer reinforces its internal validity. It is possible that our local reality, with profiles of patients coming from previous haemodialysis, explains part of our findings, but we cannot undertake sub-analyses stratified by groups. It is necessary to promote multicentre studies to improve statistical power and reduce variability in order to define cut-off points for the diagnostic tests of sarcopenia being proposed here and to be used in patients with a reduction of renal function.
ConclusionsThe risk of sarcopenia is highly prevalent in patients on PD and is related to age, comorbidities, malnutrition and inflammation. Ultrasound is proposed as an accessible, safe, low-cost and easy-to-use bedside tool in all areas of clinical medicine, expanding the assessment of hydration and blood volume status (POCUS) with the measurement of muscle parameters. We propose using the thickness of the RFM (Y axis) as the best complementary parameter, given its good correlation with the phase angle and its diagnostic value of sarcopenic risk, comparable to that of classic impedance estimators.
We believe that a multidisciplinary approach that encompasses different diagnostic techniques of sarcopenia will achieve a more complete assessment of our patients in PD units. Our experience can be the basis for future studies to define specific cut-off points in patients on PD and design apropriate monitoring and intervention protocols on sarcopenia and frailty in the population of patients with kidney disease.
AuthorshipAll authors meet the criteria for authorship proposed by the International Committee of Medical Journal Editors (ICMJE). They are responsible of the work and have approved this version.
FundingThis study has been funded by Unrestricted Grants from FRIAT, Nipro and ViforSCL through the Fundación Madrileña de Nefrología, as well as the Instituto de Investigación Puerta de Hierro Segovia de Arana (IDIPHISA). It has been partially funded through RICORSRD21/0005 and RD24/0004.
The authors would like to thank the Madrid Nephrology Foundation and the GCDP collaborative group for their support in the preparation of the present manuscript.


