
Increased blood pressure variability (BPV) is associated with higher cardiovascular risk. The association between BPV and fluid status in hypertensive patients has not been investigated so far. The aim of the present study was to determine the contribution of fluid balance to BPV and impact on endothelial and cardiac functions among primary hypertensive patients.
MethodsThis is a prospective interventional study conducted in primary hypertensive patients with one-year follow-up. Volume status measurements by a body composition monitor, ambulatory blood pressure (BP) monitoring, echocardiographic and carotid intima-media thickness (CIMT) measurements were performed at enrollment and at twelfth. Patients in one of the two groups were kept negative hydrated during trial with diuretic treatment. Patients in other group were positively hydrated (hypervolemic) at enrollment, antihypertensive drugs other than diuretics (vasodilator agents) were added or intensified according to the BP monitoring. Average real variability (ARV) index was used for establishing the prognostic significance of BPV.
ResultsThe study population consisted of 50 patients with a mean age of 54.5±8.8 years. At the end of one-year follow-up, patients in negative hydrated group were found to have significantly lower BP, CIMT, left ventricle mass index (LVMI) and systolic and diastolic ARV. More weight gain and higher systolic BP were major risk factors of high systolic ARV. Patients who have improvement in CIMT and LVMI were considered as target organ damage (TOD) recovery present. In negatively hydrated group, TOD significantly reduced during trial. In patients who have TOD recovery, BPV significantly more reduced like systolic and diastolic BP. Significant risk factors associated with the presence of TOD were 24h systolic BP and daytime and night time diastolic ARV and night time diastolic BP.
ConclusionAddition of diuretic to established treatment or intensified diuretic treatment and keeping patients in negative hydration status resulted in reduction in BPV at twelfth month of follow-up. More weight gain and higher systolic BP are major risk factors of high systolic ARV, but not hypervolemia. BPV, especially diastolic ARV, was significantly associated with TOD.
El aumento en la variabilidad en la presión arterial (VPA) se asocia con un mayor riesgo cardiovascular. Hasta el momento no se ha investigado la asociación entre la VPA y el estado hidroelectrolítico en pacientes hipertensos. El objetivo del presente estudio fue determinar la contribución del equilibrio hidroelectrolítico a la VPA y el impacto en las funciones endoteliales y cardíacas entre los pacientes con hipertensión primaria.
MétodosSe trata de un estudio intervencionista prospectivo realizado en pacientes con hipertensión primaria con seguimiento de un año. Se llevaron a cabo mediciones del estado volumétrico mediante un monitor de composición corporal, monitorización de presión arterial (PA) ambulatoria, mediciones ecocardiográficas y del grosor de la íntima-media de la carótida (GIMC) en la inclusión y en el duodécimo mes. En los pacientes de uno de los 2 grupos se mantuvo hidratación negativa durante el ensayo con tratamiento diurético. Los pacientes de otro grupo presentaban hidratación positiva (hipervolemia) en la inclusión, y se añadieron o se intensificaron los fármacos antihipertensivos distintos de los diuréticos (vasodilatadores) en función de la monitorización de la PA. Se utilizó el índice de variabilidad real promedio (VRP) para establecer la significación pronóstica de la VPA.
ResultadosLa población del estudio consistió en 50 pacientes con una media de edad de 54,5±8,8 años. Al final del seguimiento, al cabo de un año, los pacientes del grupo con hidratación negativa presentaron una PA, un GIMC, un índice de masa del ventrículo izquierdo (IMVI) y una VRP sistólica y diastólica significativamente menores. El mayor aumento de peso y una PA sistólica superior fueron factores de riesgo importantes de la VRP sistólica alta. Los pacientes con mejoras en el GIMC y el IMVI se consideraron pacientes con recuperación del daño de órganos diana (DOD). En el grupo con hidratación negativa, el DOD se redujo significativamente durante el ensayo. En los pacientes con recuperación del DOD, la VPA se redujo significativamente en mayor medida, al igual que la PA sistólica y diastólica. Los factores de riesgo significativos asociados con la presencia de DOC fueron la PA sistólica de 24h, la VPA diastólica diurna y nocturna y la PA diastólica nocturna.
ConclusiónLa adición de diuréticos al tratamiento establecido o la intensificación del tratamiento diurético y el mantenimiento de los pacientes en estado de hidratación negativa provocó la reducción de la VPA en el duodécimo mes de seguimiento. El mayor aumento de peso y una PA sistólica superior son factores de riesgo importantes de VRP sistólica alta, pero no así la hipervolemia. La VPA, en especial la VPA diastólica se asoció de forma significativa al DOD.
Hypertension causes development of organ damage over time and it is associated with an increased risk of cardiovascular and cerebrovascular diseases, and renal failure. It is well known that fluid retention plays a role in the pathogenesis of primary hypertension. Furthermore, fluid retention is known to adversely affect the cardiovascular system, independent of the blood pressure level.1
Blood pressure (BP) fluctuations are a result of the interplay between external environmental stimuli, vascular environment and biological autonomic circulatory regulation.2 Spontaneous variation in blood pressure based on 24-h ambulatory blood pressure monitoring (ABPM) is referred to as blood pressure variability (BPV)3,4 and fluctuation during a 24-h period is referred to as short-term BPV. Average real variability (ARV) is an index that also averages the absolute differences of consecutive measurements.5,6 The ARV index is sensitive to the individual BP measurement order and the relatively low sampling frequency of ABPM and is not affected by the mean BP level.5,7
Increased short-term BPV predicts organ damage8,9 and is associated with an increased risk of cardiovascular events.10–16 The mechanism of this relationship is not clear. Ozkayar et al. found that primary hypertensive patients with high dietary salt intake had high BPV17 and this relationship was independent of the blood pressure level. This conclusion suggests that hypervolemia may also be related to BPV. However, the association between BPV assessed by ABPM and fluid status measured by bioimpedance spectroscopy method in hypertensive patients has not been investigated so far and the relationship between them is not clearly known. For these reasons, in the performed study, we aimed (1) to establish the impact of hydration status on BPV; (2) to investigate potential effect of diuretics on BPV; (3) to examine the potential role of BPV in endothelial and cardiac functions among primary hypertensive patients. It is the first study to evaluate cardiac and endothelial functions along with volume status and BPV among primary hypertensives with no kidney failure. Clarifying the relation of body fluid and BPV in primary hypertensive population could offer specific therapeutic approaches with remarkable impact on this affection.
MethodsStudy design and participantsThis is a prospective study in patients admitted to the nephrology, internal medicine, and cardiology clinics of a tertiary research hospital between May and August 2015, who were on follow-up with primary hypertension diagnosis. Patients were followed until August 2016. All hypertensive patients aged over 18 years included in the study regardless of gender. Patients with glomerular filtration rate (GFR) below 60ml/min/1.73m2, pregnancy, significant psychiatric and mental problems, heart failure, nephrotic syndrome, chronic inflammatory diseases, diabetes and malignancies; patients who did not give consent; who are bedridden or are in need of care; and those with low performance scores were excluded from the study. Patients who had clinical clues suggesting the possible presence of secondary hypertension were also excluded from the study. We chose to use a highly standard method such as ambulatory blood pressure measurement to analysis hypertension. Ambulatory blood pressure monitoring provides an accurate profile of blood pressure fluctuations over a 24-h period and control for the “white coat effect”, and may show the paroxysmal rise in blood pressure associated with pheochromocytoma.
Body mass index (BMI) was calculated as weight (kg)/height (m2). This study was performed in accordance with the Helsinki Declaration and approved by local ethics committee. We obtained written informed consent from all patients.
Follow-up of patients and antihypertensive treatment strategyAt enrollment, volume status measurements were performed by a body composition monitor (BCM), and then, the patients were put on ambulatory blood pressure monitoring for 24h. Then, echocardiographic assessments were completed in the cardiology clinic; and carotid intima-media thickness (CIMT) measurements were done by a radiologist. Patients who had negative overhydration (OH) value (OH value≤0) (normovolemic) at enrollment received diuretic treatment as an antihypertensive drug during trial. These patients were either receiving diuretic or diuretic newly added to their antihypertensive treatments and dose of diuretics were increased or decreased according to bioimpedance spectroscopy measurements. Therefore, we tried to keep the patients negative hydrated during trial in this group. In patients who had positive OH value (OH value>0) (hypervolemic) at enrollment, antihypertensive drugs other than diuretics (vasodilator agents) were added or intensified according to the blood pressure monitoring. If these patients had already received diuretics before study enrollment, diuretics did not cease. All subjects were followed for one year and they returned at least monthly for additional blood pressure measurements and medication (diuretic and other antihypertensives) titration during this period. Thus, patients with a normovolemic status at study entry remained normovolemic during the 1-year follow up period, while those with a hypervolemic status remained hypervolemic during the same period. Subjects were excluded from participation if they were unable to return monthly during the trial or if the physician identified noncompliance with medications.
Ambulatory blood pressure monitoring, echocardiographic measurements and CIMT measurements were repeated at twelfth month after enrollment. Fluid status of patients was measured four times during the study period; at enrollment, fourth, eighth, and twelfth month after enrollment. While analyzing patient data at the end of the study, we divided patients into two groups according to their OH values in four different bioimpedance spectroscopy measurements during study period. The negative hydrated group consisted of patients with two or more negative OH values and the positive hydrated group consisted of patients with a positive OH value in the three or four measurements.
Body composition monitoringThe fluid status was assessed by a bioimpedance spectroscopy method, using the BCM (BCM, Fresenius Medical Care, GmbH, Germany) and was represented by the level of OH. BCM device was connected with four disposable electrodes placed on upper and lower limbs of the patients. Bioimpedance analysis was performed in a standard manner and measurements were performed in supine position by a trained medical doctor. Gender, height (cm), body weight (kg), and arterial blood pressure (systolic and diastolic mmHg) information were entered for each patient. Using the non-invasive bioimpedance method, hydration status, urea distribution volume, total body fluid, intracellular fluid, intercellular fluid, lean tissue index, fatty tissue index, and body cell mass were measured. BCM has been validated extensively against all available gold standard methods in the general populations.18 Fluid status of patients was measured four times during the study period at enrollment, fourth, eighth, and twelfth month after enrollment. Patients who had the level of OH≤0L were considered negatively hydrated (normovolemic) and patients who had the level of OH>0L were considered positively hydrated (hypervolemic).
Ambulatory blood pressure monitoringThe 24-hour blood pressure monitoring of the patients was performed with Mobil-O-Graph NG and Mobil-O-Graph PWA (I.E. M. GmbH, Stolberg, Germany) ambulatory blood pressure devices. The device was attached to the patient's less dominant arm. Measurements were performed at intervals of 15–60min throughout the whole monitoring period. The device was programmed to record the BP of the patient with 30–60min intervals while asleep and with 15–30min intervals while awake. When the readings exceeded at least 70% of the total readings programmed for the testing period, the recording was considered valid and satisfactory. The patients who participated in the study were advised to continue their usual daily activities, to refrain from excessive emotional and physical stress, and to be still and holding their arms at the heart-level while measurements were made. Systolic readings values greater than 260mmHg or lower than 70mmHg as well as diastolic readings greater than 150mmHg or lower than 40mmHg were discarded.
Blood pressure variabilityTo improve the predictive power of 24-h BPV, Mena et al proposed the ARV index.5 This method focuses on changes occurring over short time intervals and, thus, corrects some of the limitations of SD, which only reflects the dispersion of BP measurements around the mean. ARV index was a more reliable index for establishing the prognostic significance of BPV.5
ARV index is calculated using the following formula:
where N denotes the number of valid blood pressure (BP) measurements in the ABPM data corresponding to a given subject and k is the order of measurements.Target organ damage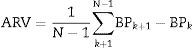
Echocardiographic measurements were recorded and analysed offline by experienced investigators who were unaware of the clinical data of the participants. Left ventricular mass index (LVMI) was determined from transthoracic 2-dimensional targeted M-mode echocardiography with the participants in the partial left decubitus position.
LVMI was calculated using Devereux formula.19

(Body surface area=0.007184*Height (cm)0.725*Weight (kg)0.425)
Values below 115g/m2 among males and 95g/m2 among women were considered normal, while values above were considered as hypertrophic.
A single-experienced radiologist made the CIMT measurements with Toshiba Aplio 500 (Toshiba Co. Ltd. Tokyo, Japan) ultrasound device, at B mode 7.5–12MHz using surface probes. For ultrasound analysis, intima-media thickness was measured by utilizing the characteristic echogenicity of the lumen-intima and media-adventitia surfaces. Patients with CIMT of 0.9mm or more were considered at cardiovascular risk, and those with less thickness were evaluated as normal.
Target organ damage (TOD) was defined as LVMI values above 115g/m2 among males and 95g/m2 among women and CIMT of 0.9mm or more.
Statistical analysisThe data were analyzed using IBM SPSS Statistics 22.0 (IBM Corp., Armonk, New York, USA) statistical software. Descriptive statistics provided are unit counts (n), percentage (%), median (range) and mean±standard deviation. Normality of the distribution of numerical variables was evaluated with Shapiro–Wilk normality test and Q–Q graphs. Between-group comparisons were made using the independent samples t-test for variables with normal distribution or the Mann–Whitney U-test for non-normal distribution. Relationships between categorical variables in two independent groups were investigated using the chi-square test or Fisher's exact test method. When the variables were considered dependent, the Mc Nemar test was used. Logistic regression analysis was used to determine the relative risks of developing high systolic ARV. Only the variables with a statistically significant association in the simple logistic regression model were included in the multiple logistic regression model. Odds ratios (OR) and 95% confidence intervals (CI) were determined. Generalize Linear Mixed Model for repeated measure with a binary logistic function was used to determine the factors affecting TOD at follow-up. Level of statistical significance was set as p<0.05.
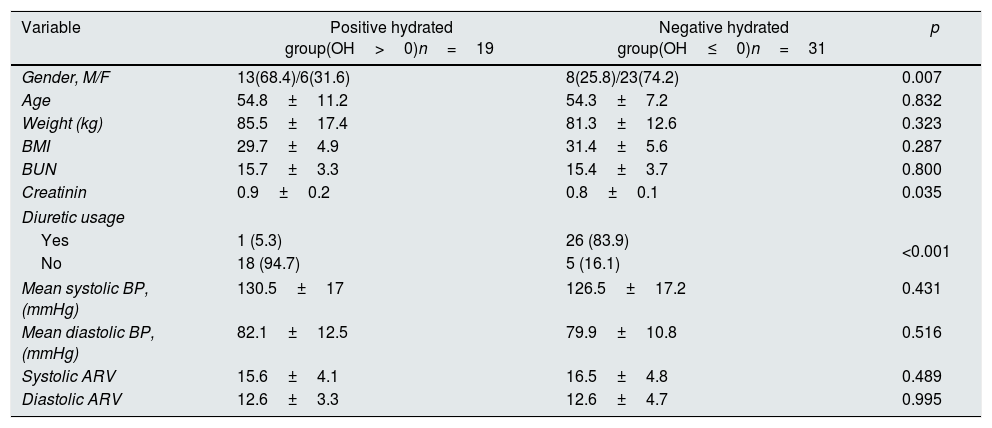
ResultsThe study population consisted of 50 patients with a mean age of 54.5±8.8 years. We divided all patients into two groups according to their volume status throughout the one year. The first group consisted of 31 patients with two or more negative OH values (≤0 OH value) in four different bioimpedance spectroscopy measurements. The second group consisted of 19 patients with a positive OH value (0>OH value) in the three or four measurements. Thus, the patients in the first group consisted of patients continuing in negative hydrated status and the patients in the second group consisted of patients who were positive hydrated throughout one-year follow-up. Twentysix patients in negatively hydrated group received diuretic, 12 (44.4%) of them received 12.5mg hydrochlorothiazide, and 14 (54%) of them received 25mg hydrochlorothiazide. Only 1 patient received diuretic (25mg hydrochlorothiazide) in positively hydrated group. The baseline characteristics of the patients in both groups are presented in Table 1. The patients in both groups were similar with regard to age, BUN and BMI but male ratio was more prevalent in positive hydrated group. Diuretic usage in negative hydrated group was significantly higher than other group at enrollment. No patient died during study period. At the end of one-year follow-up, there were no significant changes with regard to weight, height and BMI between basal and twelfth month measurements in patients in both groups.
Comparisons of patients according to hydration status at enrollment.
| Variable | Positive hydrated group(OH>0)n=19 | Negative hydrated group(OH≤0)n=31 | p |
|---|---|---|---|
| Gender, M/F | 13(68.4)/6(31.6) | 8(25.8)/23(74.2) | 0.007 |
| Age | 54.8±11.2 | 54.3±7.2 | 0.832 |
| Weight (kg) | 85.5±17.4 | 81.3±12.6 | 0.323 |
| BMI | 29.7±4.9 | 31.4±5.6 | 0.287 |
| BUN | 15.7±3.3 | 15.4±3.7 | 0.800 |
| Creatinin | 0.9±0.2 | 0.8±0.1 | 0.035 |
| Diuretic usage | |||
| Yes | 1 (5.3) | 26 (83.9) | <0.001 |
| No | 18 (94.7) | 5 (16.1) | |
| Mean systolic BP, (mmHg) | 130.5±17 | 126.5±17.2 | 0.431 |
| Mean diastolic BP, (mmHg) | 82.1±12.5 | 79.9±10.8 | 0.516 |
| Systolic ARV | 15.6±4.1 | 16.5±4.8 | 0.489 |
| Diastolic ARV | 12.6±3.3 | 12.6±4.7 | 0.995 |
Data are expressed as the mean±SD, or noun (percentage). OH: Overhydration value, M: Male, F: Female, BMI: Body mass index, BUN: Blood urea nitrogen, BP: Blood pressure.
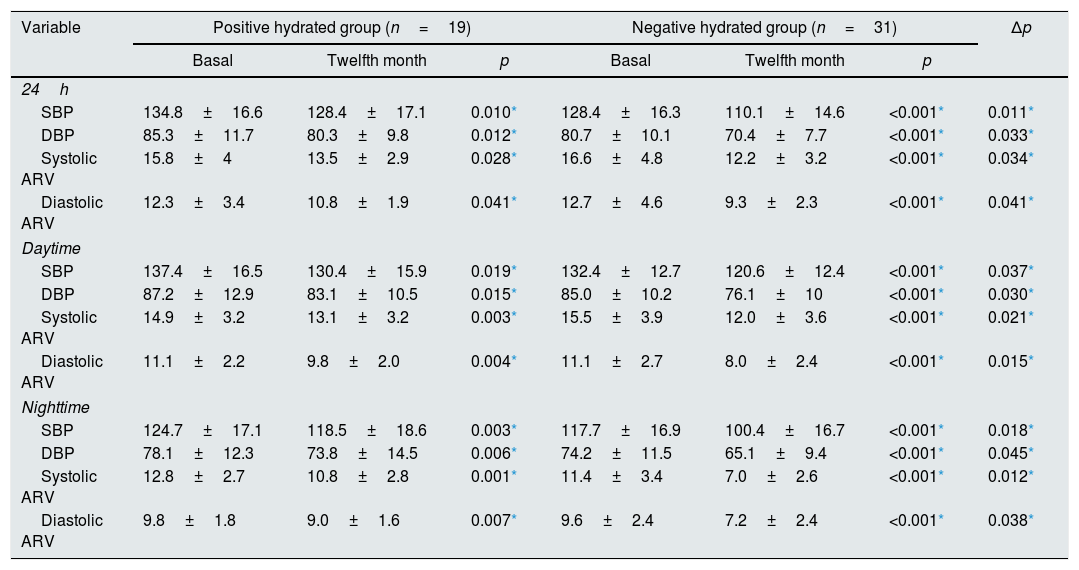
Systolic and diastolic ARV significantly decreased in both groups (positively and negatively hydrated) along with decrease in blood pressure at the end of the twelfth month. This result can be attributed to antihypertensive treatment (diuretic or vasodilator drugs) in both groups. But, systolic and diastolic ARV (24-h, daytime, nighttime) significantly more decreased in negatively hydrated group than positively hydrated group (Table 2). Similarly, at the end of one-year follow-up, patients in negative hydrated group were found to have significantly lower mean systolic (110.1±14.6 and 128.4±17.1; respectively) and diastolic BP (70.4±7.7 and 80.3±9.8; respectively) compared with baseline (p=0.0011 and p=0.033; respectively). More diuretics (hydrochlorothiazide) were used in the negative hydrated group to control of arterial hypertension (83.9% and 5.3%; respectively. p<0.001). 55.6% of the patients receiving diuretics used 25mg hydrochlorothiazide and the rest used 12.5mg hydrochlorothiazide.
Comparisons of blood pressure and blood pressure variabilities of patients according to hydration status.
| Variable | Positive hydrated group (n=19) | Negative hydrated group (n=31) | Δp | ||||
|---|---|---|---|---|---|---|---|
| Basal | Twelfth month | p | Basal | Twelfth month | p | ||
| 24h | |||||||
| SBP | 134.8±16.6 | 128.4±17.1 | 0.010* | 128.4±16.3 | 110.1±14.6 | <0.001* | 0.011* |
| DBP | 85.3±11.7 | 80.3±9.8 | 0.012* | 80.7±10.1 | 70.4±7.7 | <0.001* | 0.033* |
| Systolic ARV | 15.8±4 | 13.5±2.9 | 0.028* | 16.6±4.8 | 12.2±3.2 | <0.001* | 0.034* |
| Diastolic ARV | 12.3±3.4 | 10.8±1.9 | 0.041* | 12.7±4.6 | 9.3±2.3 | <0.001* | 0.041* |
| Daytime | |||||||
| SBP | 137.4±16.5 | 130.4±15.9 | 0.019* | 132.4±12.7 | 120.6±12.4 | <0.001* | 0.037* |
| DBP | 87.2±12.9 | 83.1±10.5 | 0.015* | 85.0±10.2 | 76.1±10 | <0.001* | 0.030* |
| Systolic ARV | 14.9±3.2 | 13.1±3.2 | 0.003* | 15.5±3.9 | 12.0±3.6 | <0.001* | 0.021* |
| Diastolic ARV | 11.1±2.2 | 9.8±2.0 | 0.004* | 11.1±2.7 | 8.0±2.4 | <0.001* | 0.015* |
| Nighttime | |||||||
| SBP | 124.7±17.1 | 118.5±18.6 | 0.003* | 117.7±16.9 | 100.4±16.7 | <0.001* | 0.018* |
| DBP | 78.1±12.3 | 73.8±14.5 | 0.006* | 74.2±11.5 | 65.1±9.4 | <0.001* | 0.045* |
| Systolic ARV | 12.8±2.7 | 10.8±2.8 | 0.001* | 11.4±3.4 | 7.0±2.6 | <0.001* | 0.012* |
| Diastolic ARV | 9.8±1.8 | 9.0±1.6 | 0.007* | 9.6±2.4 | 7.2±2.4 | <0.001* | 0.038* |
ARV: Average real variability, SBP: systolic blood pressure, DBP: diastolic blood pressure, Δp: comparison of negative (twelfth month––basal) and positive (twelfth month––basal) hydrated group.
Data are expressed as the mean±SD.
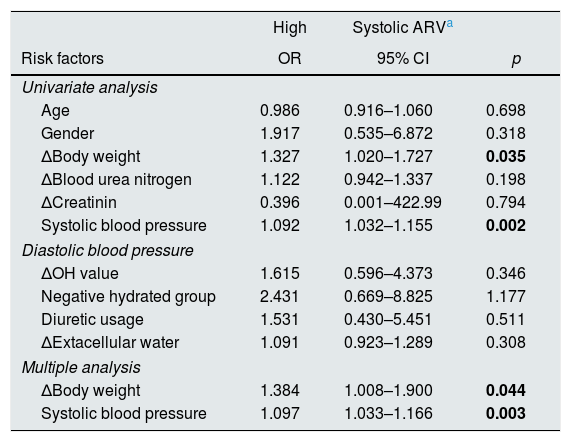
We investigated the effects of parameters on the development high systolic ARV. High systolic ARV was defined as higher systolic ARV levels of the third tertile (15.32) of ARV distribution. The first tertile and median of systolic ARV were 10.72 and 12.8, respectively. Logistic regression analysis was used to determine the relative risks of developing high systolic ARV at the end of the one year follow-up. Only the variables with a statistically significant association in the simple logistic regression model were included in the multiple logistic regression model. In multiple logistic regression analysis, significant risk factors associated with high systolic ARV were as follows: more weight gain during follow-up and higher systolic blood pressure (Table 3).
Results of univariate and multiple logistic regression analysis for risk factors for high systolic ARV at the end of the one year follow-up.
| High | Systolic ARVa | ||
|---|---|---|---|
| Risk factors | OR | 95% CI | p |
| Univariate analysis | |||
| Age | 0.986 | 0.916–1.060 | 0.698 |
| Gender | 1.917 | 0.535–6.872 | 0.318 |
| ΔBody weight | 1.327 | 1.020–1.727 | 0.035 |
| ΔBlood urea nitrogen | 1.122 | 0.942–1.337 | 0.198 |
| ΔCreatinin | 0.396 | 0.001–422.99 | 0.794 |
| Systolic blood pressure | 1.092 | 1.032–1.155 | 0.002 |
| Diastolic blood pressure | |||
| ΔOH value | 1.615 | 0.596–4.373 | 0.346 |
| Negative hydrated group | 2.431 | 0.669–8.825 | 1.177 |
| Diuretic usage | 1.531 | 0.430–5.451 | 0.511 |
| ΔExtacellular water | 1.091 | 0.923–1.289 | 0.308 |
| Multiple analysis | |||
| ΔBody weight | 1.384 | 1.008–1.900 | 0.044 |
| Systolic blood pressure | 1.097 | 1.033–1.166 | 0.003 |
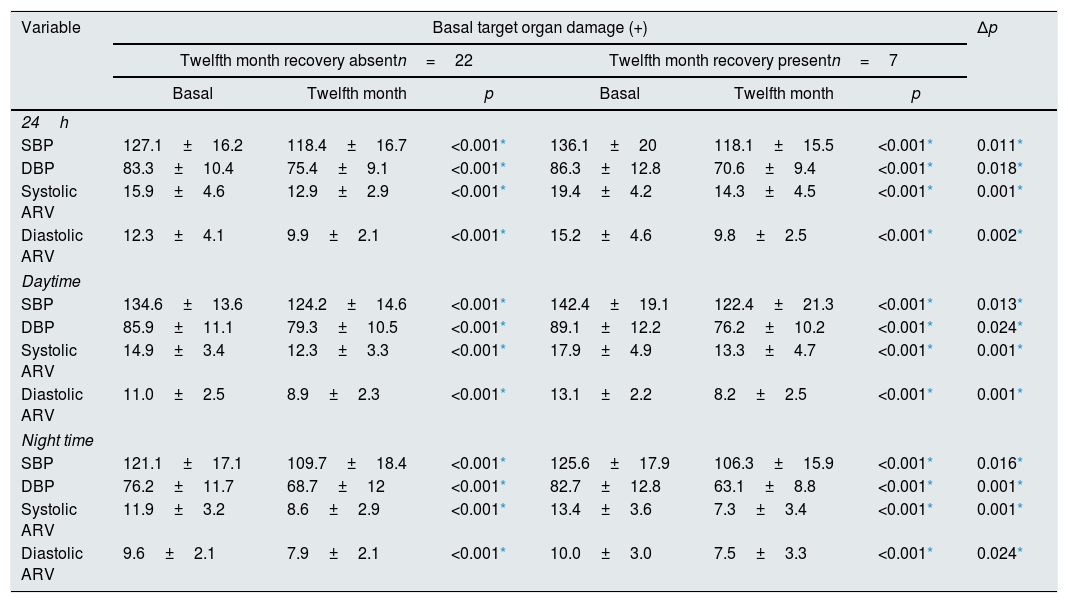
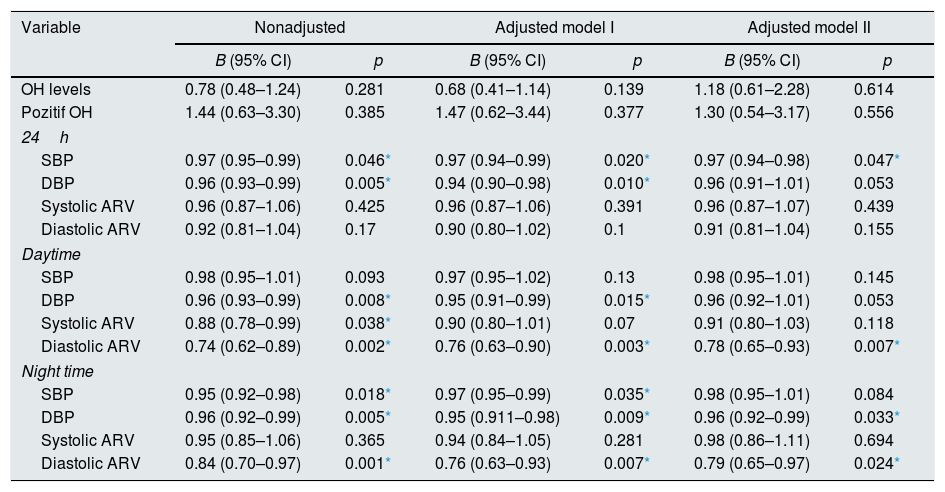
In our study, target organ damage (TOD) was defined as LVMI values above 115g/m2 among males and 95g/m2 among women and CIMT of 0.9mm or more. Patients who have improvement in both of these two parameters were considered as TOD recovery present. In patients who have TOD recovery, BPV significantly more reduced than patients with no improvement in TOD, like systolic BP and diastolic BP (Table 4). We investigated factors associated with the presence of TOD at follow-up with Generalize Linear Mixed Model for repeated measure with a binary logistic function at Table 5. Significant risk factors associated with the presence of TOD at follow-up were as follows: 24 hour systolic BP and daytime and night time diastolic ARV and night time diastolic BP.
Change in blood pressure levels and blood pressure variabilities according to recovery of target organ damage.
| Variable | Basal target organ damage (+) | Δp | |||||
|---|---|---|---|---|---|---|---|
| Twelfth month recovery absentn=22 | Twelfth month recovery presentn=7 | ||||||
| Basal | Twelfth month | p | Basal | Twelfth month | p | ||
| 24h | |||||||
| SBP | 127.1±16.2 | 118.4±16.7 | <0.001* | 136.1±20 | 118.1±15.5 | <0.001* | 0.011* |
| DBP | 83.3±10.4 | 75.4±9.1 | <0.001* | 86.3±12.8 | 70.6±9.4 | <0.001* | 0.018* |
| Systolic ARV | 15.9±4.6 | 12.9±2.9 | <0.001* | 19.4±4.2 | 14.3±4.5 | <0.001* | 0.001* |
| Diastolic ARV | 12.3±4.1 | 9.9±2.1 | <0.001* | 15.2±4.6 | 9.8±2.5 | <0.001* | 0.002* |
| Daytime | |||||||
| SBP | 134.6±13.6 | 124.2±14.6 | <0.001* | 142.4±19.1 | 122.4±21.3 | <0.001* | 0.013* |
| DBP | 85.9±11.1 | 79.3±10.5 | <0.001* | 89.1±12.2 | 76.2±10.2 | <0.001* | 0.024* |
| Systolic ARV | 14.9±3.4 | 12.3±3.3 | <0.001* | 17.9±4.9 | 13.3±4.7 | <0.001* | 0.001* |
| Diastolic ARV | 11.0±2.5 | 8.9±2.3 | <0.001* | 13.1±2.2 | 8.2±2.5 | <0.001* | 0.001* |
| Night time | |||||||
| SBP | 121.1±17.1 | 109.7±18.4 | <0.001* | 125.6±17.9 | 106.3±15.9 | <0.001* | 0.016* |
| DBP | 76.2±11.7 | 68.7±12 | <0.001* | 82.7±12.8 | 63.1±8.8 | <0.001* | 0.001* |
| Systolic ARV | 11.9±3.2 | 8.6±2.9 | <0.001* | 13.4±3.6 | 7.3±3.4 | <0.001* | 0.001* |
| Diastolic ARV | 9.6±2.1 | 7.9±2.1 | <0.001* | 10.0±3.0 | 7.5±3.3 | <0.001* | 0.024* |
Target organ damage was defined as left ventricule mass index values below 115g/m2 among males and 95g/m2 among women and carotid intima media thickness of 0.9mm or more. Patients who have improvement in both of these two parameters were considered as target organ damage recovery present. Data are expressed as the mean±SD.
ARV: Average real variability, SBP: systolic blood pressure, DBP: diastolic blood pressure Δp: comparison of recovery absent (twelfth month–basal) and recovery present (twelfth month–basal) group.
Factors associated with the presence of target organ damage at follow-up (Generalize Linear Mixed Model for repeated measure with a binary logistic function).
| Variable | Nonadjusted | Adjusted model I | Adjusted model II | |||
|---|---|---|---|---|---|---|
| B (95% CI) | p | B (95% CI) | p | B (95% CI) | p | |
| OH levels | 0.78 (0.48–1.24) | 0.281 | 0.68 (0.41–1.14) | 0.139 | 1.18 (0.61–2.28) | 0.614 |
| Pozitif OH | 1.44 (0.63–3.30) | 0.385 | 1.47 (0.62–3.44) | 0.377 | 1.30 (0.54–3.17) | 0.556 |
| 24h | ||||||
| SBP | 0.97 (0.95–0.99) | 0.046* | 0.97 (0.94–0.99) | 0.020* | 0.97 (0.94–0.98) | 0.047* |
| DBP | 0.96 (0.93–0.99) | 0.005* | 0.94 (0.90–0.98) | 0.010* | 0.96 (0.91–1.01) | 0.053 |
| Systolic ARV | 0.96 (0.87–1.06) | 0.425 | 0.96 (0.87–1.06) | 0.391 | 0.96 (0.87–1.07) | 0.439 |
| Diastolic ARV | 0.92 (0.81–1.04) | 0.17 | 0.90 (0.80–1.02) | 0.1 | 0.91 (0.81–1.04) | 0.155 |
| Daytime | ||||||
| SBP | 0.98 (0.95–1.01) | 0.093 | 0.97 (0.95–1.02) | 0.13 | 0.98 (0.95–1.01) | 0.145 |
| DBP | 0.96 (0.93–0.99) | 0.008* | 0.95 (0.91–0.99) | 0.015* | 0.96 (0.92–1.01) | 0.053 |
| Systolic ARV | 0.88 (0.78–0.99) | 0.038* | 0.90 (0.80–1.01) | 0.07 | 0.91 (0.80–1.03) | 0.118 |
| Diastolic ARV | 0.74 (0.62–0.89) | 0.002* | 0.76 (0.63–0.90) | 0.003* | 0.78 (0.65–0.93) | 0.007* |
| Night time | ||||||
| SBP | 0.95 (0.92–0.98) | 0.018* | 0.97 (0.95–0.99) | 0.035* | 0.98 (0.95–1.01) | 0.084 |
| DBP | 0.96 (0.92–0.99) | 0.005* | 0.95 (0.911–0.98) | 0.009* | 0.96 (0.92–0.99) | 0.033* |
| Systolic ARV | 0.95 (0.85–1.06) | 0.365 | 0.94 (0.84–1.05) | 0.281 | 0.98 (0.86–1.11) | 0.694 |
| Diastolic ARV | 0.84 (0.70–0.97) | 0.001* | 0.76 (0.63–0.93) | 0.007* | 0.79 (0.65–0.97) | 0.024* |
Data are expressed as the mean±SD.
OH: Overhydration value, ARV: Average real variability, SBP: systolic blood pressure, DBP: diastolic blood pressure. Adjusted Model I: Gender, Age, BMI, BUN (difference between follow-up), Creatinin (difference between follow-up) adjusted. Adjusted Model II: Gender, Age, BMI, BUN (difference between follow-up), Creatinin (difference between follow-up), Diuretic usage adjusted.
To the best of our knowledge, this is the first study that directly investigates the effect of the volume status on short-term BPV in a group of primary hypertensive patients who do not have kidney failure. It was found that patients with negative hydration status are characterised by lower values of systolic BPV. Although we did not show the relationship between high systolic ARV and OH value in multiple logistic regression analysis, more weight gain which is an indicator of volume increase was associated with high systolic ARV. In our previous study, we showed the significance of negative hydration status with respect to blood pressure control, endothelial, and cardiac functions within same population.20 Increased BPV is clearly associated with higher cardiovascular risk in the general population.13,21,22 Hence, we have shown the importance of negative hydration status to cardiovascular protection with different ways.
Results of Levi-Marpillat et al.’s study indicate that diuretics was associated with a lower short-term BPV compared with the other classes (angiotensin II receptor blockers, angiotensin converting enzyme inhibitors and beta blockers).23 The X-CELLENT trial showed that diuretics, but not angiotensin II receptor blockers, lead to a decrease of 24-h BPV compared with placebo.24 A meta-analysis of randomized trials concluded for a reduction of the visit-to-visit variability in systolic BP, that is, fluctuations of systolic BP over long periods of observation, with the use of non-loop diuretics.25 The results of our study explain how diuretics have BPV lowering effect. We used diuretics to keep the patients negative hydrated during trial and we showed that if the patients were negative hydrated with diuretic usage, they showed better decrease in BPV. The results of our work proved that reduction in BPV due to diuretic use depends on the volume reduction. In terms of explaining mechanism, this research may be considered preliminary as no comparable studies were found in the literature.
Several studies based on 24-h ABPM have shown that antihypertensive drugs decrease ambulatory BPV, a reduction which is proportional to the decrease in mean BP values, suggesting that the effect of antihypertensive treatment on short-term BPV may be largely dependent on the BP lowering, per se.26,27 But, in our study we found a collinearity between the reduction in OH value and BPV, as well as between the reduction in BP and BPV. This situation was independent from blood pressure level. Like ours, a different study showed that antihypertensive drug classes may have different effects on short-term BP variability in a daily life clinical setting, independently from the effects of major confounders such as BP level, age, gender and heart rate.23 This blood pressure independent effect may be related to relationship between the fluid status – BPV found in our study for the first time in the literature.
Trials should be aimed at exploring whether the benefits of BPV lowering by diuretics might translate into a cardiovascular risk reduction in humans. Indeed, the benefits of treatment-induced reduction in BPV have been related to a reduction in TOD in the setting of some experimental animal studies.28,29 Furthermore, BPV has been reported to impact on negative end-organ outcomes.30 The present study is one of the studies that reveal the relationship between BPV and TOD. We found that TOD was less common in patients who had more decrease in BPV. Cross-sectional and longitudinal studies showed a positive association between BPV and cardiovascular risk in pure hypertensive patients. Leoncini et al assessed the independent influence of BPV on multiple target organ damage, including LV mass index, intima media thickness, and renal abnormalities.31 High BPV, measured as SD and ARV, was associated with the simultaneous presence of 2 or more signs of subclinical organ damage, regardless of several confounding variables, including BP. They reported that parameters of BPV and LV mass index gradually increased together, which is line with our findings. The association of systolic BPV with echocardiographic parameters was previously studied by Zakopoulos et al. and they demonstrated that a 0.1mmHg/min increase in the daytime rate of systolic BPV was associated with an increment of 7.087g in the left ventricular mass.32 Unlike these results, Massierer et al. did not show associations between BPV assessed through 24h-ABPM with echocardiographic variables related to diastolic function, left ventricular hypertrophy and cardiac chamber diameters in hypertensive-diabetic patients.33 However, the volume status of patients was not measured in this study. According to our results, we can claim that if hypovolemia was not established in the patients in Massierer et al.’s study, cardiac parameters could not be improved.
Xiong et al found that ARV generally had a strong relationship to intima media thickness as a sign of early atherosclerosis.34 Another study found that ARV had the strongest relationship to arterial stiffness.35 These results were confirmed that the relationship between ARV and arterial stiffness was independent from office BP and average 24-hour BP. In the present study, we analyzed short-term BPV and CIMT in negative and positive hydrated patients. Negative hydrated patients had better results for both BPV and TOD parameters including higher CIMT.
LimitationsThe main limitations of the present study include the small number of patients involved in the study. Because of our non-randomized selection of patients, both groups are not properly comparable. The fact that our study group is a rather selected one and the exclusion of patients with diabetes or chronic kidney disease make our findings not entirely applicable to the population of hypertensive population at large or to patients seen by general practitioners. It must also be stressed that this research would not have been possible without statistical measurement and no existing ABPM devices incorporate automatic quantification of ARV or other novel BPV indexes.
ConclusionsIn primary hypertensive patients, we have demonstrated that addition of diuretic to established treatment or intensified diuretic treatment and keeping patients in negative hydration status resulted in more reduction in BPV along with reduced blood pressure at twelfth month of follow-up. More weight gain and higher systolic blood pressure are major risk factors of high systolic ARV, but not hypervolemia. In patients who have TOD recovery, BPV significantly more reduced than patients with no improvement in TOD, like systolic BP and diastolic BP. Potential effect of diuretics on BPV could be the guide to an optimal antihypertensive treatment in higher risk patients. Further investigation is required to define potential beneficial effects of negative hydration status, to identify treatments that reduce BPV and to clarify whether those therapeutic interventions provide additional prognostic benefit, independent of a reduction in mean BP.
FundingThe authors report no specific funding in relation to this research.
Conflict of interestThe authors declare no conflicts of interests.


