Introducción y objetivos: El incremento del consumo de alimentos procesados que incluyen aditivos con fósforo nos lleva a plantearnos la siguiente hipótesis de trabajo: la utilización de aditivos ricos en fosfatos fácilmente absorbibles en los alimentos procesados supone un incremento significativo del fósforo contenido en la dieta, que puede considerarse como fósforo oculto al no quedar registrado en las tablas de composición de alimentos. Material y método: Se determina la cantidad de fósforo contenido en 118 productos procesados mediante espectrofotometría. Se contrastan los resultados con las tablas de composición de alimentos del Centro de Enseñanza Superior de Nutrición y Dietética, de Morandeira y de la Red BEDCA. Resultados: El procesamiento de los alimentos con frecuencia implica el uso de aditivos fosfóricos. Los productos en cuya etiqueta figuran estos aditivos presentan un mayor contenido en fósforo y una mayor ratio fósforo/proteínas. Apreciamos discordancia con las tablas de composición de alimentos en la cantidad de fósforo determinada en una parte importante de los productos. El contenido en fósforo de alimentos refrigerados-elaborados apenas figura en las tablas. Conclusiones: El etiquetado de los productos ofrece información escasa sobre el contenido en fósforo. Apreciamos disparidad de contenido de fósforo en determinados alimentos respecto a las tablas de composición de alimentos. Deberíamos formar a nuestros pacientes en la revisión de los aditivos en las etiquetas y en la limitación de los alimentos procesados. Una aproximación al problema debe incluir actuaciones de política sanitaria: las empresas deberían analizar el contenido en fósforo de sus productos, reflejar este dato en el etiquetado e incorporarlo en las tablas de composición de alimentos. Podrían establecerse incentivos para elaborar alimentos con contenido bajo en fósforo y alternativas a los aditivos que contienen fósforo.
Introduction and objectives: An increased consumption of processed foods that include phosphorus-containing additives has led us to propose the following working hypothesis: using phosphate-rich additives that can be easily absorbed in processed foods involves a significant increase in phosphorus in the diet, which may be considered as hidden phosphorus since it is not registered in the food composition tables. Materials and method: The quantity of phosphorus contained in 118 processed products was determined by spectrophotometry and the results were contrasted with the food composition tables of the Higher Education Centre of Nutrition and Diet, those of Morandeira and those of the BEDCA (Spanish Food Composition Database) Network. Results: Food processing frequently involves the use of phosphoric additives. The products whose label contains these additives have higher phosphorus content and higher phosphorus-protein ratio. We observed a discrepancy with the food composition tables in terms of the amount of phosphorus determined in a sizeable proportion of the products. The phosphorus content of prepared refrigerated foods hardly appears in the tables. Conclusions: Product labels provide little information on phosphorus content. We observed a discrepancy in phosphorus content in certain foods with respect to the food composition tables. We should educate our patients on reviewing the additives on the labels and on the limitation of processed foods. There must be health policy actions to deal with the problem: companies should analyse the phosphorus content of their products, display the correct information on their labels and incorporate it into the food composition tables. Incentives could be established to prepare food with a low phosphorus content and alternatives to phosphorus-containing additives.
INTRODUCTION
High levels of phosphorus are related to the development of arteriosclerosis and bone disease in patients with chronic kidney disease (CKD)1. Phosphorus intake is also a public health problem given its impact on cardiovascular risk in the general population (“new cholesterol”)2-4. The wide and growing use of these additives5, in relatively high quantities6, without clear regulations in the labelling7,8 and usually without their inclusion in the food composition tables means that there is a high phosphorus contribution, which we can consider to be “hidden phosphorus”9.
The dietary recommendations in CKD aim to obtain an adequate protein contribution with reduced phosphorus intake, which is a difficult balance to achieve. Additives provide phosphorus without protein, which is something we should consider in the dietary education of our patients. However, it is difficult to know the real phosphorus contribution in the diet, given the limited information on the product labels and the few and confusing data in the food composition tables10.
The main objective of this study was to provide information about the real phosphorus content determined by spectrophotometry in an extensive group of 118 natural products and with different degrees of processing. As secondary objectives, we aimed to indicate the differences and contradictions with respect to the different food composition tables and make nephrologists, dieticians and nursing staff aware of this barrier in dietary education, in order to facilitate practical training for our patients.
MATERIAL AND METHOD
Study design: descriptive cross-sectional study with analysis of food product components.
We received financing of the Aragón Health Sciences Institute over two years to determine phosphorus and protein in 118 fresh products with different degrees of processing.
In the first 52 products we analysed three different batches. After verifying the reproducibility of the phosphorus measurements, we acquired two batches of the following 66 products analysed and carried out a third test when the values were conflicting (coefficient of variation [CV] [standard deviation (SD/average value] ≥10%).
The detailed methodology of the study is displayed in a previous publication10. Total phosphorus was determined using molecular absorption spectrophotometry and total protein content was determined by the Kjeldahl method. These tests were carried out in the Aragón Food Technology and Research Centre. The averages of the tests were considered to be phosphorus measured. Protein content, which was more standardised, was only measured in the first batch of each product.
Expression of results
Phosphorus content was expressed in mg/100g of the product and the protein content was expressed in g/100g of the product. We added the calculation of the phosphorus [mg]-protein [g] ratio due to its relevance in our patients11. The Kidney Disease Outcomes Quality Initiative guidelines recommend a dietary ratio of 10-12mg/g.
We reviewed the information on phosphorus and protein content of the different food processed in the Moreiras food composition table12, that of the Nutrition and Diet Higher Education Centre13 and that of the BEDCA (Spanish Food Composition Database) of the Ministry of Science and Innovation, Spanish Food Safety and Nutrition Agency14.
Statistical analysis
The description of quantitative variables was carried out with their mean ± SD and the qualitative variables with the distribution of frequencies. We carried out a phosphorus content repeatability study in various foods, with two or three repetitions for each sample. We calculated the mean, SD, and the CV (CV=SD/mean) expressed as a % and the repeatability interval (r=SDx2.8) for each set of repeated tests of the same sample. Subsequently, we calculated the means of all the previous tests in all the samples. We considered CV values between phosphorus tests in the same sample <10% to be acceptable. We considered p values <.05 to be statistically significant. We analysed the data with the SPSS version 15.0 software.
RESULTS
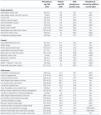
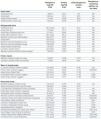
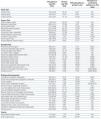
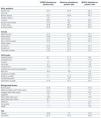
The results obtained in our tests are shown in Tables 1, 2 and 3. For a comparison, the data of the food composition tables are expressed in Table 4.
Of the 118 products analysed, 50 (43.2%) contained phosphorus additives, according to the labels. The mean phosphorus value in the total samples was 162.1 (range 21.4-790.3) mg/100g, the mean SD was 9.93mg/100g, the mean CV was 6.7% and the mean repeatability interval (r) was 29.3mg/100g (this implies that 95% of the time, a new test, repeated again, did not differ by more than 29.3mg/dl from the mean of the previous tests). In values below the median, the mean of the phosphorus tests in the total sample was 120.3 (range 21.4-160.6) mg/100g, the mean of the SD was 8.7mg/100g, the mean of the CV was 7.9% and the mean repeatability interval (r) was 24.6mg/100g. In values above the median, the mean phosphorus test in the total sample was 205.3 (range 161.2-790.3) mg/100g, the mean SD was 10.3mg/100g, the CV mean was 5.4% and the mean repeatability interval (r) was 28.38mg/100g. The CV was significantly lower (5.3% vs. 7.9%; p=.016) in products with values above the median phosphorus content. There were no significant differences in the r value.
In dairy products, the high phosphorus content is known, which increases in processed milk. Soy milk contributes half the phosphorus with a similar amount of proteins, and as such, it may be used in some patients, although we must bear in mind the problem of its palatability. Cheeses for melting and grating have phosphorus-containing additives in the form of melting salts. It must be noted that in fresh cheeses such as Burgos, the most tolerated in the dietary recommendations for our patients, we detected a high phosphorus-protein ratio in the six samples taken in two products (between 18.9 and 20.4mg/g), which is much higher than that displayed in two of the tables (13.7mg/g). Overall, the products without phosphorus additives have a phosphorus-protein ratio of 10.2mg/g and those that contain these additives have a ratio of 15.3mg/g.
Within cereals, simple products, such as Marie biscuits or white bread have a reasonable phosphorus-protein ratio of between 11.7 and 12.1mg/100g. Different brands of sliced bread may or may not include phosphorus additives, with a 23% increase in phosphorus content in those that contain them. “Spongy” products, such as cupcakes, or sobao cakes have a high phosphorus content, since their dough requires phosphorus-containing additives, while products such as croissants reduce the phosphorus quantity since they do not include these additives. Products without phosphorus-containing additives have a phosphorus-protein ratio of 11.4mg/g and those that contain these additives have a ratio of 25.7mg/g. The tables display contradictory values for Marie biscuits, sobao cakes, croissants and chocolate cookies.
The phosphorus-protein ratio in sausages decreases as the quality of the products increases, since they require fewer preservatives and flavouring. Specific products such as cooked ham, which do display the absence of phosphates on their labels effectively have a significant reduction in phosphorus content, of around 33%. Products that we may recommend to our patients, such as cold meats that are low in fat and salt, may have phosphorus-containing additives to give them texture and taste. Products without phosphorus-containing additives have a phosphorus-protein ratio of 10.2mg/g and those that contain these additives have a ratio of 15.5mg/g. The tables do not provide information about products without phosphates, and some low-phosphorus values in smoked and chopped bacon, chorizo and fuet salami are surprising, as well as contradictory data for chorizo, cooked ham and Bologna sausage.
The results for meat products and fish were reported in a previous study10. In summary, we can say that the phosphorus-protein ratio is higher in processed meat products (15.83mg/g) than in breaded products (11.04mg/g) and frozen products (10.5mg/g), and is lower in fresh (8.41mg/g) and refrigerated meat products (8.78mg/g). Fresh white fish has a phosphorus-protein ratio of 8.58g/g while in frozen white fish, it increases by 22% (10.3mg/g) and in breaded white fish, by 46% (12.54mg/g). The information in the tables is poor and confusing, without reference to the brands analysed. We should highlight the reasonable phosphorus content in oily fish such as fresh salmon, frozen salmon and frozen swordfish (between 10.29 and 11.92mg/g), data that coincide with the table values for salmon (phosphorus-protein ratio between 12 and 12.9mg/g), although there are conflicting values for swordfish (phosphorus-protein ratio of 29.8mg/g in the Moreiras table).
The wide diversity of refrigerated-prepared foods makes a systemic evaluation difficult. Their phosphorus content hardly appears in the tables, and the information is conflicting and confusing. In general, they have additives and high amounts of phosphorus, although, in some cases the phosphorus-protein ratio would mean they could be included to a limited extent in our patients’ diets: meatballs and chicken croquettes, pies and tuna patties, fresh spaghetti and fideuà. We also found that some simple pizzas (romana, cooked ham and cheese pizza) do not contain excessively high quantities of phosphorus. Products without phosphorus additives have a phosphorus-protein ratio of 13.3mg/g and those that contain these additives have a ratio of 18.7mg/g.
DISCUSSION
The increased consumption of processed foods, with the extensive use of phosphorus additives, complicates dietary management of CKD patients. The diverse application of these additives (pH regulators, antioxidants, protein stabilisers, flavour enhancers, colour enhancers, melting salts in cheeses, dough enhancers and baking powder) means that they may contribute up to a third of dietary phosphorus15. Leon et al., in supermarkets in the US, detected that almost 50% of foods have phosphorus-containing additives, increasing the phosphorus quantity by 67mg/100g. The presence of additives is common in refrigerated-frozen and packaged products, cereals and yogurts, and in general, the products that contain them are cheaper16.
Current regulations make phosphorus contribution estimations difficult: producers are not required to display their quantities on the labels, variable quantities are allowed, since they can set their limit according to maximum amounts and the contribution of these additives is not clearly defined in the food composition tables17. Therefore, we must interpret the phosphorus contribution calculation with caution by dietary survey18, and we recommend questionnaires that record the normal intake of different foods and their form of preparation19.
In the dietary education of CKD patients, we must be aware of this extra contribution in the form of hidden phosphorus20. Some authors are optimistic and consider that by recognising the problem, we can provide better options21. However, poor knowledge of the phosphorus content of many products limits our actions, which do not usually go beyond recommending intake of non-processed foods. This option is increasingly complicated, since in modern society, processed foods surround our patients, making regular access to natural foods difficult. We must study more specific dietary interventions that include information about phosphorus-containing additives. Of the list of additives authorised, only a few are a source of phosphorus and they are displayed on labels with a letter and number format: phosphoric acid (E338), phosphates (E339, E340, E341, E343), diphosphates (E450), triphosphates (E451) and polyphosphates (E452). Sullivan et al. achieved a moderate but significant decrease in serum phosphorus levels of 0.6mg/dl, by adding data on phosphorus-containing additives to patient dietary information22.
Other factors complicate the limitation of phosphorus contributions. The quantities permitted are relatively high, since their limits are designed more to avoid fraud than being based on a dietary risk; in some products (refrigerated, frozen and packaged foods in supermarkets), the regulations allow phosphorus-containing additives without a specific indication thereof on the list of ingredients23 and in other processed products (pizza, tortellini, cheese paninis, etc.), it is surprising that there are no phosphorus-containing additives on the labels. This may be due to current legislation, which according to the “General regulations for labelling, presentation and advertising of foodstuffs”, it is not compulsory to declare in the list of ingredients additives from an ingredient if they do not have a technological function in the final product. This means that in prepared or pre-cooked products, there may be prepared dough with phosphorus-containing additives, melted cheese with phosphates, crab sticks with phosphates, etc. whose phosphorus content is not listed on the labels.
In this study on 118 products, we aim to provide complete information about the phosphorus content of the processed products reviewed in previous studies10,24, displaying data on the normal foods in our setting, noting the differences with fresh food and the discrepancy with food composition tables. We consider it important to remark that nephrologists, nutritionists and nephrology nursing staff should be aware of these barriers in order to recognise a potential for the reduction of phosphorus, while maintaining protein intake. Intake of natural foods that are not pre-cooked and the phosphorus content of some soft drinks (particularly cola) are important aspects that we should consider25.
The study limitations are those that are unavoidable in any approach to this problem. It was a cross-sectional study carried out in a specific geographic area, new products often appear and at any time there may be changes in the processing of the food, which may alter its phosphorus content (the quantities permitted according to current legislation are indicated with “up to xxx grams of P205 per kg or litre”, with a generally high level that may be variable). These limitations highlight the importance of the need for dietary advice clinics and prospective studies to assess whether we can adopt truly effective measures.
We must be aware of the excessive phosphorus contribution of phosphorus additives without protein contribution. Patients must be provided with this information at dietary advice clinics, and must individually become accustomed to reviewing product labels; prospective studies are recommended to assess the effectiveness of the measures. It is obvious that this problem requires healthcare policy actions, such as changes to the labelling that make it compulsory to display the real phosphorus content of the product and encourage the preparation of products with a low phosphorus content and alternatives to phosphorus additives.
Conflicts of interest
The authors declare that they have no conflicts of interest related to the contents of this article.
Table 1. Results of the phosphorus and protein composition of foods and the phosphorus-protein ratio according to the tests by the Aragón Agri-Food Research Centre. Dairy products, cereals and cold meats
Table 2. Results of the phosphorus and protein composition of foods and the phosphorus-protein ratio according to the tests by the Aragón Agri-Food Research Centre. Fresh, refrigerated, frozen, breaded and processed meats
Table 3. Results of the phosphorus and protein composition of foods and the phosphorus-protein ratio according to the tests by the Aragón Agri-Food Research Centre. Fresh, frozen and breaded fish and surimi
Table 4. Phosphorus-protein ratio according to the values of the food composition tables. Dairy products, cereals, cold meats, refrigerated-frozen products and fish


