Antecedentes: Nuestro propósito era determinar el índice de progresión de la enfermedad renal crónica (ERC) e identificar predictores, con especial énfasis en el metabolismo mineral y óseo. Métodos: Estudio retrospectivo y de observación que incluye a 300 pacientes con ERC avanzada (61,2 % varones, 33,1 % diabéticos; edad 65,6 ± 14 años). El tiempo medio de seguimiento fue de 19,4 ± 10,1 meses. El índice de filtración glomerular estimado (FGe) de referencia (MDRD-4) fue de 22,5 ± 7,18 ml/min. Para calcular la tasa de reducción en el IFGe, utilizamos la pendiente de la línea de regresión entre todas las determinaciones de IFGe y el tiempo de seguimiento. Calculamos los valores medios de proteinuria y fosfato sérico, calcio, ácido úrico y hormona paratiroidea (PTH), así como la excreción urinaria de 24 horas de nitrógeno ureico de cada paciente. El seguimiento fue, como mínimo, de 6 meses e incluyó al menos 4 mediciones de FGe. Resultados: La tasa media de reducción de FGe (–1,64 ml/min/1,73 m2/año) estaba inversamente correlacionada con los niveles de fosfato sérico (4,3 ± 2,1 mg/dl, p < 0,001), PTH (256,3 ± 193,7 mg/l, p < 0,001) y proteinuria (0,84 ± 1,31 g/día, p = 0,004) y directamente correlacionada con el calcio sérico medio (p < 0,001) y la presencia de hipertensión (p < 0,02). Sin embargo, únicamente el fosfato sérico, la PTH sérica y la proteinuria persistieron como predictores en el análisis multivariable. Los pacientes con IFG estable (pendiente positiva) eran mayores (p = 0,041) y presentaban niveles más bajos de fosfato sérico y PTH (p < 0,01 y p < 0,01, respectivamente), y proteinuria más baja (p < 0,01). Conclusiones: La tasa de reducción en el FGe estaba correlacionada con los niveles de fosfato sérico y PTH y la proteinuria. Todos estos factores pueden modificarse con el tratamiento adecuado.
Background: Our aims were to determine the rate of progression of chronic kidney disease (CKD) and to identify predictors, with particular emphasis on bone and mineral metabolism. Methods: Retrospective and observational study including 300 patients with advanced CKD (61.2% males, 33.1% diabetics; age 65.6±14 years). Mean follow-up time was19.4±10.1 months. Baseline estimated glomerular filtration rate (eGFR) (MDRD-4) was 22.5±7.18mL/min. To calculate the rate of decline in eGFR, we used the slope of the regression line between all determinations of eGFR and follow-up time. We calculated the mean values for proteinuria and serum phosphate, calcium, uric acid, and PTH, as well as 24-hour urinary excretion of urea nitrogen over time for each patient. Follow-up was at least 6 months and included at least 4 measurements of eGFR. Results: The mean rate of decline eGFR (–1.64 mL/min/1.73m2/year) was inversely correlated with serum phosphate levels (4.3±2.1 mg/dL, p<.001), PTH (256.3±193.7ng/L, p<.001) and proteinuria (0.84±1.31g/day, p=.004) and directly correlated with mean serum calcium (p<.001) and the presence of hypertension (p<.02). However, only serum phosphate, serum PTH, and proteinuria persisted as predictors in the multivariate analysis. Stable-GFR patients (positive slope) were older (p=.041) and had lower serum phosphate and PTH levels (p<.01 and p<.01 respectively) and lower proteinuria (p<.01). Conclusions: The rate of decrease in eGFR was correlated with serum phosphate and PTH levels and proteinuria. All of these factors can be modified with an adequate treatment.
INTRODUCTION
Over the last decade, interest in the incidence, outcome, risk factors, and rate of progression of chronic kidney disease (CKD) has been increasing as a result of the high prevalence of this condition, elevated costs, and the risk of progressing to end-stage renal disease (ESRD), cardiovascular disease, and death.1,2
The rate of progression of CKD shows considerable inter-individual variability and is affected by several factors.3 Although previous studies have identified a wide range of risk factors for CKD, the real role of each one is unclear. Classic risk factors (eg, age, gender, ethnicity, family history of CKD, diabetes mellitus, metabolic syndrome, proteinuria, and hypertension)4 cannot account for some findings. Therefore, attention is moving to more relevant factors, such as asymmetric dimethylarginine (ADMA), fibroblast growth factor (FGF) 23, calcium–phosphate metabolism, and adiponectina.5
The ability to recognize these predictors would enable us to identify high-risk patients, provide intensive medical surveillance and treatment, avoid unnecessary examinations and monitoring, and reduce the rate of progression to ESRD.
The objectives of this study were to determine the rate of decrease in estimated glomerular filtration rate (eGFR) in a cohort of patients with advanced CKD and to identify associated progression factors, with particular emphasis on the role of bone and mineral metabolism.
METHODS
Patients
We performed a retrospective observational longitudinal study of patients with advanced CKD (stages 4 and 5) to identify the risk factors affecting the rate of decline of eGFR. We analyzed data from 576 patients referred from the nephrologist of the general outpatient clinic to our advanced CKD specialized outpatient unit at Gregorio Marañón Hospital, Madrid, Spain. We excluded patients with fewer than 6 months’ follow-up and fewer than 4 eGFR determinations (Modification of Diet in Renal Disease [MDRD] study 4-item equation). None patient was excluded by age or management. The final sample comprised 300 patients included between January 2006 and October 2010.
Medical records were consulted to obtain demographic data and values for serum creatinine, phosphorus, calcium, uric acid, PTH, proteinuria, and 24-hour urinary excretion of urea nitrogen. Other analytical data were collected at the start and end of the study period. Treatment was also recorded (erythropoiesis-stimulating agents [ESA]), as were type and number of antihypertensive drugs, statin therapy, and iron supplements. Comorbidity was assessed using the Charlson index.6
Laboratory methods
Laboratory measurements were made using standardized automated methods. Freshly voided samples were collected for urinalysis, and proteinuria was measured using the sulfosalicylate method (Sigma Aldrich®).
eGFR was calculated using the MDRD-4 equation.7 Dietary protein intake was assessed on the basis of 24-hour urinary urea nitrogen excretion according to the method described by Maroni et al.8
High blood pressure was defined as an average systolic/diastolic blood pressure of 130/85mmHg or greater or current use of antihypertensive medication, independently of blood pressure levels.
The decline in eGFR was assessed by studying the slope of the regression line of all measurements of eGFR (mL/min) over time (years) adjusted for body surface (1.73m2) and expressed as mL/min/1.73m2/year. Consequently, the more negative the slope, the faster the progression of CKD.
Patients were categorized as unstable-eGFR when the slope of the regression line was negative (n=209) and stable-eGFR when the slope was positive (n=91). Both groups were compared; the mean follow-up time was similar (19.4 and 19.0 months).
Statistical analysis
Normally distributed values are expressed as mean ±SD; non-normally distributed values are expressed as median ±IQR. The differences in quantitative variables were examined using the chi-square test for categorical variables. Continuous variables were compared using the Student’s t-test for independent samples after verifying the normality of distribution using the Kolmogorov-Smirnov test or by analysis of variance (ANOVA) when comparing more groups. A linear model was constructed to identify the relationship between different variables. Multivariate analysis (lineal regression) was performed to determine the associations between the eGFR slope and predisposing risk factors. All statistical analyses were conducted using SPSS for Windows, V. 15 (SPSS®, Chicago, Illinois, USA). Statistical significance was set at p<.05.
RESULTS
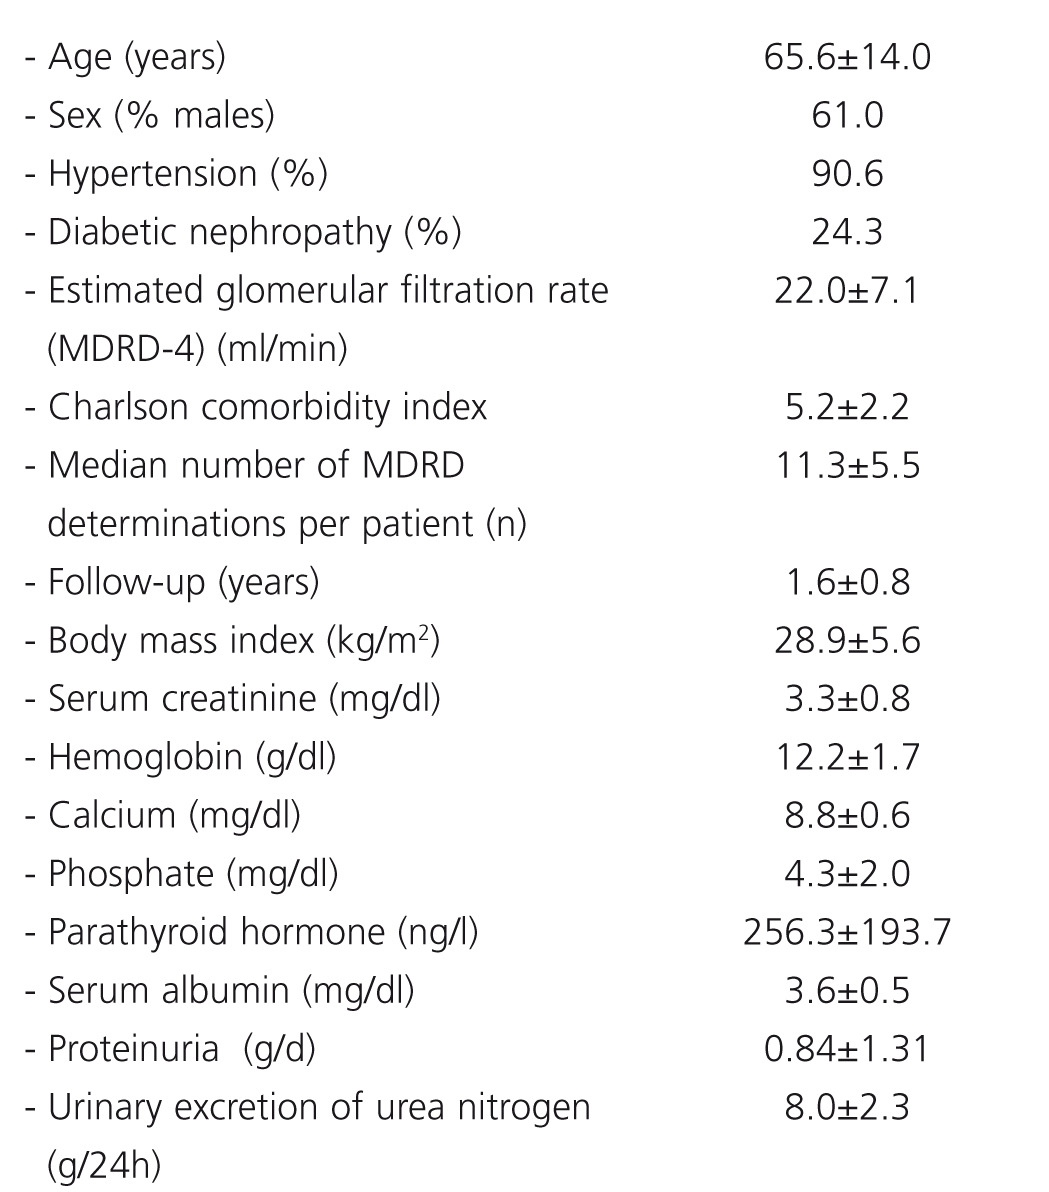
Demographic data, clinical characteristics, and baseline biochemical characteristics are shown in Table 1. The mean annual eGFR slope was –1.64+6.64 ml/min/1.73m2/year. The mean baseline eGFR was 22.5±7.1ml/min/1.73m2.
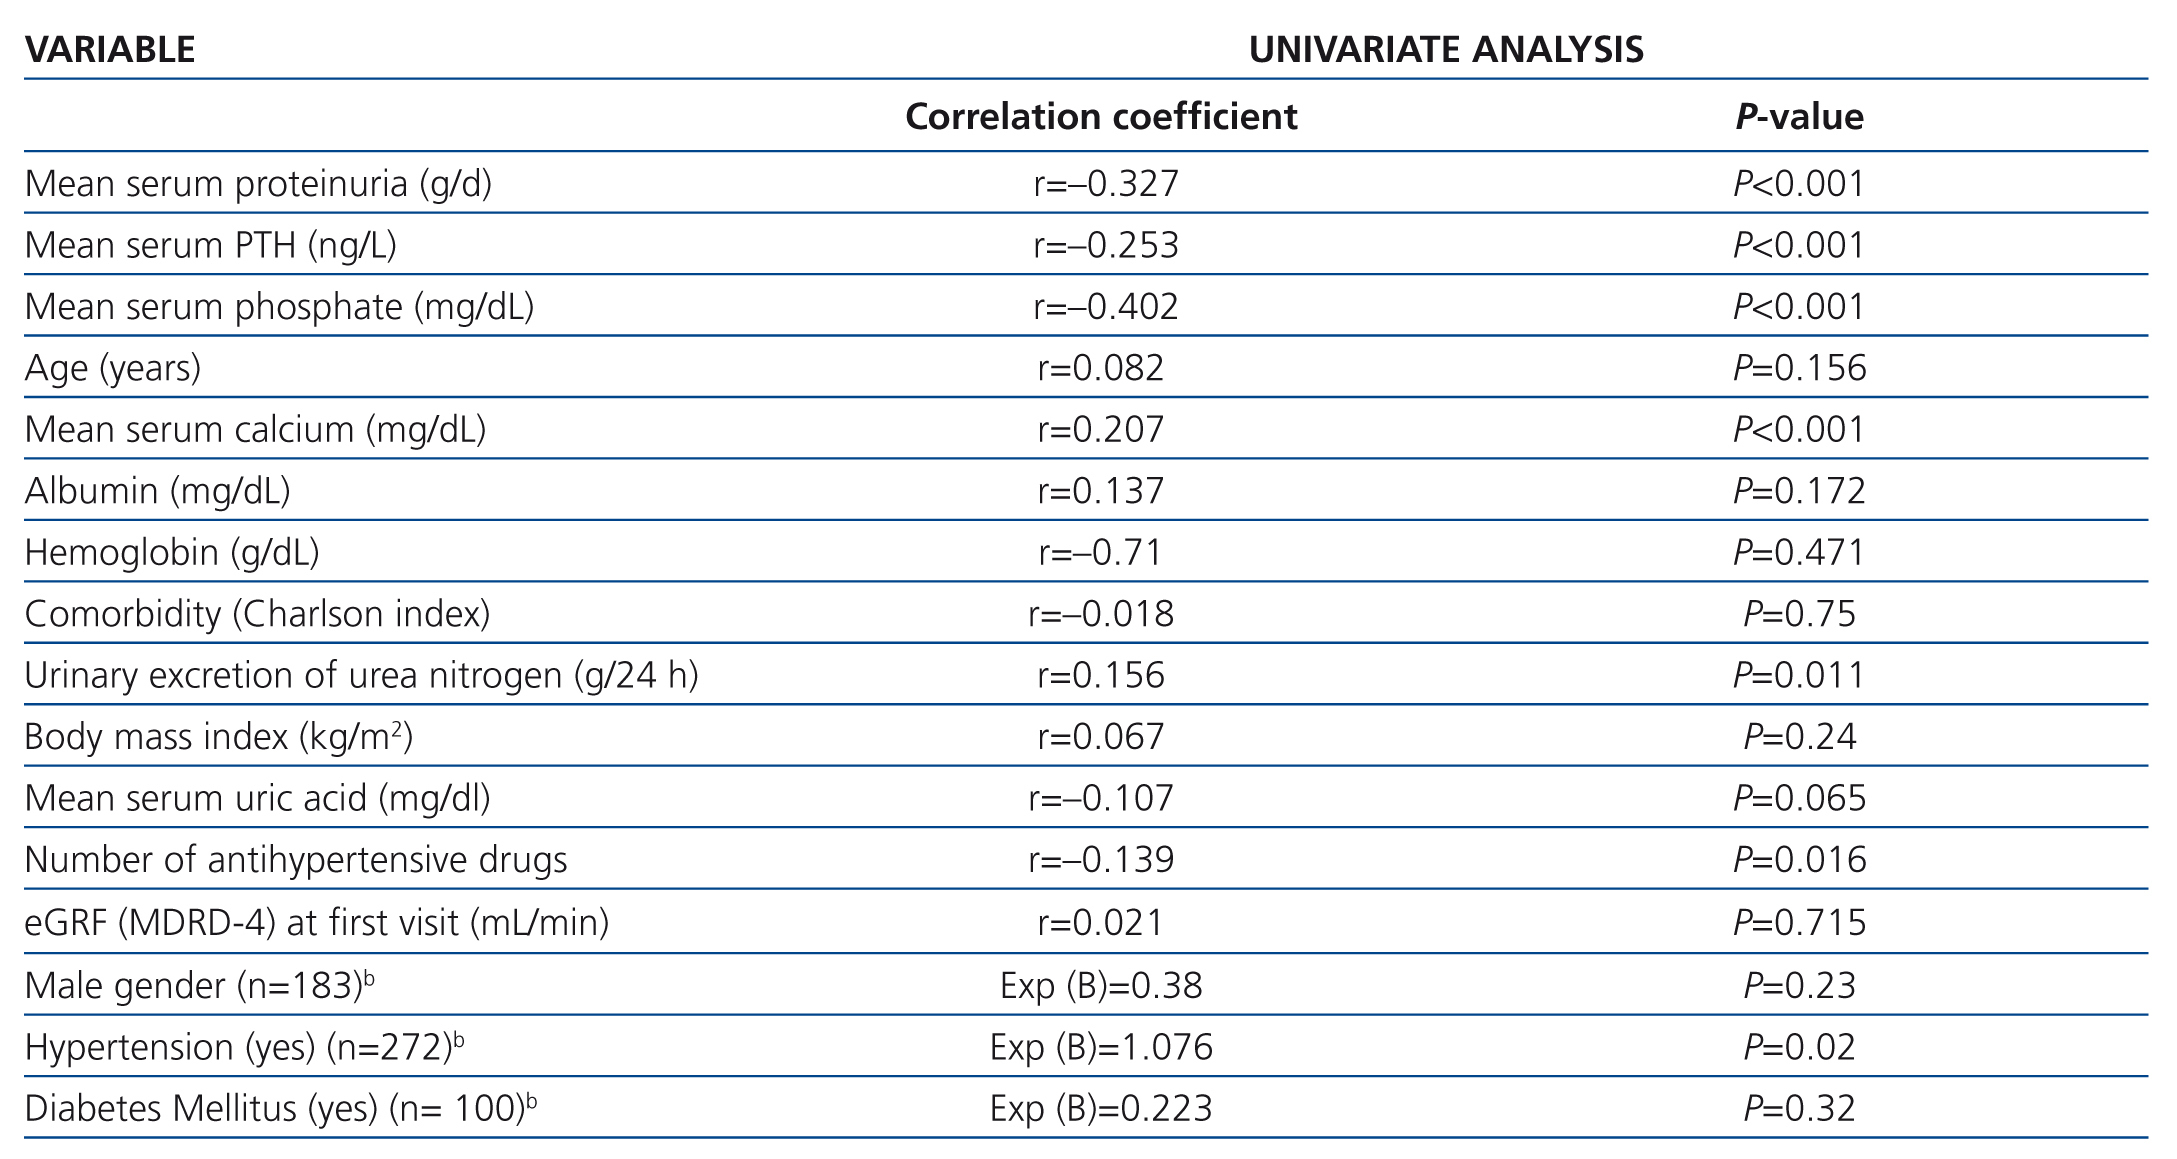
Bivariate correlation analysis revealed that progression of eGFR was inversely associated with mean serum phosphate, serum PTH, proteinuria, and the number of antihypertensive drugs, and directly associated with mean serum calcium and 24-hour urinary excretion of urea nitrogen (Table 2). We did not find any correlation with age, comorbidity, body mass index, or serum levels of uric acid, albumin, and hemoglobin.
There were no significant differences for gender, statin therapy, or diabetes in the progression of CKD. However, eGFR decreased significantly more slowly in patients with normal blood pressure than in hypertensive patients (Table 2).
Multivariate analysis revealed that mean serum phosphate, PTH levels, and proteinuria were strongly associated with a steeper slope of eGFR decline (Table 3).
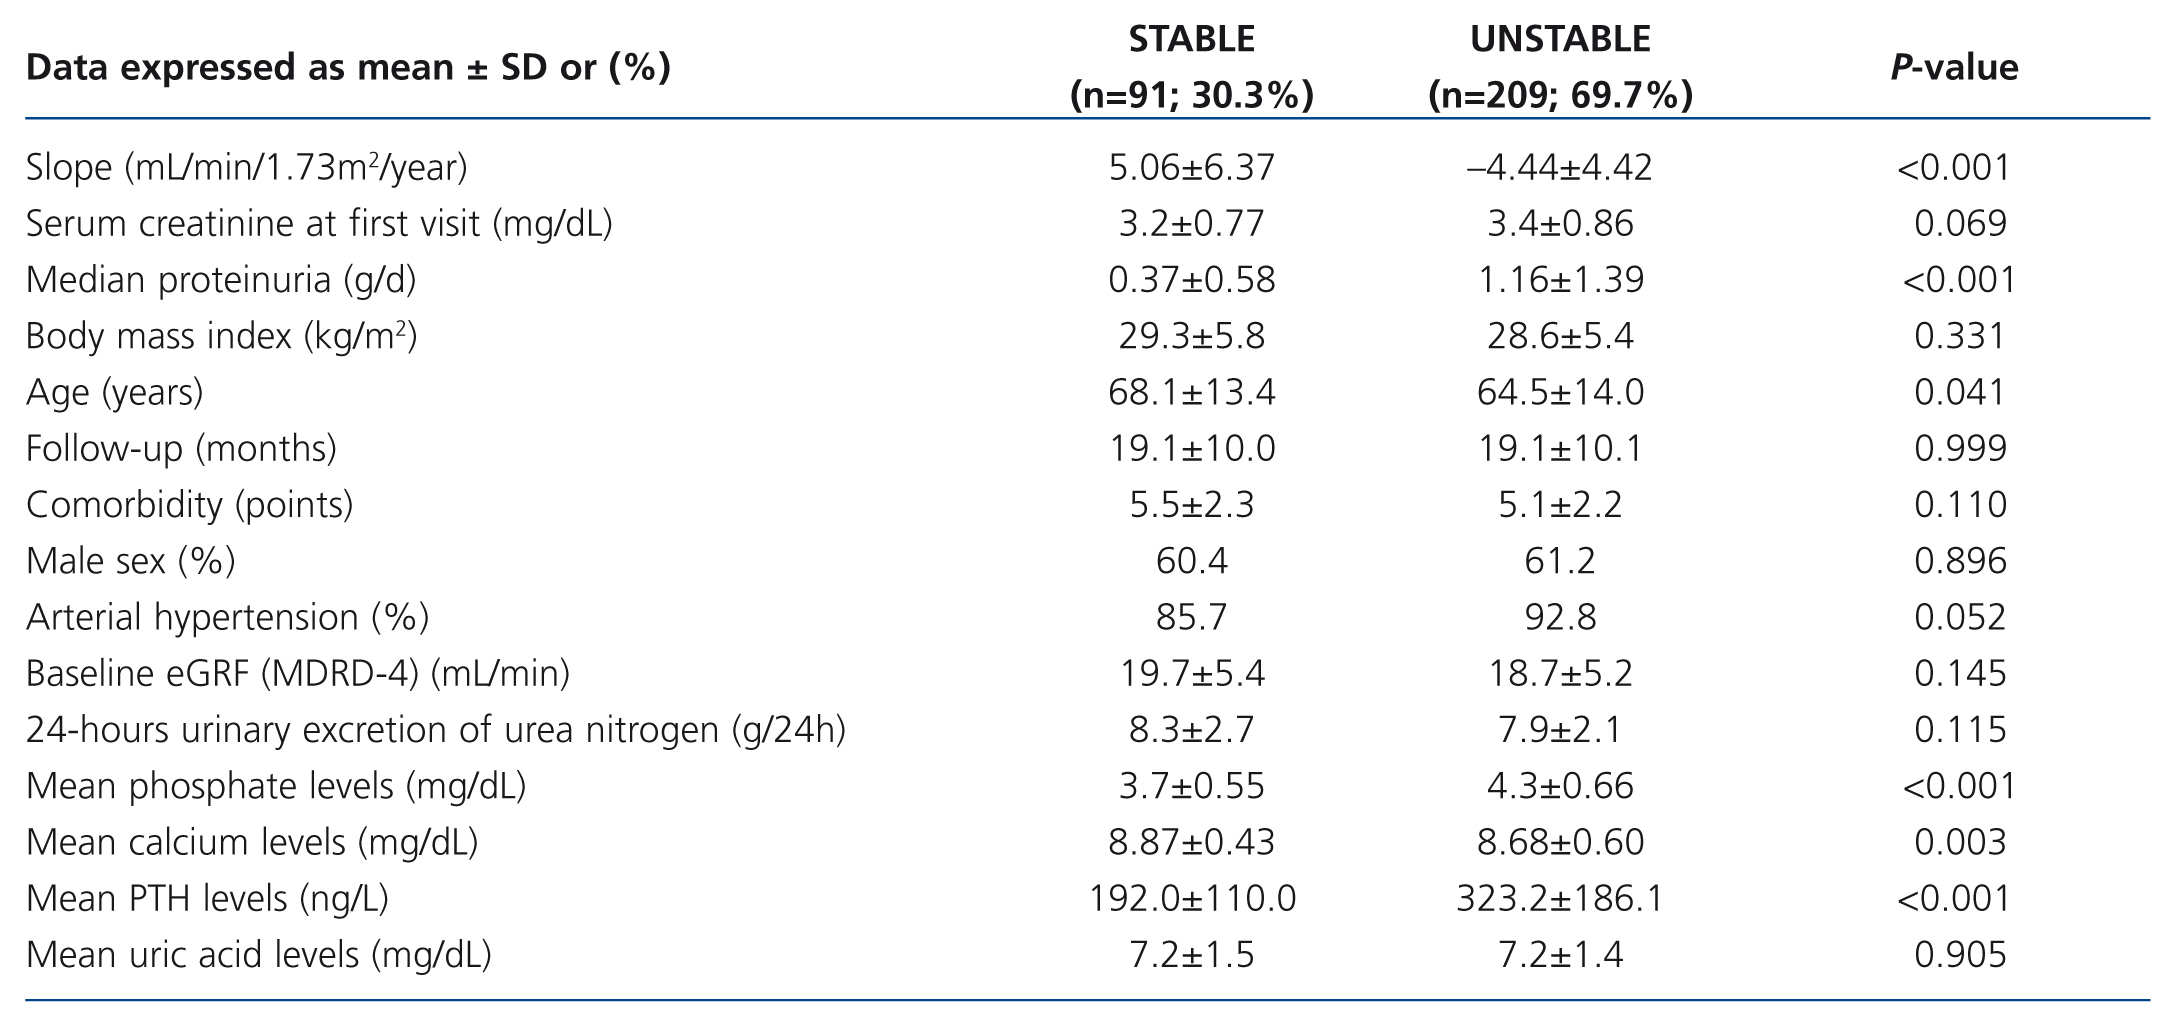
Patients with a stable eGFR had lower values for mean proteinuria, serum phosphate, and PTH levels, but higher values for mean serum calcium (Table 4). They were also older, with lower percentages of arterial hypertension than patients with unstable eGFR, although these data were not significant in the multivariate logistic regression analysis (Table 5).
DISCUSSION
In our large sample, we found that mean serum levels of phosphate and PTH and median proteinuria were closely associated with a faster decrease in renal function in advanced CKD (stages 4-5). Hypertensive patients showed more accelerated impairment of renal function, in proportion with the number of antihypertensive drugs, although this association did not remain significant in the multivariate analysis. Moreover, we did not find any association with comorbidity, body mass index, diabetes mellitus, or gender.
In patients with advanced CKD, serum creatinine values and eGFR can vary widely. For this reason, those studies that calculate the decline in renal function based on only 2 serum creatinine determinations cannot adequately represent progression of CKD. Consequently, we excluded patients with fewer than 4 MDRD-4 determinations before calculating the slope of progression of renal function. The median number of MDRD determinations per patient during the study period was higher than 11, and patients were followed for a mean of 1.6 years, that is, each patient underwent an analytical determination at least every 2 months.
Although the mean decrease in renal function (–1.64 mL/min/1.73m2/year) seems slow, mean baseline eGFR was 22.5mL/min/1.73m2. In advanced stages of CKD, the same changes in serum creatinine (mg/dL) resulted in smaller changes in eGFR. The effort in intensive medical surveillance and treatment in our outpatient unit meant that about 30% of our population had a stable eGFR.
Serum phosphate and PTH levels can vary widely over time owing to factors such as dietary intake or phosphate binders. In order to compensate this variation, other groups apply a time-dependent Cox proportional hazards model based on all measured laboratory values,9 and we worked with these values as a mean.
The role of bone metabolism in decreasing renal function remains unclear. Identification of FGF-23 and Klotho expression might improve our understanding of the pathogenesis and progression of CKD.10 In an observational study, Schwarz et al.11 reported accelerated impairment of renal function in men with CKD (stages 1-5) and serum phosphate >3.8mg/dL. Moreover, Voormolen et al.12 found that for each mg/dl increase in serum phosphate level, renal function decreased by 0.154mL/min/month. Furthermore, in 333 patients with GFR <50mL/min, Lorenzo et al.13 found that the risk of reaching ESRD was 2.1-fold higher for each mg/dl increase in serum phosphate levels. In a post hoc analysis of the randomized Ramipril Efficacy in Nephropathy (REIN) study, Zoccali et al.14 suggested that baseline serum phosphate was an independent risk factor for progression of renal disease. Our data are consistent with these results and show a strong association between progression of CKD and mean serum phosphate and PTH levels.
Recent studies suggested the major role of FGF-2315,16 and Klotho expression17 in the development of ESRD, because of their involvement in the regulation of bone metabolism. Further intervention studies are needed to determine whether more intensive surveillance of phosphate and control of PTH could prevent impairment of renal function.
Proteinuria is the best-known and most studied risk factor for progression of CKD. It has consistently predicted renal outcome in both diabetic and non-diabetic patients.18,19 Secondary analysis of data from the RENAAL study revealed that patients with high baseline proteinuria (≥3.0g/g creatinine)—adjusted for demographic, analytical, and clinical data— had a 5.2-fold higher risk of progressing to ESRD and an 8.1-fold higher risk of developing CKD than patients with low baseline albuminuria (<1.5g/g creatinine). Furthermore, the authors reported that each 50% reduction in albuminuria during the first 6 months represented a 36% decrease in the risk of developing ESRD and a 45% decrease in the risk of developing CKD.20 Lorenzo et al.13 showed that diabetic patients without proteinuria presented the same rate of progression as non-diabetic patients when they were stratified according to albuminuria. Small increases in proteinuria are associated with significant acceleration of the rate of progression. Our results agree with those of the studies discussed above.
Restricted dietary protein intake is generally recommended in patients with CKD. However, although the primary analysis of the MDRD Study Group,21 which was designed to investigate the renoprotective potential of dietary protein restriction in patients with CKD, revealed no significant difference in the mean decrease in GFR, the secondary analysis suggested that low dietary protein intake could delay the decline in GFR.22 Our multivariate analysis did not reveal a relationship between daily urinary excretion of urea nitrogen and the rate of progression, leading us to assume that the optimal dietary recommendation for CKD patients should ensure adequate protein intake. Probably only diets with high phosphate content could be involved in the loss of renal function. This hypothesis should explain the relationship between FGF-23 and progression in CKD.5,15
Although we did not find an association between age and the rate of decrease in eGFR in our patients overall, those with stable eGFR were significantly older. The youngest patients had more aggressive etiologies, such as autosomal dominant polycystic kidney disease and glomerulonephritis. El-Ghoul et al.23 studied a cohort of elderly patients (>80 years) with stages 4 and 5 CKD and found that more than 33% did not progress to ESRD. Low proteinuria, adequate control of blood pressure, and low cardiovascular comorbidity were associated with non-progression. Interestingly, in some studies, it seems that there are no differences between conservative management and renal replacement therapy in the survival of elderly patients with stage 5 CKD.24,25 Thus, older age appears to act as an initiating factor of CKD but not necessarily a perpetuating one.3,26
Elevated systemic bl≤ood pressure has long been recognized as an important factor in the progression of CKD.25 In the MDRD study, the primary analysis found no significant difference between rates of progression of CKD during 2.2 years of follow-up in patients with low target blood pressure versus those patients receiving standard treatment. Moreover, the secondary analysis revealed a significant reduction in the risk of progressing to ESRD in patients with high proteinuria and low target blood pressure. This finding would suggest that proteinuria—and not hypertension—is the real risk factor.27 Our data are consistent with this hypothesis, because the association with hypertension and the number of antihypertensive drugs disappeared in the multivariate analysis.
Low comorbidity may be associated with a decreased risk of progression of CKD.25 We did not find an association between comorbidity and the rate of decline in eGFR, possibly because the Charlson index is not a suitable index for calculating the impact of comorbidity in CKD patients.
The results of previous studies are contradictory with regard to the role of gender,28-30 obesity, statin therapy, anemia,31 and uric acid levels. We did not find significant differences for these factors.
As our study was an association analysis, we were unable to distinguish the causes and consequences of the associations identified. However, the strong association between the rate of decrease in renal function and levels of phosphate, PTH, and proteinuria must be borne in mind when deciding on therapy, because each of these factors can be modified with appropriate treatment. Specialized advanced CKD outpatient units could help to decrease progression of CKD, delay initiation of renal replacement therapy, and reduce costs. These units attempt to identify those patients with slow progression of CKD in order to avoid aggressive approaches such as prompt renal replacement therapy. Patients who could benefit from earlier referral to the advanced CKD outpatient units are younger, with a glomerular etiology and autosomal dominant polycystic disease and high levels of serum phosphate and proteinuria.
Conflicts of interest
The authors declare that they have no conflicts of interest related to the contents of this article.
Table 1. Baseline demographic and clinical characteristics (n=300)
Table 2. Correlation between the rate of progression of CKD and the variables studied
Table 3. Multivariate analysis by Lineal Regression. Factors associated with the rate of decline in eGFR
Table 4. Patient characteristics according to the rate of decline in eGFR
Table 5. Logistic regression of factors related with stable eGFR (positive slope of regression line)


