


Studies on the prevalence of anaemia in chronic kidney disease in adults not on dialysis (CKD-ND) and in dialysis programmes (CKD-D) in Spain are not recent or focus on certain subgroups. The aim of this study was to know the epidemiology and current treatment patterns of anaemia associated with CKD in Spain.
Materials and methodsMulticentre, non-interventional, retrospective study with CKD-ND stage 3a-5 and CKD-D patients treated in Spain between 2015 and 2017 (RIKAS study).
ResultsThe prevalence of anaemia in CKD-ND and CKD-D in 2015 was 33.8% and 91.5%, respectively, with similar results during 2016−2017. The prevalence of systemic inflammation in anaemic patients (18.1% and 51.8% for CKD-ND and CKD-D, respectively) was higher, especially in those treated with erythropoiesis-stimulating agents (ESA), compared to the general population with CKD-ND. After 12 months of follow-up, mean ferritin and transferrin saturation index (TSI) values in anaemic patients with CKD-ND were 187.1 ng/mL and 22.2%, respectively, while in CKD-D were 254.6 ng/mL and 20.2%. In ESA-treated patients, mean values were 190.6 ng/mL and 22.0% in ND-CKD, and 255.0 ng/mL and 20.2% in D-CKD.
ConclusionsThe prevalence of anaemia and inflammation increased with the disease severity, being higher in D-CKD. Iron parameters in anaemic patients treated or not with ESA are insufficient according to the guidelines, so there is room for improvement in the treatment of anaemia associated with CKD.
Los estudios sobre la prevalencia de anemia en enfermedad renal crónica en adultos no en diálisis (ERC-ND) y en programa de diálisis (ERC-D) en España no son recientes, o se centran en ciertos subgrupos. El objetivo fue conocer la epidemiología y patrones actuales de tratamiento de la anemia asociada ala ERC en España.
Materiales y métodosEstudio multicéntrico, no intervencionista, retrospectivo con pacientes ERC-ND estadios 3a-5 y ERC-D, atendidos en España entre 2015 y 2017 (estudio RIKAS).
ResultadosLa prevalencia de anemia en ERC-ND y ERC-D en 2015 fue 33,8% y 91,5%, respectivamente, con resultados similares durante 2016−2017. La prevalencia de inflamación sistémica en pacientes anémicos (18,1% y 51,8% para ERC-ND y ERC-D, respectivamente) fue superior, especialmente en aquellos tratados con agentes estimuladores de eritropoyesis (AEE), respecto a la población general con ERC-ND. Tras 12 meses de seguimiento, los valores medios de ferritina e índice de saturación de transferrina (IST) en pacientes anémicos con ERC-ND fueron 187,1 ng/mL y 22,2%, respectivamente; mientras que en ERC-D fueron 254,6 ng/mL y 20,2%. En pacientes tratados con AEE, los valores medios fueron 190,6 ng/mL y 22,0% en ERC-ND, y 255,0 ng/mL y 20,2% en ERC-D.
ConclusionesLa prevalencia de anemia e inflamación aumentan con la severidad de la enfermedad, siendo mayores en ERC-D. Los parámetros férricos en pacientes anémicos tratados o no con AEE son insuficientes según las guías, por lo que existe un margen de mejora para el tratamiento de la anemia asociada a la ERC.
Anemia is one of the most common complications in chronic kidney disease (CKD), being more prevalent as the disease progresses.1 The causes of anemia associated with CKD are diverse. Classically, an inadequate production of endogenous erythropoietin was recognized as the main cause. However, in recent years other contributing factors have been recognized, such as decreased bone marrow erythropoietic response, absolute or functional iron deficiency and shortened red blood cell lifespan, among others.2,3 Anemia in CKD leads to reduced quality of life, increased risk of cardiovascular disease and progression to end-stage CKD, increased hospitalization and mortality rates, as well as cognitive impairment.4–7
CKD has an overall prevalence that is ranging between 11 and 13%, with the majority of patients at stage 3.8,9 In Spain, the EPIRCE (2010)10,11 and ENRICA (2018)12 studies have evaluated this prevalence, denoting its increase over time in our country.
With respect to anemia, although there are studies in Spain that analyze its prevalence in CKD, there are limitations in the available data. These publications are old or are limited to a specific population of patients.13–17 The MERENA study (2011) estimated this comorbidity in CKD stages 3 and 4 (43.7% and 58.1%, respectively).14 The NADIR study (2013) analyzed the incidence of anemia in patients with CKD stage3 (35% in 36 months).13,15 Shortly thereafter, the MICENAS study (2014) evaluated the prevalence of anemia (58.5%) and its clinical management in patients with CKD stages 3–5.16 In 2017, Guerrero et al.17 estimated the prevalence in patients with CKD stage 3a-5 and older than 90 years at 35.7%.
In this context, iron therapy and erythropoiesis-stimulating agents (ESA) have been widely used, especially in combination, for the treatment of renal anemia.1 However, the use of iron for the treatment of renal anemia is not optimal, as iron parameters are not adequately corrected.18 Furthermore, the literature on epidemiology and treatment of anemia in Spain is not recent and it is limited.10–17 The aim of the present study was to evaluate the prevalence and incidence of anemia in CKD, as well as to characterize the subpopulation with anemia and its management in real clinical practice in Spain.
Material and methodsStudy designTwo types of populations were defined. The population with incident CKD were those that began the disease at inclusion in the study (in this individuals there were no CKD records during the year preceding inclusion). The prevalent population already had CKD on January 1, 2015, January 1, 2016, and January 1, 2017. To estimate the incidence of these outcomes, dynamic cohorts were constructed. This allowed patients to enter and/or exit a cohort during half of the study period. Similarly, patients with incident anemia were so at the time of inclusion in the study (did not have anemia during the preceding year). Patients with prevalent anemia were already anemic as of January 1, 2015. Incident anemic patients treated with ESAs were those who received the first prescription during the year of inclusion in the study (no precedent of treatment in the previous year). In this case, prevalent patients were those whose first prescription occurred before January 1, 2015.
These estimates were standardized by age and sex with respect to the population of Spain. Patients in the cohort of interest were indexed as of January 1 of each year if they had a history of diagnosis/treatment or at the first diagnosis/treatment occurring in that year. Patients who had a history of the event before the indexing date were excluded from the calculation in order to create a cohort of patients at risk. Patients in the cohort were followed from their index date to the first event date in the database, 12 months after indexing, death, transplantation, dialysis (non-dialysis CKD [ND-CKD] cohorts only), or last observation (whichever occurred first).
Patient inclusion criteria included: subjects older than 18 years with ND-CKD in stages 3a-5 or CKD in dialysis program (D-CKD), at any time during the study period (from January 1, 2015 to December 31, 2017). In order to be part of the prevalent cohorts (belonging to the years 2015, 2016, 2017) patients had to meet the inclusion criteria (2015–2017), and have no prior evidence of cancer (or be on chemotherapy treatment) before the indexing date. Additionally, patients could not be permanently institutionalized during 2015–2017, nor have received a transplant or have iron deficiency anemia at any point prior to indexing.
Data collection and variables evaluatedThe data were extracted from anonymized medical reports in Spain included in the BIG-PAC database®,19 which contains anonymized data of 1.9 million patients in the country, from seven autonomous communities. It has been shown that the use of this database is acceptable in terms of representativeness of the population, so that the results can be projected directly onto the whole.20 Data were extracted, and patients were followed up using a unique administrative identifier.
The primary objective was to estimate the incidence and prevalence of anemia associated with ND-CKD (3a-5) and D-CKD in the general population for the years 2015, 2016 and 2017.
The secondary objectives were: to describe the prevalence and incidence of CKD in the general population, as well as the prevalence and incidence of anemia in patients diagnosed with CKD and of treatment with erythropoiesis-stimulating agents (ESA) in anemic patients with CKD; to describe clinical and demographic characteristics; to describe treatment patterns for anemia associated with CKD, and in particular in patients treated with ESA.
Regarding clinical and demographic characteristics, the presence or absence of the following comorbidities were collected, presented together with their International Classification of Diseases (ICD) code: history of arterial hypertension (ICD-10: I10-15), rheumatoid arthritis (ICD-10: M05-M06), type 2 diabetes mellitus (ICD-10: M06), dyslipidemia (ICD-10: E78), obesity (ICD-10: E66), cardiovascular disease (ischemic heart disease) [ICD-10: I20], acute myocardial infarction [ICD-10: I21-22], cerebrovascular accident [ICD-10: I61-I64], stroke [ICD-10: I63], peripheral arterial disease [ICD-10: I73.9], heart failure [ICD-10: I50]), depression (ICD-10: F34.1), chronic obstructive pulmonary disease (ICD-10: J41-42, J44), and osteoporosis (ICD-10: M80-82).
Concerning the variables analyzed, the patient was considered to be anemic if there was a diagnosis and/or at least two consecutive measurements of hemoglobin (Hb) <13 g/dl (8.1 mmol/l) for men and <12 g/dl (7.5 mmol/l) for women according to the KDIGO guidelines, and/or at least two treatments for anemia (e.g., intravenous iron and/or ESA). Patients were classified into the different CKD stages according to the KDIGO guidelines using the estimated glomerular filtration rate (eGFR) value: 3a (45−59 ml/min/1.73m2), 3b (30−44 ml/min/1.73m2), 4 (15−29 ml/min/1.73m2), 5 (<15 ml/min/1.73m2). The erythropoietin resistance index (ERI) was calculated as the weekly ESA dose in relation to patient weight and hemoglobin levels (weekly ESA dose /weight (kg) /Hb [g/dl]). To homogenize information on ESA doses, there were conversion factors used to express doses in international units (IU). If the patient received weekly darbepoetin, this value was multiplied by 200. In the case of biweekly doses, first the value was divided by two to obtain the dose/week and then the correction factor was applied. If the patient was treated with methoxypolyethylene glycol (MPG)-epoetin beta, the monthly dose was divided by four (dose/week value) and the result was multiplied by 250.
Baseline characteristics refer to the 12 month history of each patient in each cohort. Each identified characteristic was analyzed and presented in tables of descriptive statistics, means, standard deviation (SD) and percentages for categorical variables. Qualitative variables are shown as absolute and relative frequencies, while quantitative variables are expressed as mean and standard deviation.
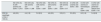
ResultsPrevalence and incidenceThe prevalence and incidence of CKD in the general population in the different cohorts during 2015, 2016 and 2017 are summarized in Table 1.
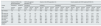
Prevalence and incidence of CKD and anemia associated to CKD in Spain.
| Anemia of CKD in the general population. | CKD in the general population (%) | Anemia in the CKD population (%) | Anemic patients with CKD treated with ESA (%) | ||||||||||||||
|---|---|---|---|---|---|---|---|---|---|---|---|---|---|---|---|---|---|
| Cohort | Prevalence | Incidence | Prevalence | Incidence | Prevalence | Incidence | Prevalence | ||||||||||
| Date | January 2015 | January 2015 | January 2015 | January 2016 | January 2017 | January 2015 | January 2016 | January 2017 | January 2015 | January 2016 | January 2017 | January 2015 | January 2016 | January 2017 | January 2015 | January 2016 | January 2017 |
| ND-CKD(3a-5) | 1.6 | 0.3 | 4.6 | 4.7 | 4.7 | 10.9 | 10.9 | 10.9 | 33.8 | 34.0 | 34.4 | 8.1 | 6.9 | 7.7 | 26.4 | 25.6 | 26.2 |
| ND-CKD (3a) | 0.6 | 0.1 | 2.3 | 2.4 | 2.3 | 7.6 | 7.5 | 6.6 | 26.3 | 26.2 | 26.5 | 5.1 | 3.4 | 4.3 | 18.1 | 15.7 | 16.5 |
| ND-CKD (3b) | 0.5 | 0.09 | 1.5 | 1.5 | 1.5 | 9.6 | 9.9 | 10.3 | 32.8 | 33.4 | 33.7 | 8.9 | 8.8 | 9.2 | 28.7 | 30.1 | 29.1 |
| ND-CKD (4) | 0.4 | 0.08 | 0.7 | 0.7 | 0.7 | 30.9 | 31.7 | 37.0 | 55.0 | 55.6 | 56.4 | 10.4 | 9.5 | 10.2 | 31.2 | 28.8 | 31.9 |
| ND-CKD (5) | 0.08 | 0.02 | 0.1 | 0.1 | 0.1 | 68.8 | 72.0 | 70.0 | 71.8 | 72.5 | 73.4 | 28.0 | 25.1 | 24.2 | 54.3 | 61.9 | 54.3 |
| ND-CKD | 0.03 | 0.001 | 0.04 | 0.04 | 0.04 | 56.4 | 60.9 | 69.7 | 91.5 | 90.7 | 91.3 | 61.5 | 58.0 | 61.4 | 90.0 | 86.0 | 83.7 |
| Hemodialysis | 0.02 | 0.0 | 0.02 | 0.02 | 0.03 | 70.5 | 61.6 | 69.1 | 96.9 | 95.3 | 95.0 | 70.7 | 64.2 | 60.2 | 92.5 | 88.5 | 84.7 |
| Peritoneal dialysis | 0.01 | 0.001 | 0.01 | 0.01 | 0.01 | 51.9 | 60.5 | 70.2 | 82.5 | 82.6 | 84.7 | 53.4 | 50.9 | 63.6 | 85.1 | 81.1 | 81.9 |
ESA: erythropoiesis-stimulating agents; CKD: chronic kidney disease; ND: not on dialysis; D: on dialysis.
The prevalence and incidence of renal anemia in the general population were, respectively, 1.6% and 0.4% for ND-CKD and 0.03% and 0.001% for D-CKD. These values remained stable throughout the period analyzed. The prevalence and incidence of anemia in the ND-CKD population remained stable: (∼34 and 10.9%, respectively). The prevalence of anemia increased as renal function worsened, being 71.8–73.4% in ND-CKD stage 5 patients. In the case of D-CKD the prevalence was stable (∼91%), with an incidence ranging 56.4–69.7 % depending on the year considered. During the study period, the prevalence in hemodialysis (HD) patients remained stable (∼95.5%), with an incidence of 61.6–70.5% depending on the year considered. In peritoneal dialysis (PD) the prevalence was ∼83%, with an increasing incidence.
The prevalence of anemic patients with ND-CKD treated with ESAs remained around 26%, with an incidence of ∼8%. The use of ESA increased with the severity of CKD in the range of 15.7–18.1% in stage 3a, and up to 54.3–61.9% in stage 5. In patients with D-CKD the prevalence remained around 85%, with an incidence was close to 61%. For both parameters, the percentage in patients in HD was higher than in PD.
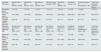
Demographic and clinical characteristics of patientsDemographic and clinical characteristics of the patients are summarized in Table 2. The mean age of anemic patients with ND-CKD and D-CKD was 78.0 and 68.2 years, respectively. In the anemic population on ESA treatment the mean age was 73.3 and 65.4 years. Overall, the percentage of males was higher than females in each cohort.
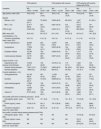
Demographic and clinical characteristics of patients in the prevalent population. Prevalence and incidence data are provided as of January 1 of each year.
| CKD patients | CKD patients with anemia | CKD patients with anemia treated with ESAs | ||||
|---|---|---|---|---|---|---|
| Variables | ND-CKDn = 37,664 | D-CKDn = 326 | ND-CKDn = 12,730 | D-CKDn = 280 | ND-CKDn = 3,362 | D-CKDn = 252 |
| Age (years), mean (SD) | 78.2 (10.5) | 68.1 (10.6) | 78.0 (11.5) | 68.2 (10.6) | 73.3 (12.4) | 65.4 (15.9) |
| Gender | ||||||
| Women, n (%). | 16,233 (43.1) | 79 (25.8) | 5,929 (46.6) | 68 (24.3) | 1,347 (40.1) | 91 (36.1) |
| Men, n (%). | 21,417 (56.9) | 227 (74.2) | 6,801 (53.4) | 212 (75.7) | 2,015 (60.0) | 161 (63.9) |
| CRP>5 mg/l | 2,505 (9.9) | 181 (55.5) | 2,302 (18.1) | 145 (51.8) | 983 (29.2) | 121 (48.0) |
| BMI, mean (SD) | 24.4 (4.3) | 20.3 (3.7) | 24.1 (4.5) | 19.8 (3.3) | 23.5 (4.7) | 18.1 (2.6) |
| Comorbidities, n (%) | ||||||
| Charlson comorbidity index, mean (SD). | 4.0 (1.4) | 4.2 (1.4) | 4.0 (1.4) | 4.2 (1.4) | 4.1 (1.5) | 4.3 (1.5) |
| Arterial hypertension. | 29,649 (78.7) | 224 (73.2) | 10,061 (79.0) | 202 (72.1) | 2,566 (76.3) | 184 (73.0) |
| Dyslipidemia | 17,236 (45.8) | 144 (47.1) | 5,833 (45.8) | 134 (47.9) | 1,309 (38.9) | 121 (48.0) |
| Diabetes mellitus | 16,780 (44.6) | 155 (50.7) | 5,666 (44.5) | 141 (50.4) | 1,417 (42.2) | 119 (47.2) |
| Cardiovascular disease | 13,771 (36.6) | 253 (82.7) | 5,527 (43.4) | 237 (84.6) | 1,816 (54.0) | 201 (79.8) |
| Cause of CKD, n (%) | ||||||
| Hypertensive and vascular renal disease. | 15,445 (41.0) | 125 (40.9) | 5,218 (41.,0) | 115 (41.1) | 1,524 (45.3) | 125 (49.6) |
| Diabetic kidney disease. | 7,901 (21.0) | 70 (22.9) | 2.609 (20.5) | 64 (22.9) | 837 (24.9) | 65 (25.8) |
| Glomerulopathies. | 1,948 (5.2) | 25 (8.2) | 659 (5.2) | 24 (8.6) | 191 (5.7) | 17 (6.8) |
| Current medication, n (%) | ||||||
| Antihypertensives. | 33,142 (88.0) | 281 (91.8) | 11,505 (90,4) | 257 (91.8) | 3,125 (93.0) | 231 (91.7) |
| Diuretics | 16,441 (43.7) | 16 (4.9) | 6,668 (52.,4) | 13 (4.6) | 2,324 (69.1) | 7 (2.8) |
| Lipid-lowering agents | 17,694 (47.0) | 139 (45.4) | 6,023 (47.3) | 131 (46.8) | 1,363 (40.5) | 127 (50.4) |
| Antidiabetics | 14,492 (38.5) | 133 (43.5) | 4,912 (38.6) | 122 (43.6) | 1,221 (36.3) | 107 (42.5) |
| Vitamin D | 9,737 (25.9) | 196 (64.1) | 4,515 (35.5) | 183 (65.4) | 1,830 (54.4) | 154 (61.1) |
| Iron profile at the time of indexing (January 1, 2015). | ||||||
| Hemoglobin (g/dL), mean (SD). | 12.6 (1.6) | 12.1 (0.2) | 11.3 (1.2) | 12.1 (0.1) | 10.5 (0.8) | 12.1 (0.2) |
| Ferritin (ng/mL), mean (SD). | 172.8 (31.9) | 241.3 (41.3) | 187.3 (35.6) | 256.0 (44.7) | 198.3 (40.2) | 268.6 (46.0) |
| Transferrin saturation index (%), mean (SD). | 24.8 (1.5) | 22.0 (1.3) | 21.8 (1.6) | 19.9 (1.2) | 20.7 (1.4) | 19.5 (1.1) |
| Iron profile 3 months before starting treatment with ESAs | ||||||
| Hemoglobin (g/dL). mean (SD). | NA | NA | NA | NA | 10.6 (0.8) | 9.6 (0.5) |
| Ferritin (ng/mL), mean (SD). | NA | NA | NA | NA | 181.8 (29.9) | 248.1 (29.0) |
| Transferrin saturation index (%). mean (SD). | NA | NA | NA | NA | 20.9 (2.5) | 21.0 (2.5) |
BMI, body mass index; CKD, chronic kidney disease; ESA, erythropoiesis-stimulating agents; CRP, C-reactive protein; NA, not applicable; SD, standard deviation; ND, not on dialysis; D, on dialysis; SD, standard deviation.
All cohorts presented a Charlson comorbidity index around 4. The most prevalent comorbidities were arterial hypertension, dyslipidemia, diabetes mellitus, and cardiovascular disease in varying proportions. Consistent with these pathologies, the most commonly used medications in all cohorts were antihypertensive agents, diuretics, lipid-lowering agents, antidiabetics, and vitamin D. Regarding the cause of renal disease, the most prevalent was hypertensive and vascular disease (range: 40.9–49.6 %), followed by diabetes mellitus (range: 20.5–25.8%).
Mean ferritin and transferrin saturation index (TSAT) levels in the ND-CKD populations were 172.8 ng/mL and 24.8%, respectively. The data for the subgroup with D-CKD were 241.3 ng/mL and 22.0%. In anemic ND-CKD patients, the values were 187.3 ng/mL and 21.8%, respectively. The mean baseline ferritin and TSAT level for anemic patients with D-CKD was 256.0 ng/mL and 19.9%. Under ESA treatment, the data were 198.3 ng/mL and 20.7% for ND-CKD and 268.6 ng/mL and 19.5% for D-CKD.
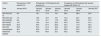
The prevalence of inflammation (defined by C-reactive protein levels higher than 5 mg/l) in the population with ND-CKD and D-CKD was 9.9% and 55.5%, respectively (year 2015). In the group with anemia, the values remained stable during the study period (∼18% and ∼54%, respectively; Table 3). The prevalence in anemic patients treated with ESA was ∼29% and ∼48%, respectively. In ND-CKD patients the prevalence of inflammation was higher in anemic patients (being even more prominent if they were on ESAs) versus the general ND-CKD population. In addition, D-CKD patients, regardless of anemic status or ESA treatment, had a higher prevalence of inflammation than those with ND-CKD.
Prevalence of patients with C-reactive protein values higher than 5 mg/l in the population of patients with CKD, with CKD-associated anemia and anemic patients treated with ESAs.
| Cohort | Prevalence in CKD patients (%) | Prevalence in CKD patients with anemia (%) | Prevalence in CKD patients with anemia treated with ESAs (%) | ||||
|---|---|---|---|---|---|---|---|
| Date | January 2015 | January 2015 | January 2016 | January 2017 | January 2015 | January 2016 | January 2017 |
| ND-CKD (3a-5) | 9.9 | 18.1 | 17.9 | 18.1 | 29.2 | 29.6 | 29.4 |
| ND-CKD (3a) | 7.3 | 16.3 | 15.6 | 16.1 | 19.2 | 22.7 | 22.4 |
| ND-CKD(3b) | 8.0 | 17.9 | 18.1 | 17.8 | 28.9 | 25.8 | 27.0 |
| ND-CKD(4) | 19.1 | 19.6 | 19.4 | 20.0 | 40.9 | 45.6 | 41.0 |
| ND-CKD(5) | 30.4 | 25.4 | 27.5 | 26.5 | 23.4 | 17.8 | 20.5 |
| ND-CKD | 55.5 | 51.8 | 51.8 | 56.5 | 48.0 | 48.3 | 48.9 |
| Hemodialysis | 58.1 | 53.8 | 53.3 | 58.7 | 50.6 | 50.3 | 51.3 |
| Peritoneal dialysis | 51.2 | 47.9 | 48.9 | 52.1 | 42.5 | 43.8 | 44.2 |
ESA: erythropoiesis-stimulating agents; CKD: chronic kidney disease; ND: not on dialysis; D: on dialysis.
Prevalence and incidence data are provided as of January 1 of each year. Follow-up of patients is considered for 12 months from January 1 of each year.
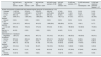
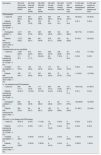
The treatments for the prevalent population followed throughout 2015 for 12 months is shown in Table 4, with additional information on patients treated with ESA presented in Appendix Supplementary Appendix A, Table 1. Anemic patients with ND-CKD and D-CKD were treated with oral iron (58.5% and 3.5%, respectively), intravenous iron (1.8% and 6.0%), ESA with oral iron (10.7% and 7.9%), or ESA with intravenous iron (3.4% and 62.9%).
Treatment regimen and transfusion requirements in patients with anemia associated with CKD in the prevalent population during 12-month follow-up.
| ND-CKD (3a-5) with anemian = 20,303 | ND-CKD (3a) with anemian = 7,814 | ND-CKD (3b) with anemian = 6,331 | ND-CKD (4) with anemian = 5,186 | ND-CKD (5)with anemian = 972 | D-CKD with anemian = 315 | D-CKD with anemia on hemodialysisn = 198 | D-CKD with anemia on peritoneal dialysisn = 117 | |
|---|---|---|---|---|---|---|---|---|
| Number and proportion of patients with each treatment regimen during the 12-month follow-up, n (%). | ||||||||
| Untreated | 1,145 (5.6) | 470 (6.0) | 379 (6.0) | 249 (4.8) | 47 (4.8) | 0 (0.0) | 0 (0.0) | 0 (0.0) |
| Oral iron | 11,875 (58.5) | 5,323 (68.1) | 3,719 (58.7) | 2,573 (49.6) | 260 (26.8) | 11 (3.5) | 6 (3.0) | 5 (4.3) |
| I.v. iron. | 364 (1.8) | 0 (0.0) | 102 (1.6) | 200 (3.9) | 62 (6.4) | 19 (6.0) | 12 (6.1) | 7 (6.0) |
| ESA treatment | 4,000 (19.7) | 1,520 (19.5) | 1,583 (25.0) | 788 (15.2) | 109 (11.2) | 57 (18.1) | 35 (17.7) | 22 (18.8) |
| Oral and i.v. iron. | 0 (0.0) | 0 (0.0) | 0 (0.0) | 0 (0.0) | 0 (0.0) | 0 (0.0) | 0 (0.0) | 0 (0.0) |
| Oral iron and ESA. | 2,181 (10.7) | 345 (4.4) | 401 (6.3) | 1,066 (20.6) | 369 (38.0) | 25 (7.9) | 16 (8.1) | 9 (7.7) |
| I.v. iron and ESA. | 693 (3.4) | 155 (2.0) | 147 (2.3) | 310 (6.0) | 81 (8.3) | 198 (62.9) | 124 (62.6) | 74 (63.3) |
| Oral iron. i.v. and ESA. | 44 (0.2) | 0 (0.0) | 0 (0.0) | 0 (0.0) | 44 (4.5) | 5 (1.6) | 5 (2.5) | 0 (0.0) |
| Administration of > 1 transfusion | ||||||||
| Regardless of treatment. | 1,851 (9.1) | 306 (3.9) | 467 (7.4) | 727 (14.0) | 351 (36.1) | 168 (53.3) | 108 (54.6) | 60 (51.3) |
| Oral iron | 997 (8.4) | 222 (4.2) | 295 (7.9) | 378 (14.7) | 102 (39.2) | 8 (72.7) | 5 (83.3) | 3 (60.0) |
| I.v. iron. | 71 (19.5) | 0 (0.0) | 8 (7.8) | 34 (17.0) | 29 (46.8) | 15 (79.0) | 9 (75.0) | 6 (85.7) |
| ESA treatment | 286 (7.2) | 55 (3.6) | 91 (5.8) | 107 (13.6) | 33 (30.3) | 22 (38.6) | 14 (40.0) | 8 (36.4) |
| Oral iron and ESA. | 310 (14.2) | 11 (3.2) | 35 (8.7) | 134 (12.6) | 130 (35.2) | 14 (56.0) | 11 (68.8) | 3 (33.3) |
| I.v. iron and ESA. | 84 (12.1) | 2 (1.3) | 14 (9.5) | 38 (12.3) | 30 (37.0) | 107 (54.0) | 67 (54.0) | 40 (54.0) |
| Oral iron. i.v. and ESA. | 12 (27.3) | 0 (0.0) | 0 (0.0) | 0 (0.0) | 12 (27.3) | 2 (40.0) | 2 (40.0) | 0 (0.0) |
ESA: erythropoiesis-stimulating agents; CKD: chronic kidney disease; IV: intravenous; ND: not on dialysis; D: on dialysis.
In the group of patients treated with ESAs, recombinant human erythropoietin (rHuEPO) was the most commonly used in both subgroups (46.6% and 46.2% for ND-CKD and D-CKD, respectively), followed by darbepoetin alfa (30.1% and 30.0%) and methoxypolyethylene glycol (MPG)-epoetin beta (23.4% and 23.8%; Appendix A, Supplementary Table 2). The doses used are detailed in Fig. 1 and the mean is shown in Appendix A Supplementary Table 3. The patterns of ESA treatment in anemic patients with ND-CKD (3a-5) and D-CKD are shown in Fig. 2. The majority of patients maintained the initial treatment and very few were changed to a second or third line of treatment. In patients treated with ESA the mean ERI was 4.8 and 5.5 IU week/kg/g Hb in dl, respectively (Table 5).

 ND-CKD (3a-5), and (b) D-CKD.")
Erythropoietin resistance index during the follow-up period.
| ND-CKD (3a-5) with anemia and ESAn = 5,413 | ND-CKD (3a) with anemia and ESAn = 1,408 | ND-CKD (3b) with anemia and ESAn = 1,897 | ND-CKD (4) with anemia and ESAn = 1,591 | ND-CKD (5) with anemia and ESAn = 517 | D-CKD with anemia and ESAn = 303 | D-CKD with anemia on hemodialysis and ESAn = 202 | D-CKD with anemia on peritoneal dialysis and ESAn = 101 | |
|---|---|---|---|---|---|---|---|---|
| ERIa(IU week/kg/g of Hb in 100 ml) | 4.8 (2.0) | 4.4 (1.9) | 5.0 (2.0) | 4.6 (2.0) | 5.5 (2.1) | 5.5 (2.5) | 6.0 (1.6) | 5.4 (2.8) |
ESA: erythropoiesis-stimulating agents; CKD: chronic kidney disease; Hb: hemoglobin; ND: not on dialysis; D: dialysis; IU: international units.
Results of hemoglobin and iron parameters of anemia treatment at 12 months of follow-up.
These data are detailed in Table 6. At 12 months of follow-up, the mean values of ferritin and TSAT in patients with ND-CKD were 187.1 ng/mL and 22.2%, respectively. In patients with D-CKD were 254.6 ng/mL and 20.2%. In ESA-treated patients, mean ferritin and TSAT values were 190.6 ng/mL and 22.0% in ND-CKDR, and 255.0 ng/mL and 20.2% in those with D-CKD.
Results of treatment of the anemia associated with CKD during follow-up.
| Population with anemia | ND-CKD (3a-5) with anemian = 20,303 | ND-CKD (3a) with anemian = 7,814 | ND-CKD (3b) with anemian = 6,331 | ND-CKD (4) with anemian = 5,186 | ND-CKD (5) with anemian = 972 | D-CKD with anemian = 315 | D-CKD with anemia on hemodialysisn = 198 | D-CKD with anemia on peritoneal dialysisn = 117 |
|---|---|---|---|---|---|---|---|---|
| Hemoglobin (g/dL), mean (SD) | 11.3 (1.0) | 11.4 (1.0) | 11.3 (1.0) | 11.2 (1.0) | 11.0 (1.0) | 11.3 (0.8) | 11.5 (0.8) | 10.9 (0.8) |
| Ferritin (ng/mL), mean (SD) | 187.1 (35.8) | 176.2 (30.5) | 183.6 (32.2) | 198.7 (34.7) | 238.3 (42.6) | 254.6 (43.6) | 258.1 (43.4) | 248.4 (43.5) |
| Transferrin saturation index (%), mean (SD) | 22.2 (1.8) | 23.2 (1.6) | 22.1 (1.6) | 21.2 (1.5) | 20.1 (1.4) | 20.2 (1.5) | 20.1 (1.4) | 20.4 (1.6) |
| Population with anemia treated with ESA | ND-CKD (3a-5) with anemia and ESAn = 5,413 | ND-CKD (3a) with anemia and ESAn = 1,408 | ND-CKD (3b) with anemia and ESAn = 1,897 | ND-CKD (4) with anemia and ESAn = 1,591 | ND-CKD (5) with anemia and ESAn = 517 | D-CKD with anemia on ESAn = 303 | D-CKD with anemia in hemodialysis on ESAn = 202 | D-CKD with anemia on peritoneal dialysis and ESAn = 101 |
| Hemoglobin (g/dL), mean (SD) | 11.6 (0.9) | 11.8 (1.0) | 11.6 (0.9) | 11.6 (0.9) | 11.3 (0.9) | 11.3 (0.8) | 11.5 (0.8) | 10.9 (0.7) |
| Ferritin (ng/mL), mean (SD) | 190.6 (37.5) | 175.8 (30.0) | 182.8 (32.2) | 199.5 (34.7) | 237.1 (42.2) | 255.0 (43.4) | 257.8 (43.5) | 249.8 (42.9) |
| Transferrin saturation index (%), mean (SD) | 22.0 (1.8) | 23.2 (1.6) | 22.2 (1.6) | 21.1 (1.5) | 20.1 (1.4) | 20.2 (1.5) | 20.2 (1.4) | 20.3 (1.6) |
CKD, chronic kidney disease; ESA, erythropoiesis-stimulating agents; CKD, chronic kidney disease; ND, not on dialysis; D: Dialysis; SD, standard deviation.
This section presents the data of anemic patients treated with ESA (alone or in combination) relative to the maintenance of target hemoglobin levels. The description of these patients according to stage and concomitant treatment is shown in Table 7, the data is obtained in stable patients (those who maintained Hb levels at 10−12 g/dl throughout follow-up), patients with unstable Hb (at least one Hb value < 10 g/dl and at least one value > 12 g/dl during the 12 months of follow-up) and patients with occasional increases or decreses (all Hb values < 12 g/dl and at least one value < 10 g/dl [decrease] or all values > 10 g/dl and at least one value > 12 g/dl [increase]). Among patients with ND-CKD, approximately 10% always maintained target hemoglobin levels, with variations depending on treatment (8.6% for ESA, 8.1% for combination of oral iron and ESA, 6.7% for intravenous iron and ESA, 11.1% for combination of oral, intravenous iron and ESA). In this same subgroup, about 50% maintained target levels most of the time (but with occasional increases or decreases) and about 40% had significant fluctuations in Hb levels. Among patients with D-CKD less than 5% maintained target levels (4.8% for ESA treatment, 0.0% for oral iron and ESA, 1.7% for intravenous iron and ESA, 0.0% for the combination oral iron, intravenous iron and ESA). Approximately 60% experienced Hb oscillations both < 10 g/dl and > 12 g/dl.
Stability of Hb (interval 10–12 g/dl) in stable ESA-treated patients throughout follow-up, stratified by type of treatment and CKD stage.
| Descriptive | ND-CKD (3a-5) with anemia and ESRD | ND-CKD (3a) with anemia and ESRD | ND-CKD (3b) with anemia and ESRD | ND-CKD (4) with anemia and ESA | ND-CKD (5) with anemia and ESA | D-CKD with anemia and ESA | D-CKD with anemia on hemodialysis and ESA | D-CKD with anemia on peritoneal dialysis and ESA |
|---|---|---|---|---|---|---|---|---|
| ESA treatment | ||||||||
| n valid (%) | 3,378 (62.4) | 937 (66.6) | 1,241 (65.4) | 925 (58.1) | 275 (53.2) | 104 (34.3) | 49 (24.3) | 55 (54.5) |
| Patients maintaining hemoglobin 10–12 g/dLa. n (%). | 292 (8.6) | 98 (10.5) | 122 (9.8) | 59 (6.4) | 13 (4.7) | 5 (4.8) | 3 (6.1) | 2 (3.6) |
| Hemoglobin unstableb, n (%). | 1,311 (38.8) | 351 (37.5) | 438 (35.3) | 388 (42.0) | 134 (48.7) | 69 (66.4) | 38 (77.6) | 31 (56.4) |
| Patients with occasional rises or fallsc in Hb, n (%). | 1,775 (52.6) | 488 (52.1) | 681 (54.9) | 478 (51.7) | 128 (46.6) | 30 (28.9) | 8 (16.3) | 22 (40.0) |
| Treatment with oral iron and ESAs | ||||||||
| n valid (%) | 1,367 (25.3) | 316 (22.4) | 474 (25.0) | 438 (27.5) | 139 (26.9) | 18 (5.9) | 1 (0.5) | 17 (16.8) |
| Patients maintaining hemoglobin 10−12 g/dLa, n (%). | 111 (8.1) | 37 (11.7) | 39 (8.2) | 28 (6.4) | 7 (5.0) | 0 (0.0) | 0 (0.0) | 0 (0.0) |
| Unstable hemoglobinb, n (%). | 517 (37.8) | 102 (32.3) | 178 (37.6) | 177 (40.4) | 60 (43.2) | 5 (27.8) | 0 (0.0) | 5 (29.4) |
| Patients with occasional Hb rises or fallsc. n (%). | 739 (54.1) | 177 (56.0) | 257 (54.2) | 233 (53.2) | 72 (51.8) | 13 (72.2) | 1 (100.0) | 12 (70.6) |
| I.v. iron treatment and ESA treatment | ||||||||
| n valid (%) | 632 (11.7) | 149 (10.6) | 171 (9.0) | 209 (13.1) | 103 (19.9) | 173 (57.1) | 146 (72.3) | 27 (26.7) |
| Patients maintaining hemoglobin 10−12 g/dLa, n (%). | 42 (6.7) | 14 (9.4) | 13 (7.6) | 9 (4.3) | 6 (5.8) | 3 (1.7) | 3 (2.1) | 0 (0.0) |
| Hemoglobin unstableb, n (%). | 240 (38.0) | 55 (36.9) | 62 (36.3) | 77 (36.8) | 46 (44.7) | 117 (67.6) | 102 (69.9) | 15 (55.6) |
| Patients with occasional Hb rises or fallsc, n (%). | 350 (55.4) | 80 (53.7) | 96 (56.1) | 123 (58.9) | 51 (49.5) | 53 (30.6) | 41 (28.1) | 12 (44.4) |
| Oral and i.v. iron therapy and ESA therapy | ||||||||
| n valid (%) | 36 (0.7) | 6 (0.4) | 11 (0.6) | 19 (1.2) | 0 (0.0) | 8 (2.6) | 6 (3.0) | 2 (2.0) |
| Patients maintaining hemoglobin 10−12 g/dLa, n (%). | 4 (11.1) | 0 (0.0) | 1 (9.1) | 3 (15.8) | 0 (0.0) | 0 (0.0) | 0 (0.0) | 0 (0.0) |
| Unstable hemoglobinb. n (%). | 13 (36.1) | 3 (50.0) | 3 (27.3) | 7 (36.8) | 0 (0.0) | 4 (50.0) | 3 (50.0) | 1 (50.0) |
| Patients with occasional Hb rises or fallsc, n (%). | 19 (52.8) | 3 (50.0) | 7 (63.6) | 9 (47.4) | 0 (0.0) | 4 (50.0) | 3 (50.0) | 1 (50.0) |
ESA: erythropoiesis-stimulating agents; CKD: chronic kidney disease; IV: intravenous; ND: not on dialysis. D: Dialysis.
Detailed data regarding transfusions in patients with anemia associated with CKD is shown in Table 4. Regardless of treatment, 9.1% and 53.3% of patients with ND-CKD and D-CKD received at least one transfusion. A high frequency of blood transfusions was observed in anemic patients in both the ND-CKD and D-CKD groups, however it is not known whether these transfusions were due to renal anemia or to other causes, such as surgery or acute hemorrhage. The percentage of patients who received at least one blood transfusion increased with the severity of the disease, coinciding with an increasing number of hospitalizations as the renal disease worsened, and especially in dialysis.
DiscussionThis population-based study analyzed the prevalence and incidence of anemia, as well as its treatment, in the Spanish population. In the RIKAS study, the prevalence of ND-CKD stages 3–5 was somewhat lower than in previous studies, although similar in number and distribution to that of the EPIRCE study.12
Other studies analyzed the prevalence of anemia in CKD in Spain. However, these studies are not recent or focus only on certain subgroups of patients. In addition, the definition of anemia is not consistent among the different studies, or it is not specified, and most of them analyze patients attended in outpatient nephrology clinics, unlike this population-based study. Thus, in the MICENAS study, the prevalence of anemia in ND-CKD stage 3–5 patients in Catalonia was 58.5%.16 In general, as the disease progressed, mean hemoglobin levels decreased and ESA use was increased. However, there was no change in the prescription of Iron according to stage. In this study, more than half of the patients were able to correct their anemia with iron supplementation combined with moderate doses of ESA. In the MERENA multicenter observational study of patients with ND-CKD stages 3 and 4, 43.7% and 58.1%, respectively, were anemic,14 of which 16% and 34.1% of the patients received ESA treatment, respectively. Guerrero et al.17 conducted a prospective study in a center in Huesca in 288 patients over 90 years of age, obtaining a prevalence of anemia of 35.7% in stages 3a-5. The results regarding the prevalence of anemia in CKD patients in our study were consistent with previous studies in Spain, although its prevalence was somewhat lower. In this context, it is important to highlight the population base of our study. At international level, this prevalence was higher than that found in the population-based study by Stauffer and Fan,21 based on data from the National Health and Nutrition Examination Survey (NHANES) of the United States, and it was similar to that recently published using the Swedish registry of renal patients.22 Overall, prevalence increased with CKD stage in ND-CKD patients, as shown in previous studies. Anemia was more prevalent among men than women, consistent with previous studies. The demographic data of the RIKAS study population is also consistent with previous analyses. In addition, the most common comorbidities were hypertension, dyslipidemia, diabetes mellitus, and cardiovascular disease.
Regarding data on the incidence of renal anemia in Spain, the single study in the literature is the NADIR study, which evaluated the incidence of anemia in patients with ND-CKD stage 3 in a prospective analysis over 3 years.13,15 During the first year of the study, up to 12.4% of subjects were diagnosed with anemia. Over the 3 year follow-up, half of the patients progressed to stages 4–5, and about 35% were diagnosed with anemia (mostly of renal origin). A significant association was found between the development of anemia and baseline hemoglobin levels, eGFR, and the sex of the patients. In addition, the development of anemia was associated with a more rapid progression of the disease and a higher risk of having a major cardiovascular event. This incidence was slightly higher than the one found in our study for that subgroup of patients (∼7 to 10%). However, our study analyzed the incidence of anemia and ESA treatment in all groups of ND-CKD (3a-5) and D-CKD, and it is a population-based study and not of patients followed in nephrology outpatient clinics. Up to ∼8% and ∼61% of the ND-CKD and D-CKD population initiated ESA treatment during the study period.
An interesting finding of the present study was that anemic patients with ND-CKD had a higher prevalence of inflammation than those without anemia (∼18% vs. ∼10%). Among them, ESA-treated patients were the cohort with the highest prevalence of inflammation (∼29%). Although this could be due, in part, to a worse renal function in anemic patients (treated or not with ESA), as the prevalence of anemia and ESA treatment increased with more advanced stages of the disease. In addition, in the subgroup of patients with D-CKD, all subgroups showed a high prevalence of inflammation (approximately 50%). These values are lower than the reported in the Swedish study on ND-CKD subgroup, but similar to the D-CKD group.22 Inflammation has been associated with a hyporesponsiveness to ESA and the consequent need for higher doses of ESA.22,23
Regarding treatment, the KDIGO guidelines recommend iron supplementation if the TSAT is < 30% and serum ferritin < 500 ng/mL.24 However, the European Renal Best Practice (ERBP) guideline recommends supplementation if there is absolute iron deficiency (TSAT < 20% and ferritin < 100 ng/mL in ND-CKD).25 There is also a recommendation to start iron treatment if there is a desire to increase Hb levels without ESA and ferritin levels are < 200 μ g/l (ferritin < 300 μ g/l if patient is in dialysis) and TSAT < 25% or reduce ESA doses if ferritin < 300 μ g/l and TSAT < 30%.26,27 In our study the mean ferritin and TSAT values were lower than recommended in the guidelines, suggesting an underutilization of iron therapy in this anemic population with CKD in both non-dialysis and dialysis. Consequently, there is an opportunity for improvement to optimize the management of renal anemia.
In order to treat anemia, iron was given to 74.7% of anemic patients with ND-CKD (69.4% oral and 5.2% intravenous) and 81.9% of anemic patients with D-CKD (13% oral and 68.9% intravenous) and 33.8% of anemic patients with ND-CKD and 88.9% of anemic patients with D-CKD received ESA. It should be noted that it is not known whether the patients could have received intravenous iron for causes other than renal anemia, such as heart failure. Nevertheless, the data collected was the use of intravenous iron in patients with anemia associated with CKD, so it seems reasonable that it was used mainly for the correction of anemia. As in previous studies, patients with ND-CKD mostly received oral iron, as advised by the ERBP or National Institute for Health and Care Excellence (NICE) guidelines.25,28 However, there is no data available on dose or compliance, but analyzing the mean ferritin and TSAT levels achieved, patients would probably benefit from a greater use of intravenous Iron, despite its greater use in stages 4 and 5. Iron therapy was similarly across all stages of ND-CKD, in line with what was observed in previous studies.16,22 Several clinical studies and a meta-analysis in patients with ND-CKD have shown that intravenous Iron is safe, and more effective and faster than oral iron in achieving the increase Hb levels and the reduction of ESA doses.29 In dialysis patients, especially on HD, most received intravenous iron, as advised by guidelines.
ESA use increased with the severity of the disease, as did the requirement for higher doses, as shown in Fig. 1. The ERI was lower in ND-CKD patients, and tended to increase with the disease severity, being higher in hemodialysis patients (Table 5). These data is similar to the obtained in the Swedish study by Evans et al.22
Hemoglobin variability is common in this population, especially in those treated with ESA, and in some, but not all studies, it has been associated with worse quality of life, increase in hospitalizations, morbidities and mortality.3 In the present study, a minority of anemic patients with CKD successfully maintained target Hb levels in the 10−12 g/dl range during the follow-up. Among the different subgroups, HD patients had the highest rates of variability, a fact that coincides with a Spanish retrospective study in dialysis patients.30
On the other hand, the need for transfusions was relatively high in our study (especially in D-CKD), despite the fact that the guidelines recommend a restrictive use of transfusions.24 Although the reasons are unknown, presumably the patients could have received transfusions for reasons other than anemia associated with CKD. In this regard, a higher rate of hospitalizations was observed according to the severity of renal dysfunction and was higher in patients on dialysis. In general, the more acute events requiring hospitalization, the higher the risk of transfusions. In this context, it should be remembered that transfusions should be avoided due to the intrinsic risks, especially in patients who are candidates for renal transplantation.
The absence of randomization is an intrinsic limitation of the design, as it produces a selection bias in observational studies, and also allows to describe associations but we cannot infer acausal relationship. In addition, treatment was assessed on the basis of prescriptions, with no information available about adherence. Patients could be participating in a clinical trial and, therefore, the treatment pattern would not be a true reflection of normal patterns, although it is not expected to significantly influence the results. In addition, the database from the different geographic areas of Spain are not distinguishable. The number of transfusions was high in ND-CKD stage 5 and D-CKD patients; however, the database does not capture the reasons for transfusions, which might not be directly related to CKD.
Among the strengths of the study is the large sample used, which is representative of the Spanish population. In addition, currently, data have been used to calculate prevalence and incidence, in a scenario in which previous publications did not capture the reality of the pathology. Another relevant point is that it has been analyzed the anemia associated with ND-CKD (3a-5) and D-CKD instead of focusing on a single subgroup of patients, thus providing a global view of the disease and its progression. Also, It is important to add that our study adds the treatments that patients are following, which allows us to analyze the real clinical practice in Spain.
ConclusionsThe RIKAS study provides a recent epidemiological assessment of anemia in ND-CKD (stages 3a-5) and D-CKD (HD, PD) in Spain during 2015−2017. The prevalence of anemia and that of inflammation vary according to the disease severity. Finally, although anemic patients receive oral or intravenous iron therapy, associated or not with ESA, in the long term these treatments are insufficient to achieve the optimal values of iron parameters recommended by the guidelines. Consequently, there is a broad room for improvement in optimizing treatment in patients with anemia associated with CKD.
Ethical considerationsThis study was approved by the Ethics Committee of the Consorci Sanitari de Terrassa.
FinancingThis study was sponsored by Astellas Pharma Inc. Medical writing support was provided by Sonia Romero Perez, PhD, of Meisys-Mediación Científica S.L., funded by Astellas Pharma S.A. Permission for this acknowledgement was obtained and has been included in the final version of the manuscript.
Conflict of interestAleix Cases reports receiving a grant, consulting and speaking fees from Vifor Pharma, speaking and consulting fees from Astellas, AstraZeneca and Novo Nordisk; consulting fees from GSK and Otsuka and speaking fees from Amgen and Bayer. Elena González de Antona Sánchez and Giovanna Cadeddu are employees of Astellas Pharma S.A. Maria Mata Lorenzo is an employee of Astellas Pharma Europe Ltd.
To the CERCA program of the Generalitat de Catalunya.
The following are Supplementary data to this article:


