Introducción: La enfermedad cardiovascular es la principal causa de muerte en los pacientes con enfermedad renal crónica. La hipertrofia ventricular izquierda (HVI) es la manifestación más frecuente y está relacionada con la hipertensión arterial y la hiperhidratación. El objetivo del presente trabajo es estratificar a los pacientes en diálisis según el estado de hidratación y valorar las posibles alteraciones ecocardiográficas en los distintos grupos. Métodos: Realizamos un estudio transversal de 117 pacientes, 65 en hemodiálisis (HD) y 52 en diálisis peritoneal (DP). Las exploraciones realizadas fueron: bioimpedancia multifrecuencia con el sistema BCM-Body Composition Monitor de Freesenius, ecocardiografía transtorácica y analítica de sangre. Definimos hiperhidratación cuando el cociente volumen extracelular-volumen corporal total (ECW/TBW) normalizado para edad y sexo es > 2,5% de la desviación estándar. Resultados: Los pacientes en HD están pre-HD (67,1%) más hiperhidratados de forma significativa que los de DP (46,1%), presentando casi la mitad de la población hiperhidratada hipertensión arterial; tras la sesión de HD se consigue un mejor control del estado de hidratación (26,1%). Los pacientes en DP presentan con más frecuencia cifras de tensión arterial alta y/o llevan tratamiento antihipertensivo (DP 76,9 vs. HD 49,2%). La HVI es más frecuente en los pacientes en HD e hiperhidratados, siendo la más prevalente la HVI excéntrica. Los pacientes hiperhidratados presentan cifras superiores, de forma significativa, del IVAI (volumen de aurícula izquierda indexada por superficie corporal, la IMVI (masa ventricular izquierda indexada) y el cociente sobrehidratación-agua extracelular. Conclusiones: La bioimpedancia es una técnica que nos permite detectar un gran número de pacientes hiperhidratados. Al estudiar las alteraciones ecocardiográficas en los pacientes en diálisis encontramos una alta correlación entre el estado de hidratación por ECW/TBW normalizado para edad y sexo, y el IVAI e IMVI.
Introduction: Cardiovascular disease is the main cause of death in Chronic Kidney Disease patients. Left ventricular hypertrophy is the most common manifestation and it is linked to arterial hypertension and overhydration. The goal of this paper is to stratify dialyzed patients according to hydration status and to make an evaluation about the possible echocardiography alterations of the different groups. Methods: a transversal study was carried out with 117 patients: 65 were on hemodialysis and 52 on peritoneal dialysis. We performed the following tests: multifrequency bioimpedance with the BCM-Body Composition Freesenius’ Monitor system, transthoracic echocardiography, and blood tests. If ECW/TBW (extracellular water vs total body water) normalization ratio for age and gender was > 2.5% SD, the patient was considered overhydrated. Results: HD patients are significantly overhydrated before HD (67.1%) compared to DP patients (46.1%), and almost half of the overhydrated population presents arterial hypertension. However, after an HD session, a better control of the hydration status is reached (26.1%). DP patients frequently present high arterial pressure and/or are under antihypertensive treatment (DP 76.9% vs HD 49.2%). Left ventricular hypertrophy is much more common in HD overhydrated patients, eccentric LVH being more prevalent. Overhydrated patients present significantly high values of LAVI, ILVM, OH/ECW. Conclusions: Bioimpedance technique allows for the detection of a large number of overhydrated patients. Echocardiographic alterations in dialyzed patients show a high correlation between the hydration stage by ECW/TBW normalized ratio for age and gender and the LAVI and ILVM.
INTRODUCTION
Cardiovascular disease is the main cause of death in patients with chronic kidney disease (CKD).1 This is usually due to the presence of traditional risk factors, such as diabetes mellitus, hypertension (AHT), dyslipidaemia and advanced age,2 and to the actual kidney disease (overhydration, uraemic cardiomyopathy and vascular damage, i.e. atherosclerosis, vascular calcification and arterial stiffness).
The main manifestations of cardiovascular disease in these patients are arterial vascular disease and cardiomyopathy.3 The high prevalence of cardiomyopathy is due to AHT and atherosclerosis, which create excess pressure and lead to the development of concentric left ventricular hypertrophy (LVH). Anaemia, fluid overload and arteriovenous fistulae create volume overload, which leads to left ventricular dilation with eccentric LVH.4,5,6
There are various methods for assessing hydration status. Assessment of the inferior vena cava and biochemical parameters, such as B-type natriuretic peptide, are useful methods for assessing intravascular hydration status,7 while bioimpedance spectroscopy (BIS) assesses body and extracellular hydration states.8 The latter technique is simple, inexpensive, reproducible, non-invasive and easy to apply, and is based on the human body's resistance to alternating electrical currents. It assesses not only hydration status but also intracellular and extracellular water, the extracellular and intracellular ratio, the total water volume, as well as nutritional parameters.
The aim of this study was to stratify patients on dialysis according to hydration status, and to assess possible echocardiographic abnormalities in the various groups according to dialysis technique.
METHOD
Patients
We performed a cross-sectional observational study on 117 clinically stable patients on the dialysis programme of the University Clinical Hospital of Valencia between 2008 and 2010. The study included 65 patients (41 males) from the Haemodialysis Unit and 52 patients (28 males) from the Peritoneal Dialysis Unit. Those patients who had arrhythmia, severe valvular heart disease, amputation of any limb, pacemakers or metal prostheses that would interfere with bioimpedance were excluded. All patients signed the informed consent and the hospital ethics committee approved the study protocol.
Measurements
Examinations of patients on haemodialysis (HD) were performed during the middle of the week, while patients on peritoneal dialysis were examined before the first replacement of the morning with an empty peritoneum.
To assess hydration status, we used multifrequency bioimpedance with the Fresenius BCM-Body Composition Monitor, which measures 50 different frequencies from 5kHz to 1MHz. This technique has been validated by dilution techniques that are considered the gold standard,9 dual X-ray absorptiometry and plethysmography,10 among others.11,12 For the measurement, we used two pairs of electrodes: one at a distal position, an injector and a sensor, placed dorsally on the hand (third metacarpophalangeal and carpal joints, respectively) and another on the foot (third metatarsophalangeal and tibiotarsal joints). The reference was the right hemisoma; in HD, the reference was the hemisoma free of vascular accesses. Prior to the procedure, patients were accurately measured and weighed. Examination was performed in the HD group before and after the session. In both HD and peritoneal dialysis (PD), the patient was placed in supine decubitus for 15-20 minutes before the examination in order to help distribute excess fluid and avoid the presence of oedema that could distort results. After the HD session, we also waited the same amount of time to allow balancing among the various compartments (intravascular-extravascular-cellular).
Among the various parameters obtained by BIS, we chose the extracellular water-total body water ratio (ECW/TBW) to assess hydration status and the overhydration-extracellular water ratio (OH/ECW) for the mortality risk.
Patients were classified by hydration status by means of ECW/TBW normalised for age and gender using the method described by Lindley et al, i.e. the difference between the theoretical ratio under normal conditions and that obtained by bioimpedance. If the difference is >2.5%, the patient is hyperhydrated (HHD), if between >2.5% and <2.5% the patient is normohydrated (NHD), and dehydrated if <2.5%.13
The OH/ECW is a ratio that currently is defined as a significant and independent predictor of mortality in patients on dialysis when it is greater than 15%.14
We defined AHT in those patients who had blood pressure (BP) readings >140/80mm Hg and/or were taking antihypertensive drugs.
On the examination day, a blood test was performed to determine haemoglobin (mg/dl), calcium (mg/l), phosphorus (mg/l), parathormone (pg/ml), total proteins (g/dl) and albumin (g/dl) in each patient.
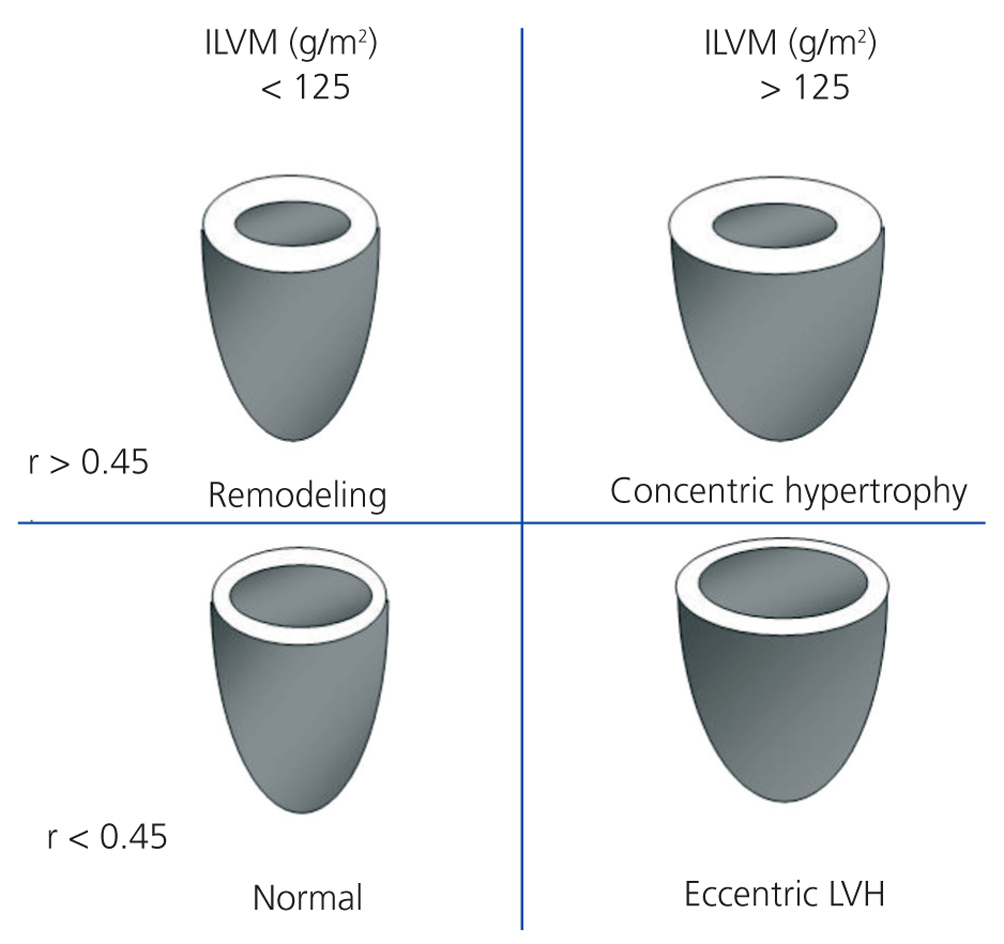
We performed transthoracic echocardiography with a multifrequency transducer and a tissue Doppler program (Aloka) before the HD session, and after emptying the peritoneal cavity in PD. Readings and measurements were made following the recommendations of the American Society of Echocardiography (ASE).11,15 Left ventricular mass (LVM) was calculated using the modified ASE formula,16,17 which is the most widely used method since it has shown values closely associated with autopsy findings: LVM=0.8x [1.04x (LVTDD + TDTS + TDTPW) 3+ (LVTDD)3] +0.6 (LVTDD: LV telediastolic diameter; TDTS: telediastolic thickness of the septum; TDTPW: telediastolic thickness of the posterior wall). LVM was indexed by body surface (ILVM). Based on the studies of Devereux et al, the cut-off point for the diagnosis of LVH using the ILVM was ≥125g/m2, with no difference by gender (Figure 1).16
To classify the type of LVH, we calculated the relative thickness (RT) with the formula: RT=2xPW/LVTDD; we considered a normal RT when <0.45.16
The assessment of the left atrium was performed by measuring the left atrium volume by the indexed Simpson's disc summation method, where the volume of the left atrium is the individual summation of all discs in the series. We used this method for its speed and for correlating well with any method for determining left atrial volume.18,19
Data were processed using the SPSS 15 program. Results are expressed as mean, standard deviation for data with normal distribution; and as median, interquartile range (IQR) and confidence interval (CI) for data that did not have normal distribution. We performed the comparison of means with the Mann-Whitney and Student’s-t test according to the distribution of the variables. Linear regression was performed with Pearson's p. To compare means between the two groups, we performed ANOVA for one factor with Bonferroni and Dunnett's C post-hoc tests, according to the homogeneity of variances. Values of P<.05 were considered statistically significant. We performed a multivariate analysis, using eccentric LVH as the dependent variable and the other study variables as independent variables.
RESULTS
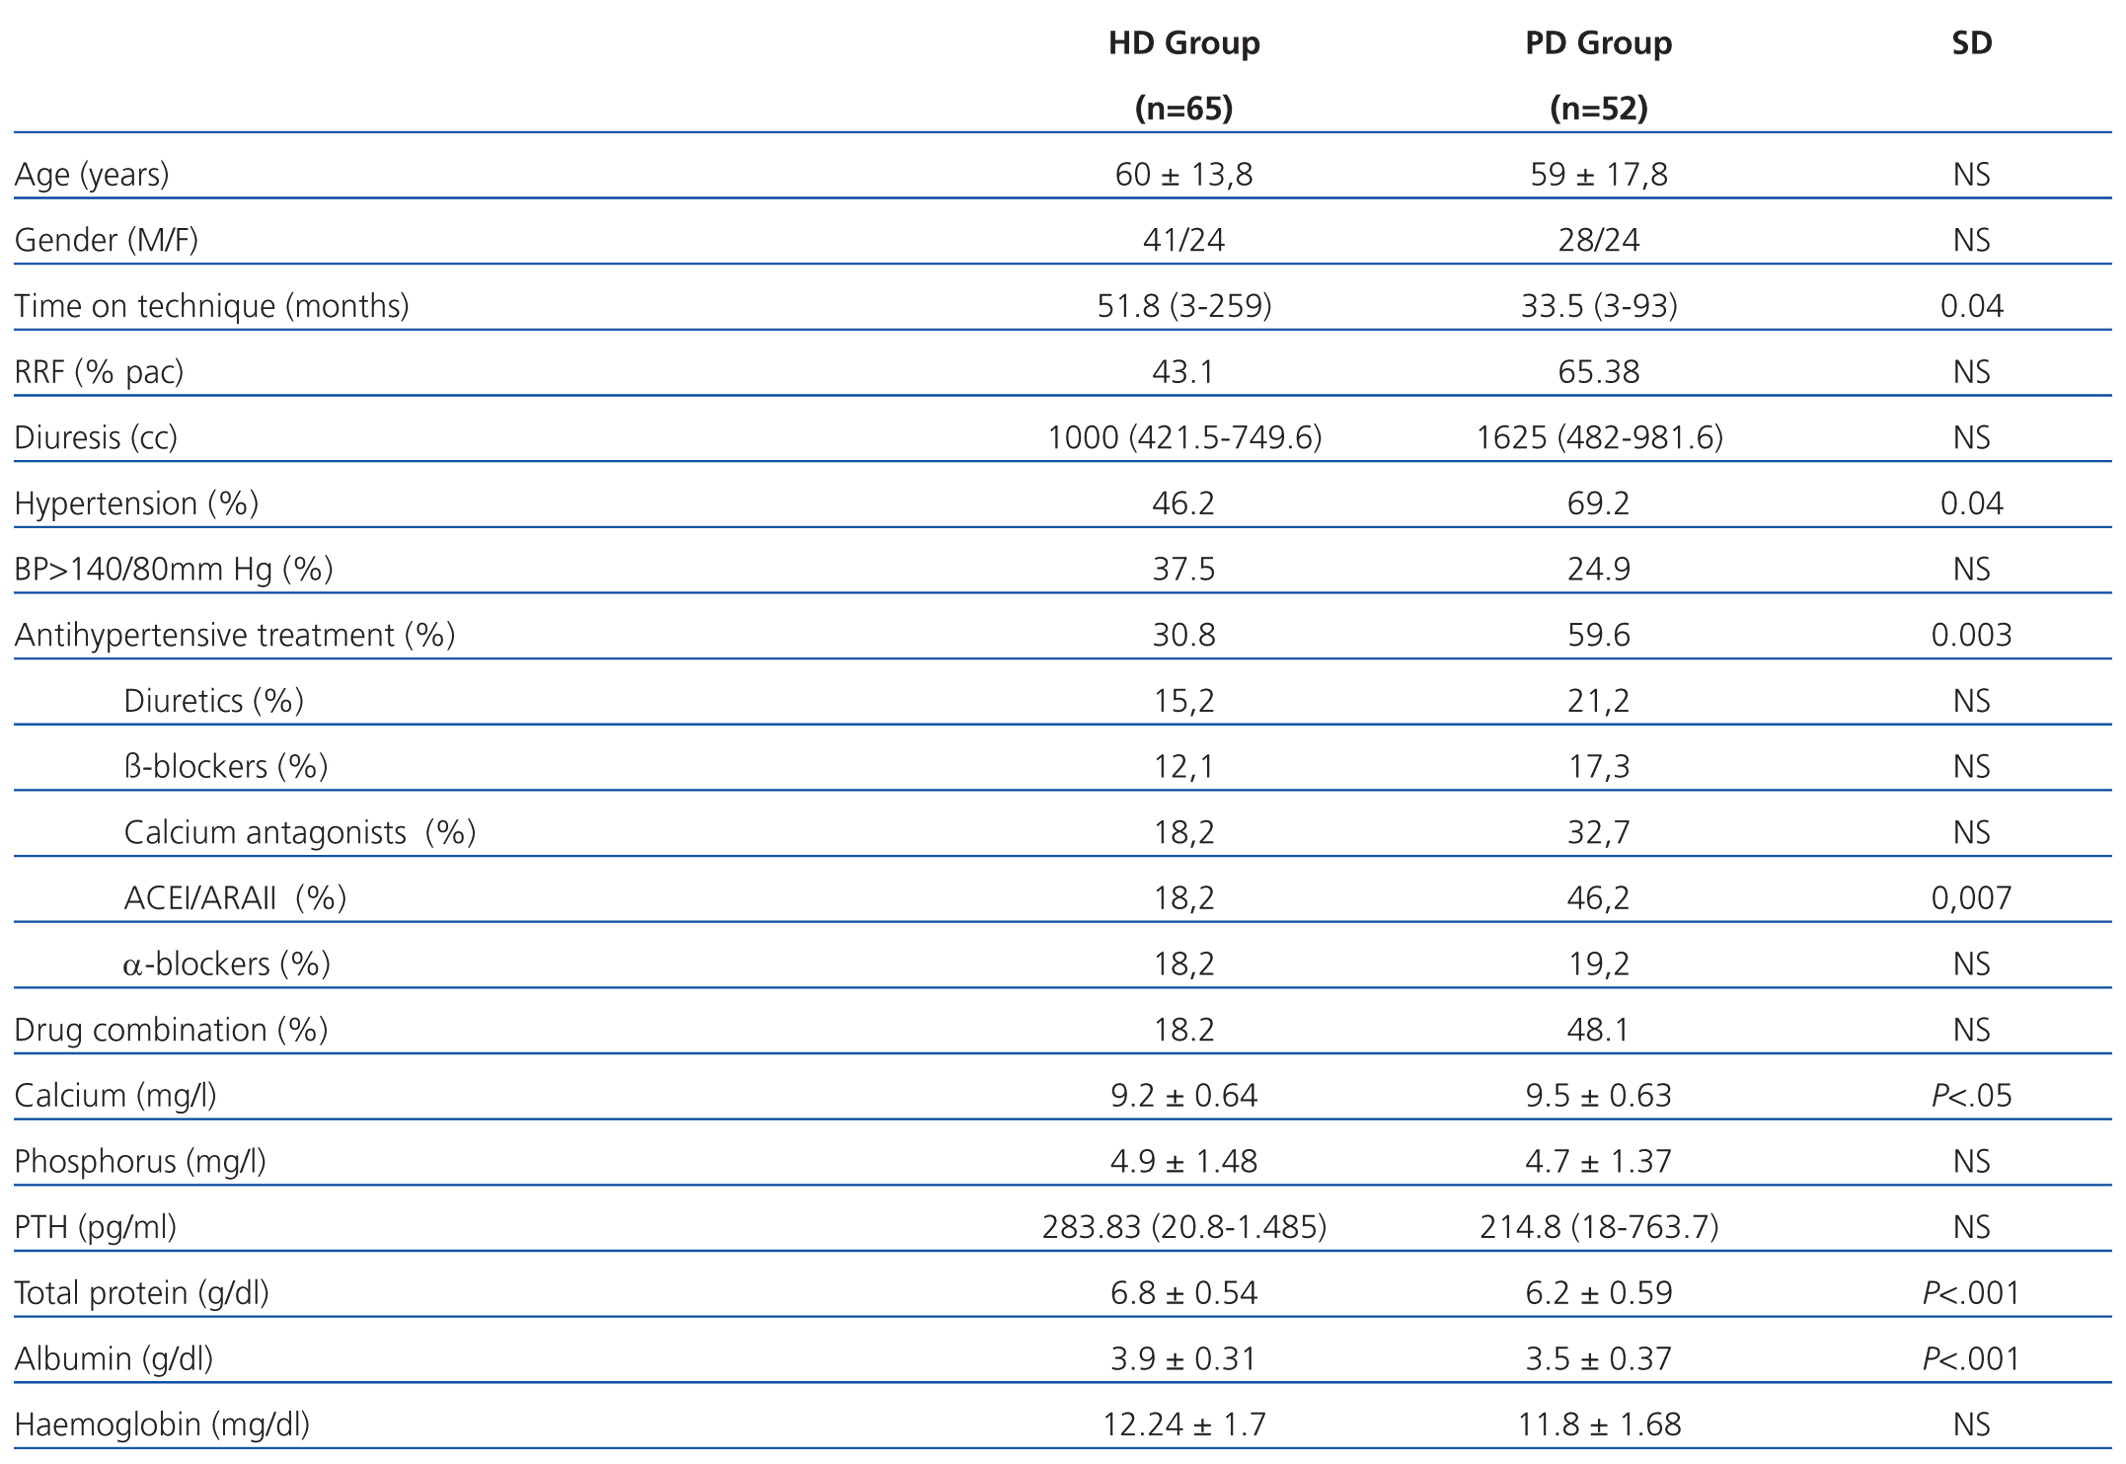
We examined 117 patients, 65 patients in the HD group and 52 in the PD group. The relevant demographic and clinical characteristics and cardiovascular risk factors are shown in Table 1. It is noteworthy that patients who were on HD had been longer on the technique and had lower residual renal function (RRF) than patients on PD. As for laboratory tests, it is noteworthy that patients on HD had higher readings of total proteins and albumin in blood.
The presence of AHT was greater in PD patients, although HD had poorer control of readings. The use of antihypertensive drugs and their combination was greater in patients on PD patients (59.6% vs 30.8%). The most frequently used drugs in both groups were calcium antagonists and angiotensin-converting enzyme inhibitors (ACEI)/angiotensin II receptor antagonists (ARAII). Diuretics were used more frequently in PD.
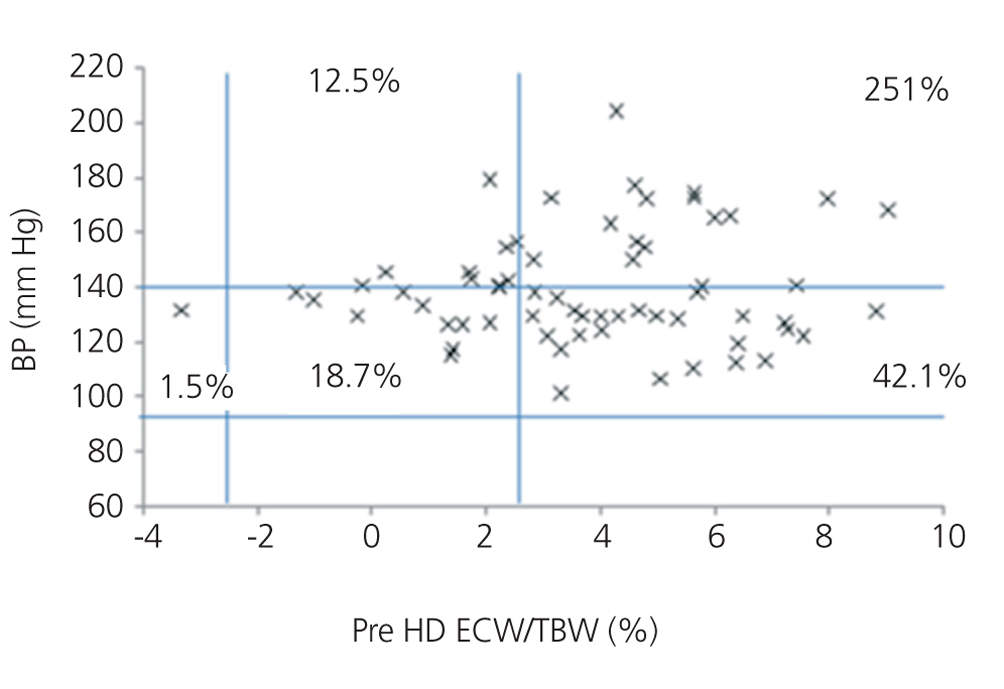
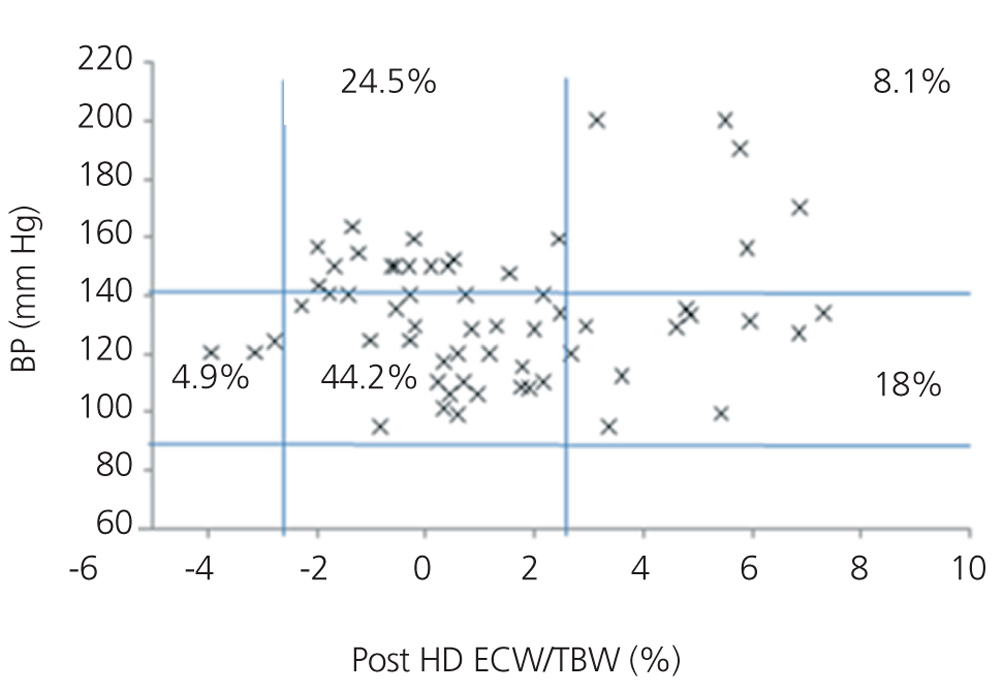
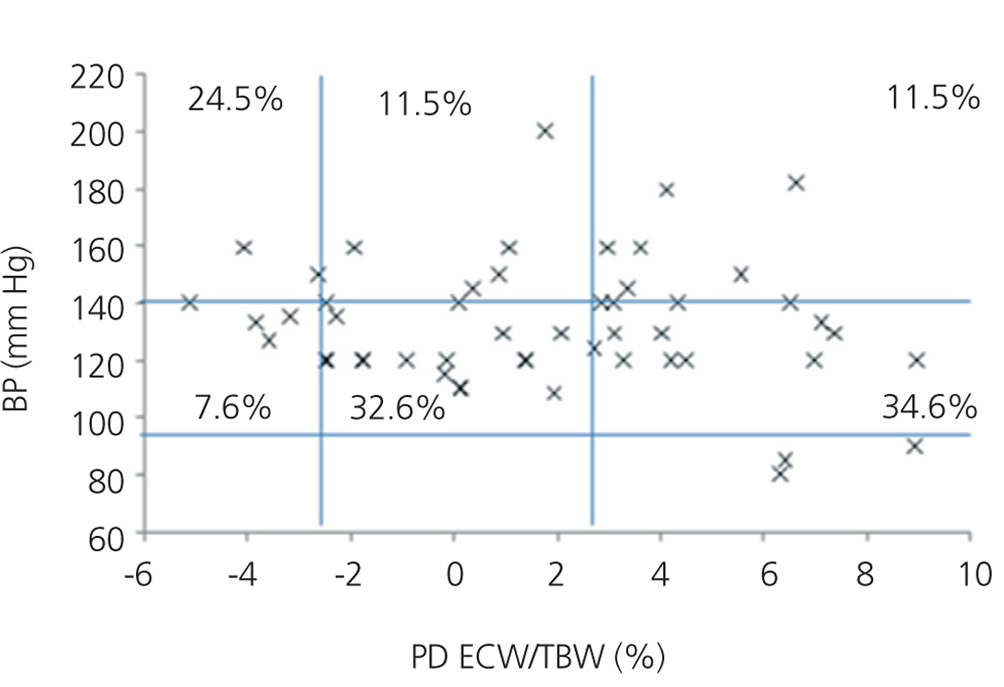
We initially examined the relationship in each dialysis group between the hydration status and BP, by means of normalised ECW/TBW ratios. Patients on HD before and after performing the session presented hydration states and BP readings that are shown in Figure 2 and Figure 3. The distribution of patients on PD is shown in Figure 4.
In the HD group, 37.5% presented systolic blood pressure (SBP) readings >140mm Hg, with 25% being HHD and 12.5% NHD. Some 62.5% were normotensive, with 42.1% being HHD and 18.8% NHD. In the PD group, 24.9% had SBP >140mm Hg, 11.5% were HHD and 11.5% were NHD. Some 74.9% were normotensive, with 34.6% being HHD and 32.6% NHD. We observed a decline in the number of HHD patients in the HD group after the session (67.1% pre-HD compared to 26.1% post-HD), as well as a decline in blood pressure readings (SBP>140mm Hg - 37.5% to 32.6%).
If we consider the presence of hypertension (>140/80mm Hg or drug treatment) and the hydration status in each dialysis group, we observe AHT in 45.45% of the HD group, of which 30.3% were HHD. After the HD session, we observed a decrease in AHT patients (post-HD 43.4%) and a decrease in the number of HHD patients (68.1% vs 27.3%). In PD patients, 69.2% had HTA, of which 28.8% were HHD. Therefore, if we consider the readings for BP and drug treatment, we find greater AHT in PD patients and greater HHD states in PD patients than in readings after HD.
The presence of HHD according to ECW/TBW was more frequent in HD than in PD before the dialysis session (67.1% pre-HD compared to 46.1% PD), but after the HD session a better control of the hydration status is achieved (post-HD 26.1%).
When analysing each dialysis group according to hydration status, the subgroup of HHD patients in both techniques had been longer on the technique (HHD HD 60.9 months vs NHD HD 36.5 months; HHD PD 36.3 months vs NHD PD 34.8 months), with only those on HD showing a significant difference. The presence of RRF was similar in both techniques, although it was lower in the HHD group (RRF HHD HD 34.9% vs NHD HD 55%; HHD PD 37.5% vs NHD PD 42.9%).
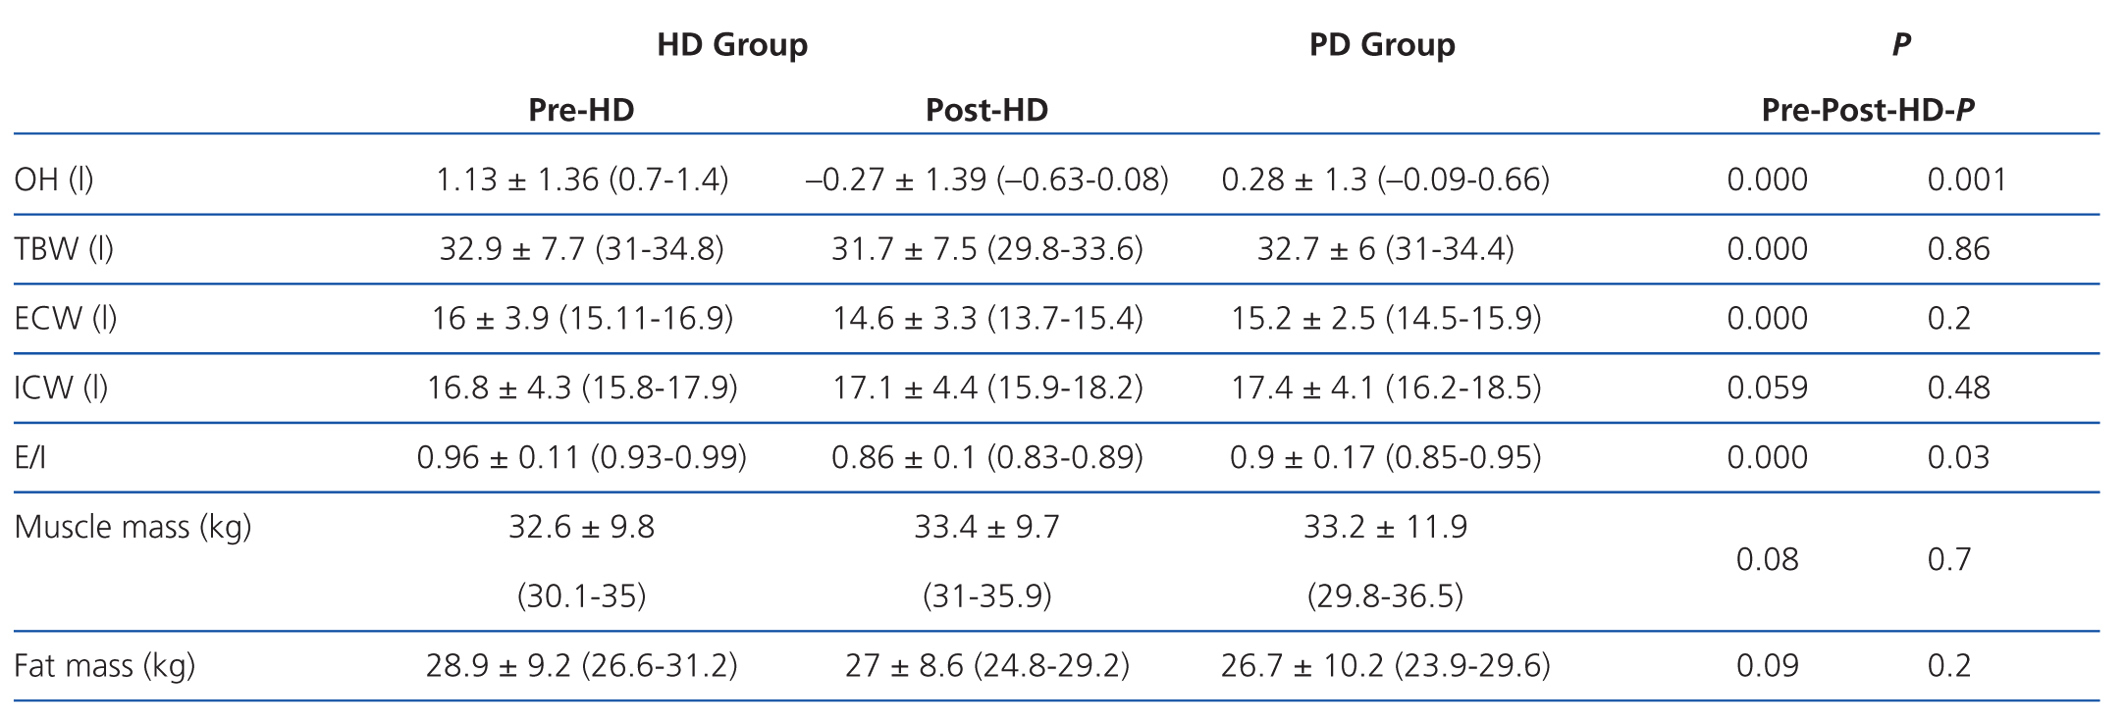
According to the data obtained using BCM, patients on HD had significantly greater overhydration (OH) and extracellular/intracellular (E/I) water than those on PD (Table 2).
The second phase of the study consisted of assessing each dialysis group, according to the hydration status as measured by ECW/TBW, the echocardiographic characteristics and the correlation among the data obtained by bioimpedance (Table 3).
Left atrial volume indexed to body surface (LAVI) and indexed left ventricular mass (ILVM) were significantly greater in patients in the HD group and in the HHD subgroup of both techniques. The OH/ECW ratio was significantly greater in HD patients than in PD patients (>15%, 14.06% in HD vs 3.8% in PD), as well as in HHD patients in each type of dialysis.
If we assess the geometry of the left ventricle in our study population, we observe the presence of LVH in 27.6% of the HD group and 13.4% in PD; the most prevalent in both groups being the eccentric one. According to the hydration status, the presence of LVH was greater in the HHD group (HD 27.9% vs PD 20.8%) than in the NHD group (25% vs 9.5%), with eccentric LVH being the most prevalent (Tables 4 and 5). In the univariate study of eccentric LVH with all variations, the only one of significance was eccentric LVH with hydration status (normalised ECW/TBW) with a significance of P=.03 (CI 1.1-11.5).
DISCUSSION
Bioimpedance is a technique that allows us to detect a large number of HHD patients. It is an easily applicable method and may be considered the gold standard in determining hydration states. Various methods have been used to assess hydration status, but they are unreliable since numerous factors may interfere. The assessment of the hydration status by means of the BP may be distorted by antihypertensive therapy, AHT not dependent on volume, and the presence of heart disease;20 the inferior vena cava shows the intravascular volume by diastolic dysfunction;21 and RRF and the presence of heart diseases,22 among others, may interfere with biochemical markers, such as BNP and pro-BNP.
We found in the literature that various parameters have been used to define hydration status by bioimpedance: OH/ECW, ECW/TBW, E/I and OH. Lopot et al determined the optimal dry weight in HD patients using the deviation between ECW/TBW obtained by bioimpedance and that obtained in a control group, according to age and sex. This is based on changes produced in the cell mass (with increasing age, the cell mass and therefore the intracellular water decreases) and the hydration status (with increasing age and/or female gender, the intracellular water decreases).23 Lindley et al determined the dry weight in PD using the difference between ECW/TBW obtained by BIS compared to ECW/TBW of a control group according to patient age and gender (defining HHD as those who had +2.5% standard deviation).13
We assessed the hydration status of our patients based on these principles.9,24 In the HD group, we found significantly more HHD patients before HD (67.1%) than in the PD group (46.1%), and almost half had AHT. After the HD session, better control of hydration status is achieved (26.1%). Devolder I et al assessed hydration status by means of OH/ECW (overhydrated OH/ECW>15%),23 Plum et al by ECW/TBW25 and Passauer et al by OH (litres of overhydration >1.1 I).11 They found that hydration status was harder to control in patients on PD than in post-HD patients, which is consistent with our data.
The bodily distribution of excess fluid in patients on dialysis varies according to the type of technique. Therefore, the impact of hydration status on BP and at the cardiac level must vary. In the literature, excess fluid in patients on PD is found peripherally in the subcutaneous tissue, while in HD patients it is located in the bloodstream.25 In HD, there is an increase in body weight in the interdialytic period (48 hours), due to the consumption of liquids and food, and a decrease during the session (4 hours) by the ultrafiltration of the accumulated water volume and by the convective and diffusive transport of sodium. Abrupt changes occur at the intravascular level, very slowly from the interstitial space by means of refilling. Interdialytic weight gain is greater in patients who do not have RRF. The PD technique is usually performed continuously, and the balance between the various compartments is produced constantly. Ultrafiltration is produced from the interstitial space.
We must remember that bioimpedance assesses the intra-extracellular hydration status, and not hydration at the intravascular level. The increased state of HHD in HD before the session is due to weight gain in the interdialytic period, which is located at the extracellular and intravascular level, resulting in a greater E/I ratio. After the HD session, the hydration status is reduced by the ultrafiltration of the intravascular space, and it takes some time for the various compartments to reach a balance. In PD, we observed a significantly lower E/I ratio than in HD (E/I pre-HD 0.96 vs PD 0.9) due to a lower extracellular water (ECW pre-HD 16 1 vs PD 15.2 1) because ultrafiltration in this technique is performed constantly. Therefore, when we perform bioimpedance in patients on HD, especially after the session, balance has not yet been reached among the various compartments. Probably because of this, hydration parameters in PD compared to post-HD may be distorted.
In the literature, the prevalence of AHT in patients on HD is around 60% in the interdialytic period,26 while for PD it is greater (80%).27 Our prevalence of AHT was lower. The presence of high BP readings and/or antihypertensive treatment was greater in PD patients (PD 76.9% vs HD 49.2%), but they had better blood pressure control (BP<140mm Hg, 37.5% HD vs 24.9% PD), probably due to the greater use of antihypertensive drugs. The most widely used drugs in both groups were calcium antagonists and ACEI/ARAII.
Diuretics are used more in PD due to the greater prevalence of RRF, and this allows us to increase the diuresis volume and adjust hydration status. The increased presence of RRF in PD is due to PD being a continuous technique, with constant ultrafiltration that precludes abrupt changes in volume, which helps protect the kidney. Moreover, patients on HD usually have poorer renal function due to the greater use of nephrotoxic agents (aminoglycosides, contrast media, non steroidal anti-inflammatory drugs), the bioincompatibility of filter membranes and/or increased frequency of hypotension episodes.28,29 We found an inverse correlation between time on dialysis and presence of RRF in our patients, due to the continuous development of kidney disease over time, which results in a reduced RRF, although in most studies the mean time on the technique is lower than ours.
The greater frequency of AHT in PD patients may be due to the greater hydration status (less accuracy in the adjustment of dry weight, continuous changes in the peritoneal membrane, etc.) Patients in HD had greater hydration states before the dialysis session, but decreased after the session, with subsequent increases up to the next session, reflecting these changes in the blood pressure. Patients on HD usually had less antihypertensive treatment because during the HD session a reduction in intravascular volume is produced and this must be adapted. If the patient is undergoing antihypertensive treatment, the compensation and/or vascular adaptation mechanisms are blocked and present continuous vasodilation, which results in hypotension, poor tolerance, and an inability to reach the target dry weight. At the same time, vascular refilling is produced from the interstitial liquid at different speeds, depending on the patient's characteristics (elderly, diabetic, and patients with ventricular dysfunction or pulmonary hypertension present very slow refilling).
The prevalence of LVH is 75% among patients on dialysis,30,31,32 and develops in initial stages of CKD. Numerous studies have shown its increase in parallel with the reduction of GFR.33 AHT and hyperhydration have an impact on the heart with the development of LVH, among other risk factors. We found studies, such as the Wang AY et al study, where RRF had considerable influence and 70% of patients with no RRF presented ventricular modelling disorders.34 The development of LVH varies according to the type of overload. Fluid or volume overload is related to the onset of eccentric LVH, while pressure overload and AHT is related to concentric LVH. We found a correlation between eccentric LVH and the hydration state. Foley et al suggest that regression of LVH does not occur after starting dialysis and that it is irreversible, due to high patient mortality.35,36 However, last year we found published studies that demonstrated that LVH regression is possible after years of dialysis. Several therapeutic strategies may work: control of anaemia, control of hydration status, use of antihypertensive drugs in normotensive and hypertensive patients, daily or night-time use of HD, prevention and treatment of hyperphosphataemia, vitamin D administration, and multifactorial intervention.37,38,39 We found regression not only in patients on HD, but also in patients on PD.40,41
In our study, the prevalence of LVH was less (53.5% in HD vs 38.4% in PD). The lower presence of cardiac disorders may be due to acceptable control of hydration status and BP, a high presence of RRF, as well as good control over haemoglobin readings, calcium-phosphorus metabolism, and the use of ACEI and ARA II. The difference found between both dialysis techniques may be explained by the greater percentage of patients with no RRF in HD,31 the lower use of ACEI/ARAII, and greater extracellular water ratio. LAVI shows the average of increased filling pressures,42 the functional situation of the heart and overload, and thus, the hydration status. Patients on HD have a significantly greater LAVI than those on PD, and HHD patients have greater intravascular volume and therefore greater cardiac overload, leading to increased LVH.
Lastly, we analysed two emerging markers for the stratification and monitoring of cardiovascular risk in patients with CKD, LAVI and OH/ECW.8,14,17,42 Wizemann et al14 defined the OH/ECW ratio >15 as a cardiovascular risk factor, based on the study performed by Wabel et al in which NHD patients presented an OH/ECW of 6.8%-15%.20 LAVI is a chronic marker of diastolic function that shows the average of increased filling pressures,42 and is considered the best index for assessing filling pressures and the functional situation of the heart, since it is linked to the severity and duration of diastolic dysfunction of the left ventricle.18,19 In our study, both indices are significantly higher in patients on HD, as well as in HHD patients in both groups. Therefore, being HDD according to the normalised ECW/TBW ratio >2.5% is a high cardiovascular risk.
We can conclude that bioimpedance detects a greater number of HDD patients on both dialysis techniques. When studying echocardiographic disorders in dialysis patients, we found a high correlation between hydration status and LAVI and ILVM. Additional prospective studies are warranted to assess the hydration states of the dialysis population and to determine whether there is regression in cardiac remodelling with the control of the hydration status by means of bioimpedance.
Conflict of interest
The authors have no conflicts of interest to declare.
Table 1. Characteristics of patients on peritoneal haemodialysis and dialysis
Table 2. Assessment of the heart and the overhydration-extracellular water ratio according to the state of hydration in each dialysis group
Table 3. Parameters obtained by bioimpedance in peritoneal haemodialysis and dialysis groups
Table 4. Left ventricular geometry according to dialysis type
Table 5. Left ventricular geometry according to hydration state
Figure 1. Patterns of left ventricular hypertrophy
Figure 2. Distribution of patients on haemodialysis before the session according to blood pressure readings and the difference of the ECW/TBW ratio
Figure 3. Distribution of patients on haemodialysis after the session according to blood pressure readings and the difference of the ECW/TBW ratio
Figure 4. Distribution of patients on peritoneal dialysis according to blood pressure readings and the difference of the ECW/TBW ratio


