

Renal replacement therapy (RRT) is the object of constant analysis in the search for efficiency and sustainability.
ObjectiveTo calculate the direct cost of healthcare for the prevalent RRT population in the province of Toledo (2012/2013).
Method(a) Population: All prevalent patients at some point in RRT in 2012 (669) and in 2013 (682). (b) Costs included (€): (1) dialysis procedure; (2) inpatient, outpatient and emergency care, dialysis and non-dialysis related; (3) drug consumption; (4) medical transport. (c) Calculation and analysis: The aggregate localized or reconstructed cost of each item was calculated from the individual cost of each patient. Annual cost and cost per patient/year was calculated for the whole RRT and for its subprograms (€).
Results(a) Aggregate costs: The total cost of RRT amounted to 15.84 and 15.77 million euros (2012/2013). Dialysis procedures account for 40.2% of the total while the sum of hospital care and drug consumption represents 41.5%. Healthcare for patients on hospital haemodialysis (HHD) and concerted haemodialysis (CHD), peritoneal dialysis (PD) and transplant (Tx) accounts for 70.0, 5.0 and 25.0% of the total respectively.
(b) Patient/year cost: From the number of patients/year provided by each subprogramme, the following values were obtained in 2012/2013: All RRT 26,130/25,379; HHD 49,167/53,289; CHD 44,657/44,971; PD 45,538/51,869 and Tx 10,909/10,984.
ConclusionsOur results are consistent with others published, although our patient/year values are slightly higher, probably because they include elements such as outpatient pharmacy, hospital and medical transport cargo. The growing contribution of Tx to the survival of the whole RRT population contains the overall costs and reduces the patient/year cost, making RRT sustainable.
El coste ocasionado por los programas de tratamiento renal sustitutivo (TRS) es objeto de análisis permanente en busca de su eficiencia y sostenibilidad.
ObjetivoCalcular el coste directo de la atención a la población prevalente en TRS en Toledo en los años 2012 y 2013.
Métodoa) Población: Todos los pacientes prevalentes en algún momento en TRS en 2012 (669) y en 2013 (682). b) Componentes del coste (€): 1) procedimiento de diálisis; 2) atención hospitalaria: ingresos, consultas, procedimientos ambulatorios y urgencias; 3) consumo de fármacos; 4) transporte. c) Cálculo y análisis: para cada uno de esos componentes se calculó el coste agregado localizado o reconstruido a partir del coste individual de cada paciente. Se calculó el coste anual y el coste paciente/año del TRS y de cada uno de sus subprogramas (€).
Resultadosa) Costes agregados: el coste anual fue de 15,84 (2012) y de 15,77 millones de euros (2013). Los procedimientos de diálisis representan el 40,2% y la atención hospitalaria más el consumo de fármacos, el 41,5%. La atención a los pacientes en hemodiálisis hospitalaria (HDH) y concertada (HDC), diálisis peritoneal (DP) y trasplantados (Tx) representan, respectivamente, el 70,0; el 5,0 y el 25,0% del total.
b) Coste paciente/año: considerando el número de pacientes/año proporcionado por cada subprograma, se obtuvieron los siguientes valores en 2012/2013: para todo TRS 26.130/25.379; HDH 49.167/53.289; HDC 44.657/44.971; DP 45.538/51.869 y Tx 10.909/10.984.
ConclusionesNuestros resultados son consistentes con otros publicados, aunque arrojan valores paciente/año ligeramente superiores, debido a que incluyen elementos como farmacia extrahospitalaria, carga hospitalaria y transporte sanitario. La contribución creciente del Tx a la sobrevida del conjunto de la población en TRS contiene los costes globales y reduce el coste paciente/año, lo que hace sostenible el TRS.
Renal replacement therapy (RRT) for patients with advanced chronic kidney disease is probably the most scrutinized therapeutic intervention from economical point of view worldwide. Since it became technically possible to replace renal function in the long term by means of dialysis or transplantation, health systems were aware of the enormous economic impact that such an achievement entailed and the ethical dilemmas in terms of equity and opportunity cost that it poses on a permanent basis.1–3 It supposes a sustained use over time (years) of a type of health intervention (dialysis and transplantation) of high technical complexity and high consumption of human and material resources. This issue has been aggravated during the last decades by the growth of the population that require RRT in all the countries with advanced systems of health care. In our country, between 1996 and 2013, it has been 2.6% per year on average, which has resulted in a final growth of 37%.4
It is not a surprise to find a considerable amount of literature in this respect. In a systematic review (pending publication) made to guide the present study and including the 1998–2013 period,5 there were 20 papers selected that met the established search criteria. Although they provide relevant information on costs in terms of patient/year under the different techniques, the interpretation and comparison of the values shown must be done with caution, since they are data from different countries, periods of time and, most important, with heterogeneous methodological designs. In some cases, these are cohorts of incidents of small quantities6,7 while in others they come from information obtained from large registries.8 The direct cost elements included varies, especially with regard to the inclusion or non-inclusion of care costs not directly related to the RRT technique (hospitalizations, outpatient visits, pharmacy).9,10 Some studies generate models and extrapolate final values from a limited number of observations.11
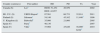
Table 1 reflects some patient cost data per year from the most relevant studies or those close to our environment.
Summary of patient/year cost data in 6 studies.
| Country (currency) | First author | HD | PD | Tx | Year |
|---|---|---|---|---|---|
| Canada ($) | Leea | HDH: 51,252 | 26,959 | 2002 | |
| HDS: 42,057 | |||||
| EE. UU. ($) | URDS Reporta | 87,561 | 66,751 | 32,914 | 2011 |
| Finland ($) | Salonema | 54,140 | 45,162 | 11,446d | 1996 |
| U. Kingdom (£) | Baboolalb | 35,000 | 21,000 | 2005 | |
| Spain (€) | Parrab | 40,136 | 2007 | ||
| Spain (€) | Villab | 37,968 | 25,826 | 38,000c | 2010 |
| 6238d |
PD: peritoneal dialysis; HD: hemodialysis; Tx: transplant.
All reports agree that hospital hemodialysis (HDH) is the most expensive and least cost-effective technique, followed by home dialysis: peritoneal self-service (CAPD) or hemodialysis (AHD) or satellite center (SHD). The most cost-effective technique is renal transplant (Tx), in which, after the first 6 months, it divides by a factor 5–6 the patient/year cost of HDH.7,12,13 If the years are adjusted for quality (cost-utility), the difference is even greater.
With the exception of the USRDS annual reports,8 there are no studies analyzing the costs with real data (there is a study in Spain with estimates from models13 from a perspective of prevalence and integral approach to RRT (all patients seen in all Techniques) in a defined geographical and population area. This approach is of great interest to administrators and to the society in general.14 This lack of updated national information has stimulated us to see the opportunity and convenience of carrying out the present work in the context of a province with a complete and integrated RRT program.
ContextIn the Toledo province (Spain) (704,000 inhabitants in 2012), the RRT program is directed and supervised by the Nephrology Service of the Toledo Hospital Complex (THC), which acts as the main renal unit of a health care network15 that offers all the modalities of RRT. Hemodialysis (HD) is provided at his own center or concerted centers depending on patient's address, work and clinical considerations. Also, home peritoneal dialysis (CAPD) is offered. It is the only hospital in which home HD (HDH) is performed and serves as a reference and support to 3 concerted centers (Toledo, Talavera and Alcázar de San Juan) and to other public hospitals with Nephrology Units without their own HD/PD program.
Since March 2007, the THC performs cadaver kidney transplantation in the province and since 2012 covers part of the Ciudad Real province. Before 2007, patients living in Toledo were transplanted in the Community of Madrid (80–90% in Hospital 12 de Octubre). Living donor and kidney-pancreas transplants are performed in the Hospital 12 de Octubre. In any case, virtually all of the population already transplanted is controlled and supervised in the THC.
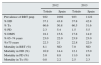
The RRT program in the province of Toledo has covered in 2012 and 2013 the population with advanced chronic kidney disease requiring RRT. Table 2 shows the prevalence, age, and proportion of diabetic nephropathy, distribution by techniques and mortality at 31/12 of each year. The values are compared to the same parameters at the national level.
Characteristics of prevalence (31/12) and mortality in RRT of Toledo vs. Spain.
| 2012 | 2013 | |||
|---|---|---|---|---|
| Toledo | Spain | Toledo | Spain | |
| Prevalence of RRT pmp | 922 | 1092 | 923 | 1122 |
| % HD | 37.1 | 43.8 | 37.8 | 42.8 |
| % Tx | 60.6 | 50.8 | 60.5 | 51.6 |
| % PD | 2.3 | 5.4 | 1.5 | 5.5 |
| % DMN | 18.1 | 15.6 | 17.8 | 14.9 |
| % 65–74 years | 23.0 | 22.0 | 23.9 | 23.0 |
| %>75 years | 22.3 | 21 | 22.8 | 22.0 |
| Mortality in RRT (%) | 8.1 | ND | 7.0 | ND |
| Mortality in HD (%) | 16.9 | 14.4 | 12.1 | 15.0 |
| Mortality in PD (%) | 5.0 | 8.8 | 11.0 | 8.9 |
| Mortality in Tx (%) | 0.8 | 2.2 | 2.5 | 2.3 |
PD: peritoneal dialysis; HD: hemodialysis; DMN: diabetic nephropathy as primary renal disease; pmp: per million population; RRT: renal replacement therapy; Tx: renal transplantation.
The data from Table 2 reveal the similarities and differences in the population on RRT in Toledo with respect to the nation. In Toledo, there is a prevalence of patients in RRT per million population (pmp) lower (10%) than the national and there is a higher contribution of Tx and lower HD and DP (especially the latter) to the prevalent population on RRT. Differences in the proportions of patients over 75 year of age and diabetic nephropathy do not reach statistical significance. Mortality rates by techniques and years have the moderate difference of this type of cross-sectional observations, with frequent interannual variations in small samples that, as can be seen, it is not seen in the whole national population.
In regard to the transplanted population, it is important to note that out of the entire period that was evaluated, only 29 (2012) and 36 (2013) cases were in their first year post-transplant, representing 8 and 9% of the prevalent population in Renal Transplant in the period. The median of years with a transplant in the total population transplanted in both periods is 6 years.
Objectives- (a)
To describe and calculate the direct costs (global and by healthcare concepts) generated by the health care of patients in any form of RRT in the province of Toledo throughout the years 2012 and 2013.
- (b)
Calculate the cost of patient/year in each of the RRT techniques using total costs per program, and the number of years survived by prevalent patients in the total RRT and in each of the techniques in the years considered (simple summation of the time maintained of each patient in each of the techniques).
- A.
Patients and exposure times. All patients prevalent in RRS in the province of Toledo during the years 2012 and 2013 were considered regardless of the duration of prevalence (period prevalence); therefore, incidents patients were included. The analysis and distribution of the exposure times (presence in life) to the different techniques was performed for each of the considered years. The time exposure of each patient in each technique and the global sum of years (patients/year) were calculated.
- B.
Cost components taken into account. We considered, based on available information, the consumption of resources and their economic cost in 2012 and 2013. It was necessary to locate costs at a very disaggregated level. This information will give rise to specific study pending additional publications since they were neither possible nor relevant to be presented in this article.
- a.
Dialysis procedure
- i.
HDH: includes all the human and material resources consumed by the dialysis care of patients assigned to the hospital's Chronic HD Program.
- ii.
HD performed in patients of the province area in concerted centers (HDC) located in Toledo and Ciudad Real.
- iii.
PD contracted with external companies.
- i.
- b.
Support of the RRT program. This section includes the costs generated by the activity of THC hospital necessary to support the entire RRT program. This is the activity that guarantees the continuous care and coverage to all types of clinical events in these patients. It does not include the cost of hospital use mentioned in section c.
- c.
Cost of hospital use caused by patients in RRT (hospital burden). It takes into account the hospital admissions, outpatient visits to specialists, visits to the emergency room and major surgical ambulatory procedures including those related to vascular and peritoneal accesses during the current year, in the three hospitals of the region.
- d.
Medication. Consumption of medication by patients that was not included in the previous sections:
- i.
Non-instrumental medication given during HD.
- ii.
Medication directly served from pharmacies to patients in RRT.
- iii.
Out-of-hospital medication: prescriptions served by pharmacy offices.
- i.
- e.
Cost of transportation. Scheduled transportation services by taxi or ambulance from the home to the hospital and HDC centers.
- a.
- C.
Sources of information, calculation of times, costs and imputation procedure. The study has followed a double and two-way methodology according to relevance and availability: (a) aggregate expenditure in centers of concerned and imputation activity and individual case; (b) costs associated to each patient, then added by concept and category of RRT.
The sources of information used in the present study have been the following: the records provided by the Registry of Renal Disease of Castilla La Mancha (RERCLM), control of data of economic management classified by homogeneous functional groups (GFH) of the hospitals, actual invoices of contracts, clinical documentation and admission services, hospital pharmacy services, SESCAM pharmaceutical prescriptions service, taxis billing (ALCER) and health transport company.
The following data were estimated/estimated:
- a.
Relationship and exposure times of patients. Modality of treatment of prevalent patients and measurement of the length of time exposed of each patient to the different modalities (HDH, HDC, PD and Tx). Thus, the number of patients/year was obtained for the entire RRT program and for each of the modalities of RRT. Finally, for the purposes of imputation of costs of hospital use and pharmacy, patients who were exposed to more than one modality (<6% of cases) were categorized in the dominant modality in the year and always in Tx if they had been transplanted in that year.
- b.
Cost of the dialysis procedure
I. HDH: application of the official departmental costs corresponding to the HD GFH after adjustment for the coefficients of participation assigned to this activity.
II. HDC and PD: actual billing corresponding to the patients considered.
- c.
Cost of supporting the RRT program:
- i.
HD and PD: application of the official departmental costs corresponding to the HD GFH after adjusting for the coefficients of participation assigned to these activities (unplanned HD sessions, PD training, contingency care in the day hospital unit).
- ii.
Tx:
- 1.
Allocation of HD GFH costs after application of the imputation coefficient for that activity.
- 2.
Participation adjusted to the number of Tx performed, cost to cover on call services for Tx patients and coordination (GFH Coordination of transplants).
- 1.
- i.
- d.
Cost of hospital use:
- i.
Cost (according to cost/process) individual and aggregate of the groups related to the diagnosis (DRG) corresponding to the admission and major ambulatory surgery caused by the cohort of patients.
- ii.
Official cost attributed by each hospital to external consultations (new and successive) and to the care in the ER.
- i.
- e.
Cost of medication:
- i.
At the hospital:
- 1.
The cost of individual medication provided to the patients during the HD session in the hospital or in concerted center.
- 2.
The cost of individual medication provided to the patients during the HD session in own or concerted center.
- ii.
Out of the hospital:
- 3.
Individual cost of medication provided by pharmacies through conventional prescription.
- 4.
Calculation of average annual costs according to patient categories (HD, PD, Tx).
- 1.
- i.
- f.
Cost of transportation: Invoices from taxi drivers and from the scheduled health transport company.
- a.
- D.
Measures and cost units
- a.
Aggregate costs of each element previously defined in section B. The percentage share in the overall program of RRT and in each modality.
- b.
Average unit cost per patient/year and modality of RRT.
- a.
- (a)
Prevalent patients, patients/year on coverage. Table 3 shows the total number of patients at risk (prevalence of period) and the total exposure times in terms of patients/year in each of the periods considered, as well as the contribution of each of the techniques to the total number of patients/year obtained.
Table 3.Prevalent patients and patient/year.
2012 % of total 2013 % of total No. of prevalents RRT (period) 668 100.0 682 100.0 Patients/year in RRT 606 100.0 621 100.0 Patients/year in HD 246 40.6 230 37.0 Patients/year in PD 17 2.8 13 2.1 Patients/year in Tx 343 56.6 378 60.8 PD: peritoneal dialysis; HD: hemodialysis; RRT: renal replacement therapy; Tx: transplantation.
- (b)
Structure and major components of the cost of care.Table 4 shows the aggregate cost data (€) for large blocks of care. The dialysis procedure (which includes all HD and DP) consumes on average a 40.8% of resources on a biennial basis. This represents a proportion equivalent to the sum of the hospital load and the consumption of medications (41.5%). It is also seen that in nominal aggregates, there is a striking interannual stability (irrelevant reduction of 0.4%) of the global cost. The reduction in transportation costs (23%), dialysis (4.5%) and cost growth in pharmacy and hospital charges (8%) appear to be significant changes.
Table 4.Added cost of health care components (€).
2012 2013 Δ% 2013/2012 % Share average Dialysis 6,603,973 6,302,709 −4.5 40.1 HD hospital 2,083,165 2,025,893 −2.7 HD concerted 4,094,499 3,922,214 −4.2 PD concerted 426,309 354,602 −17 Support for 1,134,426 1,234,845 9 7.5 HD 385,992 367,532 −5 PD 121,164 113,909 −7 Tx 626,670 753,404 20 Hospital load 3,238,093 3,490,972 8 21.2 GRD hospital 2,617,078 2,846,274 9 GRD out of the hospital 160,179 208,357 30 Out patient clinics 320,513 285,388 −11 Emergency room 140,323 150,955 −7 Pharmacy 3,066,701 3,363,254 8 20.3 Associated with procedure 541,151 592,626 9 Hospital individual 256,071 289,341 4 Individual out-of-hospital 2,269,479 2,481,286 9 Transport 1,804,418 1,417,226 −23 101 Total RRT 15,847,711 15,778,360 −0.4 PD: peritoneal dialysis; GRD: groups related by diagnosis; HD: hemodialysis; RRT: renal replacement therapy; Tx: transplantation.
- (c)
Aggregate cost of RRT and each of the programs.Table 5 shows the aggregate cost (€) generated by each of the treatment modalities. The relative share (%) of each modality is calculated using the average in the biennium including the absolute costs of each year and considering that a global estimate is accurate. Tx consumes 25% of resources and affects 60% of patients/year. And the proportion of Tx is a growing within the total RRT program.
Table 5.Cost per program, evolution and average participation.
Programs 2012 2013 Δ% % average HDH 3,911,741 3,801,983 −2.8 24 HDC 7,412,851 7,158,611 −3.4 46 PD 781,259 663,528 −15.1 5 Tx 3,741,759 4,154,238 11.0 25 RRT 15,847,611 15,778,360 −0.4 PD: peritoneal dialysis; HDC: concerted hemodialysis; HDH: hospital hemodialysis; RRT: renal replacement therapy; Tx: transplantation.
- (d)
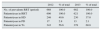
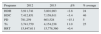
Cost of patient/year. Survival is different in each of the RRT modalities, so it is important to know the patient/year cost (€) in each of the modalities of RRT. This represents an accurate approach cost/effectiveness. Table 6 shows the result of dividing the overall cost of each program by the number of patients/year alive in each technique, as well as the interannual variation of this value.
Table 6.Patient/year cost according to modality and evolution 2012/2013.
2012 2013 Δ% HDH 49,167 53,289 8.4 HDC 44,657 44,971 0.7 PD 45,538 51,869 13.9 Tx 10,909 10,984 0.6 RRT 26,130 25,379 −2.9 PD: peritoneal dialysis; HDC: concerted hemodialysis; HDH: hospital hemodialysis; RRT: renal replacement therapy; Tx: transplantation.
The use of the cost patient/year in total and by technique has been considered an indicator of greater utility and clinical-economic significance than the average cost per patient. It is a simple ratio between an aggregated value as numerator (overall cost of the total program and each subprogram) and an equally aggregated value as denominator (sum of years provided by each technique to the survival of patients in TRS); it makes unnecessary to obtain another type of statistics that are hard to calculate under this methodology.
Given the relative stability of the total cost, the annual reductions or increases in patient/year costs are mainly related to the contribution in years lived (denominator) in each technique. Thus, in the comparison of 2013 vs. 2012, the Tx contributes to the globality 35 years more, compared to a 20-year reduction in dialysis techniques; likewise, for the total RRT, the small reduction in patient/year cost reflects a similar growth of the total years patient.
In any case, and from an integral perspective, it can be seen that, overall, the patient/year cost in RRT remains stable or decreasing.
For a correct interpretation of the values obtained of patient/year in Tx, it is important to point out that the patient/year cost includes that of patients transplanted in the year of the study together with that of the cases transplanted in preceding years, which gives a true value of the annual cost of the program, but magnifies the patient/year cost of Tx patients 6–12 months after transplantation.
In fact, the cost generated by patients transplanted within the same year (which are 8–9% of the transplanted population) represents a 34–35% of the total cost of care of transplanted patients, which would mean that the patient/year cost of Tx, after the first year, is around € 7500.
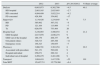
Table 7 shows the average patient/year cost in the biennium of each of the RRT techniques, as well as the absolute and relative contribution of each of the components of the care to the final cost.
Average and percentage share 2012/2013 of each concept in the patient/year cost for the different techniques.
| HDH | % | HDC | % | PD | % | Tx | % | |
|---|---|---|---|---|---|---|---|---|
| Dialysis | 27,289 | 53 | 24,653 | 55 | 26,095 | 54 | ||
| Hospital load | 9599 | 19 | 6721 | 15 | 9849 | 20 | 3612 | 33 |
| Pharmacy | 5647 | 11 | 5365 | 12 | 4454 | 9 | 4816 | 44 |
| Support | 1540 | 3 | 1603 | 4 | 8307 | 17 | 2518 | 23 |
| Transport | 7153 | 14 | 6472 | 14 | ||||
| Total | 51,228 | 44,814 | 48,704 | 10,946 | ||||
PD: peritoneal dialysis; HDC: concerted hemodialysis; HDH: hospital hemodialysis; RRT: renal replacement therapy; Tx: transplantation.
The higher cost of HDH vs. HDC is the result of several factors (lower denominator, patients with greater comorbidity and, therefore, more use of techniques and more expensive drug therapies).
The reduced number of years/patient in PD together with the need to maintain costs of structure and personnel, regardless of denominator value, explains the relative high patient/year cost in this technique. The impact of high hospitalization of 2 patients in a small group results in a seemingly high cost of hospital load.
DiscussionThe results of this work represent, in our opinion, an exhaustive, reliable, realistic approach that is easily reproducible in other geographic-population contexts.
It is exhaustive because we have considered all direct costs attributable to health care of RRT patients including transportation and those may not appear to be directly related to the RRT process, such as hospitalizations, consultations, emergencies and pharmacy. Only some of the publications consulted7,8,16 (none at national level) include all costs simultaneously in all modalities.
The approach used in the present work provides new information, such as the cost of pharmacy outside the hospital and health transport.
It is reliable and realistic because it counts the real costs of each patient care, avoiding estimates or extrapolations from preconceived models. It is also reproducible because it is based on data that can be obtained in the same manner in any geographical area of care. It is of interest to note that the work of Lorenzo et al.9 in HD patients shows results very similar to ours, except in the cost of health transport.
The estimates include all types of specialized and pharmacological healthcare costs of patients in RRT, and this may go beyond the limits of the concept of ‘RRT cost’. It is very difficult (almost impossible) and probably useless to discern the degree of relationship of each of the elements of health care (income, medications, urgencies, consultations) with the situation RRT in each patient. Anyway, this type of problem of assigning health costs to a specific condition is a common problem in chronic diseases such as diabetes mellitus.17
Although the available information would make it possible to distinguish incident and prevalent patient costs, it has been preferred to consider together the costs of both (prevalent over any period of time in the period), as it is more useful from a system economic analysis point of view. Thus, in the Tx program, the (higher) costs of the transplanted patients in the analyzed year are included globally, together with the prevalent patients transplanted at any time.
The analysis of the entire cost in 2 consecutive years and its breakdown by large care units reveals a remarkable stability and the important participation of the hospital charge, the pharmacy and theoretically residual concepts such as transportation (Table 4), which, in the case of the province of Toledo, is strikingly high, probably a consequence of the large geographical area and the rural and dispersed nature of the population. In any case, active control measures have reduced the cost by 23% in a year.
Based on the global figure for 2012, the authors of this work estimated the projection this spending18 at national level and came out with a value of 1.077 million euros, which would represent 2% of public health expenditure, a figure lower than that deducted Villa et al.13 in 2010, which reaches 1.4 billion euros, which could be explained, in part, by a greater prevalence at the national level than in Toledo.
In general, the cost of HD represents 70% (Table 5) and that of Tx 25%, values very similar to those published by Villa et al.13
In relation to the patient/year cost and their participation in the different care concepts shown in Tables 6 and 7, we find values similar to those published in Finland,16 but lower than in USA and somewhat higher than in Spain.19 However, the values obtained in Spain did not include healthcare costs outside the dialysis procedure that have been taken into account in our work; should healthcare costs be included (in the case of HD), the results would have been remarkably similar, as noted above.9 In any case, as mentioned in the introduction, the transnational and transtemporal comparison of this type of study is limited by variables related to method and context.
In terms of patient cost per year, renal Tx is by far the most cost-effective technique: 11,000 for renal Tx vs. 45,000–50,000 € for dialysis. The increasing participation of Tx in the overall survival of patients in RRT explains the important cost restraint in RRT in Spain and other countries; the annual “savings” in RRT costs are estimated at more than 800 million euros.18 This figure comes from the difference between the national cost calculated for 2012 and that which would have been produced in 2012 with costs per case and percentage of those transplanted in 1992.
The design and implementation of an integrated RRT program enables the delivery of quality care at a global cost per year of life that is decreasing and affordable. The identification of cost elements enables actions aimed at eliminating or reducing elements that are not efficient.
Financial supportThe present work was carried out as part of the tasks proposed in the application for the concession of the degree of emeritus staff of SESCAM by D. José Luis Conde Olasagasti.
Conflicts of interestThe authors declare no conflicts of interest.
The authors are grateful to the Dirección General de Asistencia and to the Executive Directors of the hospitals involved for the approvals and services granted to obtain the data necessary to elaborate this research.
Please cite this article as: Conde Olasagasti JL, Garcia Diaz JE, Carrasco Benitez P, Mareque Ruiz MA, Parras Partido MP, Moreno Alia I, et al. Análisis de costes del programa integrado de tratamiento renal sustitutivo en la provincia de Toledo (2012–2013). Nefrologia. 2017;37:285–292.