


Scores underestimate the prediction of cardiovascular risk (CVR) as they are not validated in patients with chronic kidney disease (CKD). Two of the most commonly used scores are the Framingham Risk Score (FRS-CVD) and the ASCVD (AHA/ACC 2013). The aim of this study is to evaluate the predictive ability of experiencing a cardiovascular event (CVE) via these 2 scores in the CKD population.
Material and methodsProspective, observational study of 400 prevalent patients with CKD (stages 1–4 according the KDOQI; not on dialysis). Cardiovascular risk was calculated according to the 2 scores and the predictive capacity of cardiovascular events (atherosclerotic events:myocardial infarction, ischaemic and haemorrhagic stroke, peripheral vascular disease; and non-atherosclerotic events: heart failure) was analysed.
ResultsForty-nine atherosclerotic cardiovascular events occurred in 40.3±6.6 months of follow-up. Most of the patients were classified as high CVR by both scores (59% by the FRS-CVD and 75% by the ASCVD). All cardiovascular events occurred in the high CVR patients and both scores (FRS-CVD log-rank 12.2, P<0.001, HR 3.1 [95% CI: 1.3–7.1] P: 0.006 and ASCVD log-rank 8.5 P<0.001, HR 3.2 [95% CI: 1.1–9.4] P: 0.03) were independent predictors adjusted to renal function, albuminuria and previous cardiovascular events.
ConclusionThe cardiovascular risk scores (FRS-CVD and ASCVD [AHA/ACC 2013]) can estimate the probability of atherosclerotic cardiovascular events in patients with CKD regardless of renal function, albuminuria and previous cardiovascular events.
Las escalas de predicción del riesgo cardiovascular (RCV) suelen infraestimar el riesgo, al no estar validadas en población con enfermedad renal crónica (ERC). Dos de las más empleadas son la clásica escala de Framingham (FRS-CVD) y la contemporánea ASCVD (AHA/ACC 2013). El objetivo del estudio es evaluar la capacidad predictiva de sufrir un evento cardiovascular (ECV) mediante estas 2 escalas en población con ERC.
Material y métodosEstudio observacional prospectivo de 400 pacientes prevalentes con ERC (estadios 1-4 según KDOQI, no en diálisis). Se calculó el RCV según las 2 escalas y se analizó su poder predictivo de ECV ateroscleróticos (infarto agudo de miocardio, evento cerebro vascular isquémico y hemorrágico, enfermedad vascular periférica) y no ateroscleróticos (insuficiencia cardíaca).
ResultadosCon una media de seguimiento de 40,3±6,6 meses se registraron 49 ECV ateroscleróticos. Ambas escalas clasificaron a la mayoría de los pacientes en el grupo de alto RCV (59% según FRS-CVD y 75% según ASCVD). Todos los ECV sucedieron en el grupo de alto RCV, y ambas escalas (FRS-CVD log rank: 12,2; p<0,001; HR 3,1 [IC 95%: 1,3-7,1]; p: 0,006 y ASCVD log rank: 8,5 p<0,001; HR 3,2 [IC 95% 1,1-9,4] p: 0,03) fueron predictores independientes ajustados a función renal, albuminuria y antecedente de ECV.
ConclusionesLas escalas de predicción de RCV (FRS-CVD y ASCVD [AHA/ACC 2013]) pueden estimar la probabilidad de sufrir ECV ateroscleróticos en pacientes con ERC independientemente de la función renal, albuminuria y antecedente de ECV.
There are several scores to predict likelihood of experiencing a cardiovascular event (CVE) in 10 years.1–3 One of these is the classic Framingham score, initially validated in 1998 to predict CVEs: coronary death, non-fatal acute myocardial infarction (AMI), and stable and unstable angina.4,5 It was revised in 2002 by the Third Adult Treatment Panel (ATP)6 and again in 2008.7 It has been validated since then to predict atherosclerotic (fatal and non-fatal AMI, angina or coronary heart disease, fatal and non-fatal ischaemic/haemorrhagic stroke, transient ischaemic attack, intermittent claudication) and non-atherosclerotic (heart failure) CVEs.7 The Framingham equation is based on an homogeneous, geographically limited and predominantly white population, and consequently its use in modern cohorts has been widely questioned.8,9 However, the American College of Cardiology (ACC) and the American Heart Association (AHA) have recently developed the Atherosclerotic Cardiovascular Disease (ASCVD) risk algorithm.10 This new instrument has been validated in a multiracial sample (Multi-Ethnic Study of Atherosclerosis, MESA), and is designed to predict atherosclerotic CVEs (fatal and non-fatal AMI, and fatal and non-fatal strokes); it has also been validated for the African-American population.10–13
Chronic kidney disease (CKD) is a powerful predictor of CVEs.14,15 This is be explained by the high prevalence of traditional risk factors, as well as those intrinsically related with CKD (non-traditional).16–18
Cardiovascular risk (CVR) prediction scores do not usually include factors specific to CKD within their variables.7,10 Nevertheless, various studies have failed to demonstrate that adding these CKD-specific variables implies a significant increase in prediction terms.19
One of the great criticisms of CVR prediction scores is their capacity to “overestimate” risk,8 and their poor discriminatory power in the CKD population.20 However, there is currently no equation that is accurate enough to estimate CVR in both the general population and in patients with CKD.8,20,21
The aim of this study is to evaluate the power of two scores to predict the risk of presenting a CVE: the Framingham Risk Score Cardiovascular Disease (FRS-CVD) and the ASVCD (ACC/AHA 2013) in patients with CKD, and to analyse the effect of renal function in prediction terms.
Materials and methodsA prospective, observational study was conducted to evaluate the ability to predict CVE risk using CVR prediction scores: FRS-CVD and ASCVD (ACC/AHA 2013) in patients with CKD. The study included a cohort of 400 consecutive CKD patients, seen in outpatient Nephrology departments. The inclusion criteria were: age 40–79 years, with CKD stage 1–4 (not on dialysis), in accordance with the Kidney Disease Outcomes Quality Initiative (KDOQI) guidelines.22 The exclusion criteria were recent hospitalisation (last 4 months) and refusal to participate in the study.
The baseline data collected were: age, sex, CKD aetiology (identified by clinical findings and confirmed mainly by biopsy), history of CVE (heart failure determined by echocardiography in the last 3 months, myocardial infarction, peripheral vascular disease, cerebrovascular disease), traditional CVR factors such as dyslipidaemia (defined according ATP III guidelines or similar, if the patient received treatment with statins),6 diabetes mellitus and smoking.
Baseline renal function was also assessed (estimated glomerular filtration rate [eGFR] using the MDRD-4 equation, serum cystatin C and the albumin/creatinine ratio was also measured); nutritional and inflammatory parameters included low-density cholesterol (LDL), high-density cholesterol (HDL), total cholesterol and high-sensitivity C-reactive protein (CRP). The laboratory parameters were measured by autoanalysers using standardised methods. Serum CRP was measured by latex-enhanced turbidometric immunoassay on a Hitachi analyser (Sigma Chemical Co., St. Louis, MO, USA). Urine albumin excretion was measured by immunonephelometry and blood pressure was read with an automatic electronic sphygmomanometer (Omron MX3, Omron Life Science, Kyoto, Japan).
Patients were followed up for 40.3±6.6 months and data on CVEs were collected. CVEs were defined as: AMI (diagnosed by elevated cardiac markers and ECG changes and confirmed by cardiac catheterisation), heart failure (diagnosed using clinical criteria [Framingham] or a left ventricular ejection fraction <45%), stroke (diagnosed by computed tomography), peripheral vascular disease (diagnosis based on stenosis of the primary arteries or lower extremities confirmed by arteriography or the need for amputation, and other ischaemic conditions such as mesenteric ischaemia and optic neuritis). We analysed the scores as predictors of these events according to the estimated CVR. CVEs were divided into atherosclerotic (fatal and non-fatal AMI, fatal and non-fatal stroke, and fatal and non-fatal peripheral vascular disease) and non-atherosclerotic (heart failure) events.
Both scores were calculated at baseline: FRS-CVD and ASCVD (ACC/AHA 2013) to estimate CVR. According to FRS-CVD, CVR was defined as low (<10%), intermediate (10–20%) or high (>20%).7 According to ASCVD (AHA/ACC 2013), CVR was defined as low (<5%), intermediate (5–7.5%) or high (>7.5%).10
Statistical analysisValues were expressed as mean (standard deviation) or median (interquartile range) depending on their distribution, which was assessed using the Kolmogorov–Smirnov test. Patients were stratified into two groups according to each of the scores: high CVR (>20% using FRS-CVD and >7.5% using ASCVD) and non-high CVR, which corresponds to low/intermediate risk (<20% using FRS-CVD and <7.5% using ASCVD). The predictive capacity of each of the scores was determined by a survival analysis between these two sub-groups (high CVR vs. non-high CVR). Using the area under the curve (AUC), the sensitivity and specificity for the cut-off point defined as high CVR for estimating atherosclerotic CVEs were determined. The independent predictive capacity of each of the scores (FRS-CVD, ASCVD [AHA/ACC 2013]) was analysed in a multivariate adjusted analysis for renal function (eGFR by MDRD-4, serum cystatin C) and history of CVE using a Cox regression test. The concordance between both scores for stratifying CVR was verified using an intraclass correlation coefficient. A p-value<0.05 was considered statistically significant.
Statistical analysis was performed using SPSS statistical package, version 20.
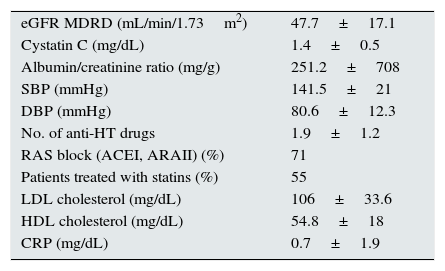
ResultsBaseline characteristicsThe mean study follow-up was 40.3±6.6 months. The mean age of the sample was 64.7±10.3 years, and patients were predominantly male (62%); 8.5% were active smokers, 23% had a history of diabetes mellitus and 15% had a history of cardiovascular disease. The remaining baseline characteristics are described in Table 1.
Baseline characteristics.
| eGFR MDRD (mL/min/1.73m2) | 47.7±17.1 |
| Cystatin C (mg/dL) | 1.4±0.5 |
| Albumin/creatinine ratio (mg/g) | 251.2±708 |
| SBP (mmHg) | 141.5±21 |
| DBP (mmHg) | 80.6±12.3 |
| No. of anti-HT drugs | 1.9±1.2 |
| RAS block (ACEI, ARAII) (%) | 71 |
| Patients treated with statins (%) | 55 |
| LDL cholesterol (mg/dL) | 106±33.6 |
| HDL cholesterol (mg/dL) | 54.8±18 |
| CRP (mg/dL) | 0.7±1.9 |
Anti-HT: anti-hypertensive agents; ARAII: angiotensin II receptor antagonists; eGFR MDRD: estimated glomerular filtration rate using the MDRD equation; HDL: high-density lipoproteins; ACEI: angiotensin-converting enzyme inhibitors; LDL: low-density lipoproteins; No.: number; CRP: C-reactive protein; RAS: renin–angiotensin system; DBP: diastolic blood pressure; SPB: systolic blood pressure.
The most common CKD aetiology was diabetic nephropathy (18%), followed by glomerular (16%), vascular (14%), unknown origin (14%) and chronic tubulointerstitial disease (7%), and others (31%).
Overall cardiovascular riskAccording to FRS-CVD, the mean CVR was 27±17.7%, and according to ASCVD (ACC/AHA 2013) it was 22±17.5%. Without considering the different CKD stages, 59% of the sample was grouped as high CVR according to FRS-CVD, compared to 15% as low risk. Using the AUC for the cut-off point defined as high CVR, the sensitivity and specificity for predicting atherosclerotic CVEs were 81% and 45%, respectively.
The ASCVD score (ACC/AHA 2013) stratified 75% of patients as having a high CVR. Using the AUC for the cut-off point defined as high CVR, the sensitivity and specificity for predicting atherosclerotic CVEs were 91% and 32%, respectively.
The concordance between both scores for grouping patients as high CVR was excellent, with an intraclass correlation coefficient (95% confidence interval [CI]) of 0.89 (0.87–0.91).
Cardiovascular risk according to chronic kidney disease stageSignificant differences were found between the various CKD stages for the CVR estimated by both scores (p<0.001, Chi-square test). With more advanced CKD stages, a higher proportion of subjects were grouped as high CVR versus low/intermediate risk. Although this occurred with both scores, it is noteworthy that ASCVD grouped a higher number of patients as high risk versus low/intermediate risk, as compared to FRS-CVD (Figs. 1 and 2).
Cardiovascular events
 according to CKD stage.")
With a mean follow-up of 40.3±6.6 months, 83% of patients did not present any CVEs. A total of 79 CVEs were recorded, 49 of which were atherosclerotic events (27 episodes of ischaemic heart disease, 10 strokes, 12 peripheral vascular disease); 30 were non-atherosclerotic, all episodes of heart failure.
Prediction of cardiovascular eventsThe CVR scores only predicted atherosclerotic CVEs; they were not predictive of episodes of heart failure (FRS-CVD log rank: 2.7; p: 0.09 and ASCVD [AHA/ACC 2013] log rank: 2.1; p: 0.1).
Cardiovascular survival according to FRS-CVD and ASCVD (AHA/ACC 2013)Patients classified as high CVR according to FRS-CVD presented a reduced cardiovascular survival (log rank 12.2; p<0.001, Fig. 3). Of the 234 patients classified as high CVR, 40 presented an atherosclerotic CVE (hazard ratio [HR] 3.3; 95% CI: 1.6–6.9; p: 0.001). Cardiovascular survival was also worse in patients with high CVR according to ASCVD (AHA/ACC 2013) (log rank 8.5; p<0.001, Fig. 4). Of the 301 patients, 42 presented an atherosclerotic CVE (HR 4.1; 95% CI: 1.5–11.3; p: 0.007). Thus, the majority of the atherosclerotic CVEs occurred in the group with high CVR, estimated using both scores (40/49 according to FRS-CVD and 47/49 according to ASCVD).
 Cardiovascular survival according to the Framingham score ≥20% vs. <20%. FRS: Framingham risk score. (B) Cardiovascular events observed in the high cardiovascular risk group (FRS ≥20%); all patients in the high cardiovascular risk group according to the Framingham score (blue bar, n=234), patients within this group who experienced a cardiovascular event (red bar, n=49), patients within this group who did not experience cardiovascular events (n=185).")
(A) Cardiovascular survival according to the Framingham score ≥20% vs. <20%. FRS: Framingham risk score. (B) Cardiovascular events observed in the high cardiovascular risk group (FRS ≥20%); all patients in the high cardiovascular risk group according to the Framingham score (blue bar, n=234), patients within this group who experienced a cardiovascular event (red bar, n=49), patients within this group who did not experience cardiovascular events (n=185).
 Cardiovascular survival according to the ASCVD (ACC/AHA 2013) score ≥7.5% vs. <7.5%. (B) Cardiovascular events observed in the high cardiovascular risk group (ASCVD≥7.5%); all patients in the high cardiovascular risk group according to ASCVD (blue bar, n=301), patients within this group who experienced a cardiovascular event (yellow bar, n=49), patients within this group who did not experience cardiovascular events (green bar, n=252).")
(A) Cardiovascular survival according to the ASCVD (ACC/AHA 2013) score ≥7.5% vs. <7.5%. (B) Cardiovascular events observed in the high cardiovascular risk group (ASCVD≥7.5%); all patients in the high cardiovascular risk group according to ASCVD (blue bar, n=301), patients within this group who experienced a cardiovascular event (yellow bar, n=49), patients within this group who did not experience cardiovascular events (green bar, n=252).
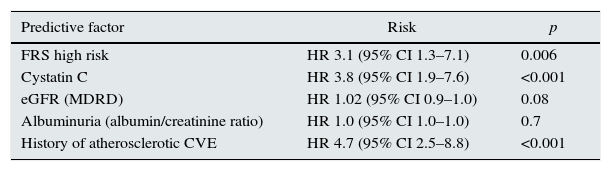
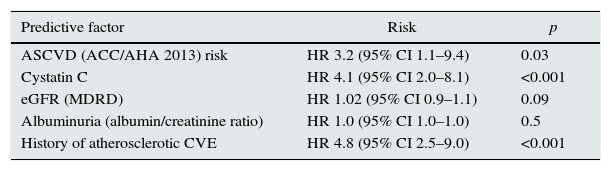
The prediction of atherosclerotic CVEs with each of the scores (FRS and ASCVD [AHA/ACC 2013]) was significant and independent in an adjusted model for renal function (eGFR by MDRD and serum cystatin C), albuminuria (albumin/creatinine ratio) and history of cardiovascular disease of atherosclerotic origin (Tables 2 and 3).
Prediction of cardiovascular risk according to Framingham score. Cox multivariate adjusted regression model for renal function, albuminuria and history of atherosclerotic cardiovascular event.
| Predictive factor | Risk | p |
|---|---|---|
| FRS high risk | HR 3.1 (95% CI 1.3–7.1) | 0.006 |
| Cystatin C | HR 3.8 (95% CI 1.9–7.6) | <0.001 |
| eGFR (MDRD) | HR 1.02 (95% CI 0.9–1.0) | 0.08 |
| Albuminuria (albumin/creatinine ratio) | HR 1.0 (95% CI 1.0–1.0) | 0.7 |
| History of atherosclerotic CVE | HR 4.7 (95% CI 2.5–8.8) | <0.001 |
Cox multivariate regression, model 1.
Cardiovascular risk prediction according to ASCVD score. Cox multivariate adjusted regression model for renal function, albuminuria and history of atherosclerotic cardiovascular events.
| Predictive factor | Risk | p |
|---|---|---|
| ASCVD (ACC/AHA 2013) risk | HR 3.2 (95% CI 1.1–9.4) | 0.03 |
| Cystatin C | HR 4.1 (95% CI 2.0–8.1) | <0.001 |
| eGFR (MDRD) | HR 1.02 (95% CI 0.9–1.1) | 0.09 |
| Albuminuria (albumin/creatinine ratio) | HR 1.0 (95% CI 1.0–1.0) | 0.5 |
| History of atherosclerotic CVE | HR 4.8 (95% CI 2.5–9.0) | <0.001 |
Cox multivariate regression, model 2.
During the 40.3±6.6-month follow-up, there were 17 deaths, 10 of which were secondary to atherosclerotic CVEs. Neither of the two scores (FRS-CVD p: 0.15; ASCVD [AHA/ACC 2013] p: 0.11) were able to predict mortality. Only the serum cystatin C levels (HR 3.1; [95% CI 1.2–8.0]; p: 0.01) predicted fatal CVEs independently of cardiovascular disease history and the scores.
DiscussionIn this prospective study on patients with CKD, both CVR scores (FRS-CVD and ASCVD [AHA/ACC 2013]) were independent predictors of atherosclerotic CVEs.
The prevalence of high CVR estimated in our sample was 59% (FRS-CVD) and 75% (ASCVD [AHA/ACC 2013]), which is consistent with the findings of other studies that predict CVR using scores.20,23,24 Both scores presented excellent concordance on grouping the sample into the high CVR sub-group; nevertheless, more subjects were grouped as high CVR according to ASCVD (AHA/ACC 2013) compared to FRS-CVD.
CKD is a powerful predictor of CVEs. This can be explained by the high prevalence of traditional (age, sex, diabetes mellitus, high blood pressure, dyslipidaemia) and non-traditional (CKD-specific, such as GFR, albuminuria, anaemia, phosphate-calcium metabolism and inflammation, among others) CVR factors.14–18 The effect of these two groups of risk factor on the CVR has a dichotomous relationship: predominance of the traditional CVR factors in incipient stages and of the non-traditional in more advanced stages of CKD. In our sample, CKD was a powerful predictor of CVD and, likewise, more severe stages of CKD determined that a higher proportion of patients were grouped in the high CVR sub-population.
The different CVR prediction equations usually include traditional risk factors among their variables, but very few include CKD. Despite this, several studies have found that the effect of adding these CKD-specific variables (GFR, proteinuria, albuminuria, serum cystatin C) to a traditional equation, such as the Framingham score, achieves only a slight increase in terms of prediction power.19
CVR prediction scores have been widely criticised in the literature due to their capacity to overestimate CVR in the general population.8,21 Studies that include the CKD population show limited discriminative capacity with the Framingham score,20 although there is evidence to suggest that FRS-CVD can predict CVEs in the high CVR population.23 The ASCVD score has generated a lot of discussion to date, not only because of its capacity to overestimate the CVR,21 but also because stratifying a large proportion of subjects as high CVR (>7.5%) implies a greater use of statins in the apparently healthy population21; however, there is very little information on its use in the CKD population.
In our 40.3±6.6-month follow-up study, we observed 79 CVEs, 30 of which corresponded to episodes of heart failure. Neither of the two instruments was able to predict these non-atherosclerotic events, even though FRS-CVD is designed to be able to predict heart failure.7 ASCVD (ACC/AHA 2013) does not include non-atherosclerotic events such as heart failure within its predictive profile.10 In contrast, atherosclerotic events (49 in the follow-up) were predicted with both scores (FRS-CVD, ASCVD [ACC/AHA 2013]) in an independent manner among the population defined as high CVR, in the adjusted model for renal function and history of atherosclerotic CVEs.
The sensitivity for predicting these atherosclerotic CVEs with each of the scores for the cut-off point defined as high CVR (>20% using FRS-CVD and >7.5% according to ASCVD [AHA/ACC 2013]) was similar (81% for FRS-CVD and 91% for ASCVD [AHA/ACC 2013]). However, both have low specificity (45% FRS-CVD and 32% ASCVD [AHA/ACC 2013]), which considerably increases the false positive rate and reduces its discriminative capacity. Considering that a large proportion of the sample was classified as high CVR vs. low/intermediate CVR, it is fundamental to be able to distinguish which subjects will go on to develop an event versus those who will not. The latter—its low discriminative capacity—is one of the major criticisms made of all CVR prediction equations.8,20,21
A low mortality rate was recorded during follow-up: 17 deaths, only 10 of which corresponded to fatal CVEs. Neither of the scores was able to predict these events. The utility of serum cystatin C to predict CVEs and cardiovascular death has recently been described.25 In our study, only serum cystatin C was able to predict mortality, independently of each of the scores and the history of cardiovascular disease.
The prediction scores estimate the likelihood of experiencing a CVE in the next 10 years, so our study's follow-up time of 40.3±6.6 months is probably insufficient for assessing their predictive power in this population group, hence the low rate of CVEs recorded during follow-up. Other studies with even shorter mean follow-up have reported a higher rate of CVEs.23 It is to be expected that with longer follow-up time, the rate of “observed” events would approach the rate of “expected” events.
Several previous studies conducted on the non-CKD population have shown an overestimation of risk, so the events predicted with the scores are greater than those that actually occur.8 This implies poor discrimination in the general population. In contrast, studies conducted with the Framingham score have detected an underestimation of CVR, whereby the events predicted are fewer than those that actually occur.20 There is currently no equation accurate enough to predict CVR in both the general population and patients with CKD.8,10,20,21
The applicability of CVR prediction scores in patients with CKD has been widely discussed because, since this is a population presenting high CVR, the estimation may be inaccurate.20,21 There are several factors that render it particularly difficult to predict CVR in this population: non-traditional CVR factors, reverse epidemiology, the importance of volume overload and, as a result, the lower prevalence of atherosclerotic events in more advanced CKD stages.16–18 In this respect, a CVR prediction score has recently been designed for patients with end-stage CKD on dialysis, but its external validity and generalisation of results are yet to be defined.26 In contrast, for patients with CKD who are not on dialysis, only the traditional CVR prediction scores are available today, many of which do not include CKD-specific variables within their design.19
The study is not without limitations. The main limitation, as we previously indicated, is the short follow-up time. Furthermore, the sample size is probably insufficient, as different CKD stages are included. This, together with the follow-up time, may have affected the low rate of CVEs recorded. It is likely that, in more advanced stages of CKD, the effect of non-traditional factors plays a predominant role and exponentially increases the CVR, which could translate into a higher number of CVEs. In the latter hypothetical situation, estimating CVR using conventional equations might prove inaccurate.
The traditional Framingham score has been evaluated in the CKD population with non homogeneous results20,23; however, the contemporary ASCVD score (AHA/ACC 2013)10 is yet to be assessed in these patients. To date, this is the only study that analyses the predictive value of these two instruments—one more traditional and the other more contemporary—in the renal patients population. According to our data, both estimate CVR in a similar fashion (grouping a large proportion of patients as high risk) and can predict atherosclerotic CVEs, though the implications and utility of these tools in the long term are yet to be defined.
In conclusion, despite their limitations, CVR prediction scores (FRS-CVD and ASCVD [AHA/ACC 2013]) can independently estimate the likelihood of atherosclerotic CVEs in CKD patients.
Conflicts of interestThe authors declare that they have no conflicts of interest.
Please cite this article as: Cedeño Mora S, Goicoechea M, Torres E, Verdalles U, Pérez de José A, Verde E, et al. Predicción del riesgo cardiovascular en pacientes con enfermedad renal crónica. Nefrologia. 2017;37:293–300.


