Knowing total body volume (V) is crucial in patients on peritoneal dialysis (PD). It is usually calculated by the Watson anthropometric formula, although the use of bioimpedance spectroscopy (BIS) is becoming increasingly widespread. Measuring V with both methods can at times produce quite different results.
ObjectiveWe aimed to identify differences between the 2 forms of measuring volume in a PD unit and determine which clinical factors are associated with these differences.
MethodsOurs is an observational study of 74 patients on PD. We measured V using BIS (Vbis) and the Watson formula (Vw); 271 measurements were made with each method. We calculated the difference between Vbis and Vw in each patient and classified them into 2 groups: Difference between volumes ≥10% or <10% Vbis. We assessed the presence of several clinical parameters in our patients.
We assessed whether there were any differences between Vbis and Vw (Student t-test). We determined whether there was any association between the difference in volumes and the presence of the clinical parameters analyzed (chi square test).
ResultsV was 2.15 l higher measured by the Watson formula than with BIS (p<0.01). In 58.67% of the measurements, the difference between Vbis and Vw was ≥10%.
Significant differences were found when comparing the presence of difference between volumes and the presence or not of diabetes mellitus (DM) (p=0.03), hypertension (HTN) (p=0.036), hypoalbuminemia (p<0.01), hypoprealbuminemia (p<0.01), low phase angle at 50Hz (p<0.01), high C reactive protein (p<0.01), obesity (p=0.027), E/I ratio (ratio between extracellular and intracellular water) ≥1 (p<0.01) and residual diuresis (p=0.029).
ConclusionsThere are significant differences in the V of PD Unit patients when obtained by Watson formula or by BIS. A difference between the measurements is associated with the presence of DM, HTN, hypoalbuminaemia, obesity, malnutrition, inflammation, E/I ratio ≥1 and the absence of residual diuresis.
Conocer el volumen corporal total (V) es fundamental en los pacientes en diálisis peritoneal (DP). Habitualmente calculado mediante fórmula de Watson, el empleo de bioimpedancia espectroscópica (BIS), cada vez está más generalizado. Frecuentemente, al medir el V con ambos métodos surgen amplias diferencias.
ObjetivoEvaluar si aparecen diferencias entre ambas formas de medir el V en una unidad de DP y analizar qué factores clínicos se asocian a estas diferencias.
MétodosEstudio observacional. Se incluyó a 74 pacientes en DP. Medimos el V empleando BIS (Vbis) y fórmula de Watson (Vw); se recogieron 271 mediciones por cada método. Calculamos diferencia entre volúmenes en cada medición y los clasificamos en 2 grupos: diferencia ≥10% o <10% de Vbis. Evaluamos la presencia de una serie de parámetros clínicos en nuestros pacientes.
Analizamos si existen diferencias entre Vbis y Vw (de Student). Valoramos si existe asociación entre las diferencias entre volúmenes y la presencia de los parámetros clínicos analizados (chi cuadrado).
ResultadosEl Vbis fue 2,15 l mayor que Vw (p<0,01). El 58,67% de las mediciones tenían diferencia entre Vw y Vbis ≥10%. Aparecen diferencias significativas al comparar la presencia de diferencia entre volúmenes y la presencia o no de diabetes (p=0,03), hipertensión (p=0,036), hipoalbuminemia (p<0,01), hipoprealbuminemia (p<0,01), bajo ángulo de fase a 50Hz (p<0,01), proteína C reactiva elevada (p<0,01), obesidad (p=0,027), exceso de grasa corporal (p<0,01), E/I ratio (cociente entre agua extracelular y agua intracelular)≥1 (p<0,01) y diuresis residual (p=0,029).
ConclusionesExisten diferencias en el V de los pacientes de una unidad de DP según sea calculado por fórmula de Watson o por BIS. La presencia de hipertensión, diabetes, hipoalbuminemia, obesidad, malnutrición, inflamación, E/I ratio ≥1 y la ausencia de diuresis residual se asocia con la aparición de estas diferencias.
The measurement of total body volume (V) is a crucial parameter in patients on peritoneal dialysis (PD). First, it helps to assess the patient's hydration status, although what is more relevant is he percentage of water relative to the total body composition. However, the absolute value of V is used as the denominator in the Kt/V equation; therefore, it is a key element to know the dialysis efficiency.
The most common way to determine V in dialysis patients is by anthropometric mathematical formulas, which are simple and easily applicable. The most commonly used in the general population, almost universally, is the Watson formula.1
However, this equation has not been validated in patients with different pathologies, particularly in dialysis patients. The Watson formula uses patient's sex, age, weight and height, but it does not take into account the body composition nor the distribution of water in patients on PD as compared to general population.2–4
Recently, dialysis centers are using the bioimpedance spectroscopy (BIS) technique in both hemodialysis5,6 and PD7–10 patients. This technique uses a low intensity multifrequency alternating current passing through the patient's body to determine a number of nutritional and hydration parameters, including the V.11 BIS measurement is a simple, painless and risk-free technique. Frequently, BIS measurements are replacing the traditional anthropometric formulas as a method to determine V in dialysis patients, or even both methods are used to calculate V. However, sometimes, in the same patient the values of V obtained with these two methods are considerably different which generates uncertainty about which of the two V values should be accepted as valid.
The purpose of this study is, first, to assess whether there are differences in V measurements in PD patients using BIS and an anthropometric formula (Watson formula), and second, to assess which factors may influence the occurrence of these differences.
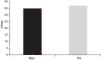
Patients and methodsWe conducted a prospective observational study involving 74 PD patients, 42 males (56.76%) and 32 females (43.24%) with an average age of 59, 98±16, 96 (range 24.13 and 82.98 years). The causes of renal failure were diabetic nephropathy (25.68%), followed by chronic tubulointerstitial nephropathy (22.97%), chronic glomerulonephritis (18.92%), nephrosclerosis (12.16%), hepatorenal polycystic disease (6.76%) and ischemic nephropathy (2.70%), while the etiology was unknown in 10.81%. Continuous ambulatory peritoneal dialysis (CAPD) was used in 41 patients (55.41%), while automated peritoneal dialysis (APD) was used in 33 (44.59%). According to the peritoneal transport as measured by D/P creatinine, 47.97% were in the medium-low average transport, 47.60 in the medium-high, 2.58% in the high and 1.85% in the low. The criteria to apply CAPD or APD was the patient's personal choice. Exclusion criteria for this study were the unability to perform the BIS test accurately: presence of major amputations and being a carrier of metal components such as stents, pacemakers, prosthetic joints or defibrillators.
Values of height and weight were obtained in each patient and a measurement of body volume by BIS (Body Composition Monitor: Fresenius Medical Care) for total body volume (Vbis) was performed. Also a measurement of hydration, extracellular water, intracellular water and E/I ratio was carried out. BIS was performed after fasting, without diálisis12 solution in the abdomen and with an empty bladder in those patients who maintained residual kidney function. The body volume was also calculated using the standard Watson equation (Vw) (men: V=2.447−(0.09156×age)+(0.1074×height)+(0.3362×weight); women: V=(0.1096×height)+(0.2466×weight)−2.097). Once the volume was obtained by both methods, patients were separated into two groups according to the difference obtained using the two methods: ≥10% or <10% of Vbis (these percentages are above the standard error of V measurements using BIS, which is estimated at 5%,). In total, we have 271 volume measurements from the 74 patients previously described. The volumes are expressed as arithmetic mean plus standard deviation. Student t test was used to analyze whether the difference between Vbis and Vw was significant. In turn, we performed a Bland Altman test to evaluate the correlation between the 2 methods.
In each patient, a number of features considered potentially responsible for generating differences between volumes were recorded.
- -
Personal parameters: age (≥65 or <65 years) and sex (male or female).
- -
Clinical and pathological parameters: presence or absence of hypertension (defined as taking at least 2 antihypertensive drugs), dyslipidemia, diabetes mellitus (DM), ischemic heart disease, neuropathy, peripheral vascular disease measured by ankle-brachial index and the use of antiplatelets aggregation agents or anticoagulants.
- -
Parameters associated with dialysis: type of PD (CAPD or APD), peritoneal transport (D/P Cr ≥0.65 or <0.65) and presence of residual diuresis (defined as greater than or equal to 400cc/24h).
- -
Nutritional and inflammatory parameters: E/I ratio measured by BIS (≥1 or <1), obesity (BMI ≥30 or <30kg/m2), % of body fat by BIS (≥25 or <25% in men and 30% in women), prealbumin (≥25 or <25mg/dl), hypoalbuminemia (serum albumin ≥3.5 or <3.5g/dl), phase angle at 50Hz (greater or lower than average phase angle at 50Hz obtained in all analyzed patients: 4.31°) and CRP (≥5 or <5mg/l).
Subsequently, we used the chi-square test to assess whether there is an association between the differences in volume and the presence or absence of the described clinical parameters.
All statistical tests (Student t test, Bland Altman test and chi square test) were performed by using SPSS 15.0 for Windows, being p<0.05 considered as significant.
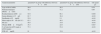
ResultsWe assessed the presence or absence of a number of factors and clinical parameters in patients and in the way measurements were carried out. This information is shown in Tables 1 and 2.
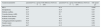
Risk factors present in the measurements.
| Percentage (%) | |
|---|---|
| Hypoalbuminemia (<3.5g/l) | 62 |
| Prealbumin <25mg/dl | 32.1 |
| Phase angle (50Hz) <4.3° | 52 |
| E/I (>1) | 32.8 |
| Obesity (BMI≥30kg/m2) | 29.9 |
| Body fat ≥25%/30% in male/female | 67.2 |
| Elevated CRP (>5mg/l) | 60.5 |
| Peritoneal transport (D/P Cr ≥0.65) | 50.2 |
| Overhydration (OH>1.1L) | 59 |
| Residual diuresis (>400cc/24h) | 58.7 |
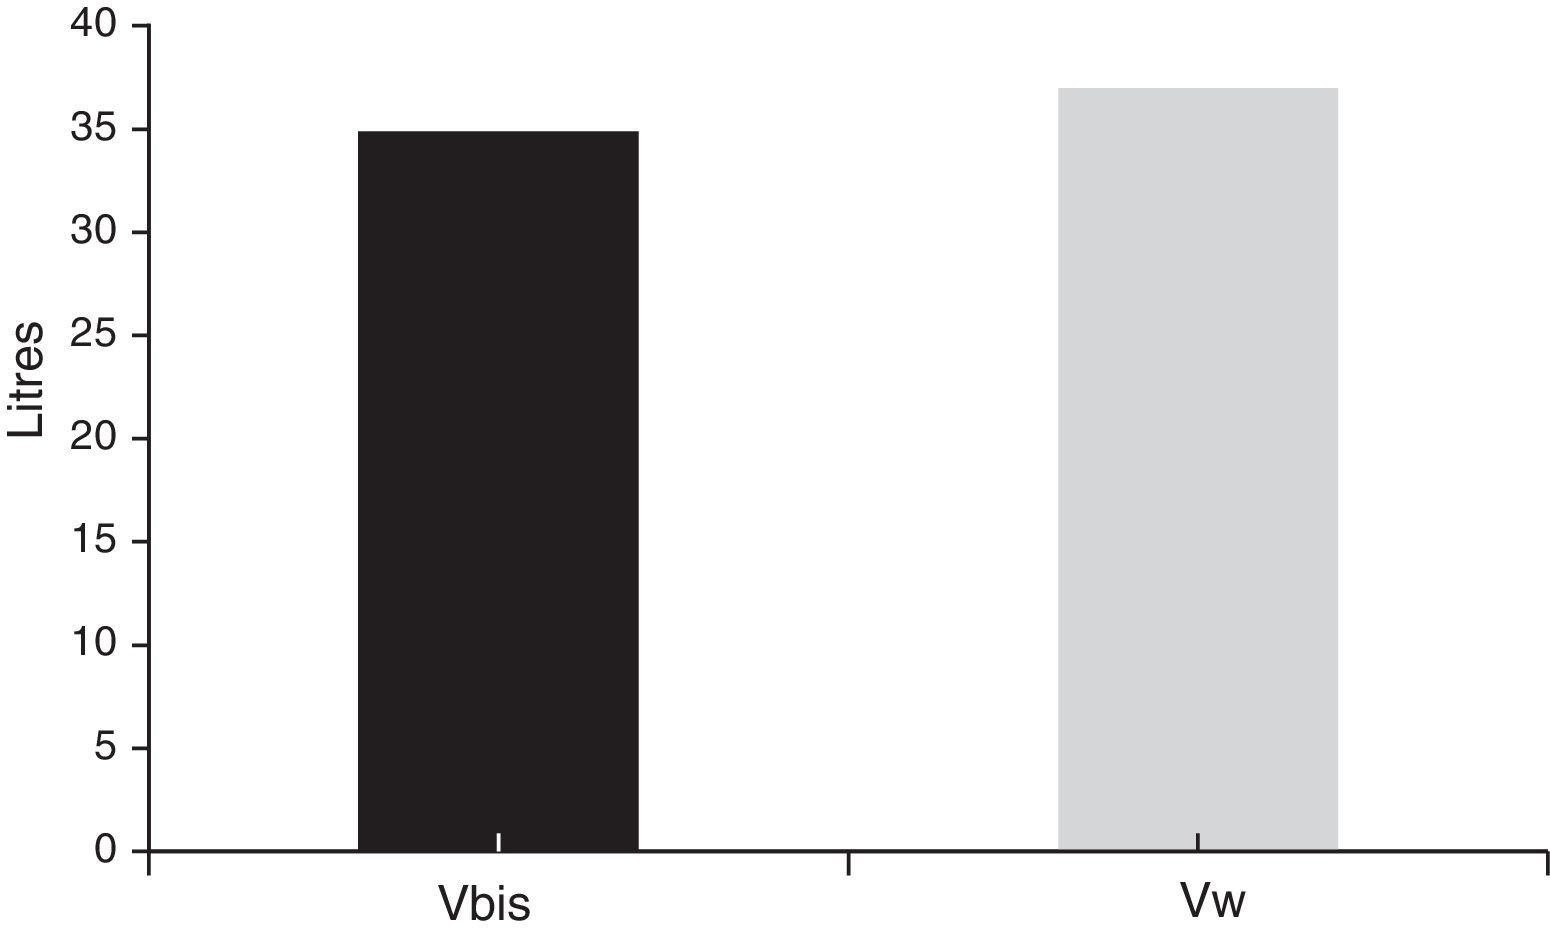
The average Vbis was 34.88±7.81l, while the average Vw was 37.03±6.3l. The difference between the two volumes was 2.15l (p<0.01) (Fig. 1). The agreement between VW and Vbis values was significant (r: −0.25, p<0.01).
Parameters were separated according to the difference between the 2V values: ≥10% or <10%. The difference between the two V values was ≥10%, in 58.67% of the measurements while in 41.33% of the measurements, the difference was <10%.
Comparison of risk factors or clinical features between patients with or without difference in volumes revealed no significant difference in dyslipidemia (p=0.63), peripheral vascular disease (p=0.63), ischemic heart disease (p=0.96), ischemic neuropathy (0.93), antiaggregant/OCP (p=0.92), gender (p=0.69), age (p=0.18), peritoneal transport type (p=0.09) and type of PD (p=0.79). However, significant differences were found in the presence of hypertension (p<0.05), DM (p<0.05), hypoalbuminemia (p<0.01), hypoprealbuminemia (p<0.01), obesity (BMI) (p<0.05), excess of body fat (p<0.01), inflammation as measured by C reactive protein (CRP) (p<0.01), E/I high (p<0.01) decreased phase angle at 50Hz (p<0.01) and residual diuresis (p<0.05) (Tables 3 and 4).
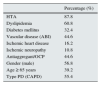
Comparison of clinical, pathological and personal parameters and V differences (Chi square).
| Analyzed parameter | parameter% in a group with difference between V>10% | parameter% in a group with difference between V<10% | Chi square (p) |
|---|---|---|---|
| HTA | 90.2 | 81.4 | 0.036 |
| Dyslipidemia | 64.7 | 61.9 | 0.63 |
| Diabetes mellitus | 42.5 | 29.7 | 0.03 |
| Vascular disease (ABI) | 52.9 | 50 | 0.63 |
| Ischemic heart disease | 16.3 | 16.1 | 0.96 |
| Ischemic neuropathy | 10.5 | 10.2 | 0.93 |
| Antiaggregant/anticoagulation | 50.9 | 40.7 | 0.92 |
| Gender (male) | 59.5 | 61.9 | 0.69 |
| Age (over 65) | 49.7 | 41.5 | 0.18 |
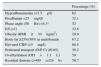
Comparison of nutritional and inflammatory parameters associated with dialysis and V differences (Chi square).
| Analyzed parameter | parameter% in group with difference between V>10% | parameter% in group with difference between V<10% | Chi square (p) |
|---|---|---|---|
| Type of PD (CAPD) | 56.9 | 58.5 | 0.79 |
| Peritoneal transport (PD/Cr≥0.65) | 45.1 | 71.2 | 0.09 |
| Residual diuresis (≥400cc) | 52.9 | 66.1 | 0.029 |
| Serum albumin (<3.5g/l) | 81.7 | 38.4 | <0.01 |
| Prealbumin (<25mg/dl) | 52.9 | 5.1 | <0.01 |
| Phase angle at 50Hz (≥4.31°) | 62.1 | 49.2 | <0.01 |
| E/I (≥1) | 59.5 | 33.9 | <0.01 |
| Obesity (BMI≥30 kg/m2) | 35.3 | 22.9 | 0.027 |
| % of body fat (≥25% male or ≥30% female) | 77.1 | 53.4 | <0.01 |
| PCR (≥5mg/dl) | 81 | 33.9 | <0.01 |
Determination the V with the highest possible accuracy in PD patients is essential. Besides being necessary to determine the dialysis efficiency (Kt/V13 equation), excess of volume is associated with inflammation,14 malnutrition,15 hypertension, ventricular hypertrophy,16,17 acardiovascular events18,19 and other pathological processes.20 Therefore, finding the most objective way of measuring this volume in our patients is essential.
Techniques commonly accepted as gold standard, such as deuterium dilution techniques are costly, complex or painful, and thus have limited applicability in everyday clinical practice. Measuring V with the Watson formula is seen as an easy and applicable method, this is why this method for calculating the body volume is widespread in dialysis centers.19,20 The avenue of BIS during the recent years has changed the method to assess hydration status in dialysis patients. BIS's theoretical advantage is that directly measure V and thus eliminates the error that may occur in anthropometric formula, to the point that it has been compared in several studies to gold standard methods in the measurement of V.20,21 It also provides important information about the patients’ distribution of body water and nutritional status. Therefore, at present, both ways of measuring V can be regarded as appropriate in clinical practice.
The problem arises when both methods (Vbis and Vw) lead to considerable differences. Measuring the volume with the Watson formula should be simple, and results are applicable, at least, to the general population. However, PD patients have, by definition a different distribution of body water as compared to the general population and, in turn, they often have a number of clinical and pathological conditions that may contribute to the different distribution of V. These patients may benefit from measuring V with BIS and not with the Watson formula, which takes into account gender, age, weight and height, but is not influenced by the complex combination of factors present in PD patients.
In the study conducted in our PD unit, first we observed, as in other studies, that the Watson formula overestimates V as compared with BIS22,23 measurement. We also found significant differences in some of the features of patients according to whether they had differences in V: hypertension, diabetes, residual diuresis, obesity (due to BMI and % of body fat), serum albumin/prealbuminemia, PCR, phase angle at 50Hz and E/I. Specifically, the difference between Vbis and Vw was greater than 10% in hypertensive, diabetic, obese (BMI≥30kg/m2 and body fat percentage ≥25% in men and 30% women), malnourished (albumin <3.5g/dl, prealbumin <25mg/dl and phase angle at 50Hz below average), swollen (PCR >5mg/l) patients and in patients without residual diuresis and E/I ratio greater than one, significantly.
While assessing the reason why these patients show a difference between Vbis and Vw, it became evident that particularly diabetic24,25 patients, had a tendency for inflammation which causes a different distribution of body volume.
The same can be applied to malnourished patients. Interestingly, regardless of the method used for evaluation, either prealbumin, or albumin (as nutritional marker, apart from morbidity and mortality marker) or the increasingly used phase angle at 50Hz for BIS26,27 in all cases the presence of poor nutrition generates differences between the two methods of assessing V. This is probably related to inflammation and the different distribution of body water.
Something similar occurs in obese patients: excess of body mass due mainly to fat, but also to lean mass and, the tendency to fluid overload may interfere with the use of the formula for the calculation of V.28,29
The excess of volume, or the abnormal distribution in the body, is another factor causing the difference between Vbis and Vw. Considering residual diuresis, patients that maintain diuresis once initiated into the technique have better control fluids, which is beneficial. And patients with lees diuresis tend to be malnourished.30 Therefore, it is not surprising that large differences between the two ways of measuring V arise in patients who have no diuresis, and worse management of body water.
Something similar may occur in cases of hypoalbuminemia. It is well known that the loss of oncotic pressure caused by reduced serum proteins generates a redistribution of the intravascular volume with a tendency to edema and formation of “third space”. This is not accounted for by Watson formula,31 which only takes into account the weight, age, height and sex, but does not consider16 nutritional status or inflammation.
The same happens with the high E/I ratio. A result >1 may be caused either by an excess of extracellular water, and therefore hyperhydration and edema, or by a lack of intracellular water, and thus low “total cell mass” and malnutrition or even the association of both.32 In any case, the conclusion would be the same: different distribution of body volume and, therefore, a likely benefit from a direct measurement of V.
We do not know whether in the general population differences in V would we seen and whether the previously described factors (hypertension, diabetes mellitus, hypoalbuminemia, hipoprealbuminemia, high CRP, obesity, decreased phase angle at 50Hz and high E/I), are applicable. In addition, it is unknown whether performing PD, is a necessary factor for these differences to appear.
In conclusion, an accurate determination of V in PD patients is essential and therefore it is important to find the most appropriate method to measure it considering clinical and pathological conditions. According to our results, PD patients with hypertension, diabetics, without residual diuresis, obese, swollen and malnourished may benefit from the determination of V using BIS. The results presented here should be confirmed with studies using greater number of patients.
FinancingThis study was partly supported by the BIOTYC Foundation (01/2011).
Conflict of interestAll authors reported to have no conflict of interest.
Please cite this article as: Fernández GM, Cerrato AO, de la Vara Iniesta L, Galera EO, Roldán CG, Martínez JP. Comparación entre bioimpedancia espectroscópica y fórmula de Watson para medición de volumen corporal en pacientes en diálisis peritoneal. Nefrologia. 2016;36:57–62.