Objetivo: Evaluar valores de corte (VC) para el diagnóstico del síndrome coronario agudo (SCA) en pacientes con insuficiencia renal crónica (IRC) para los biomarcadores cardíacos troponina I cardíaca (TnIc) y creatina cinasa MB (CK-MB) diferentes a los recomendados por los fabricantes de los reactivos y utilizados habitualmente en los laboratorios. Métodos: Realizamos un estudio prospectivo de pruebas diagnósticas en pacientes con IRC con una tasa de filtración glomerular estimada con la ecuación MDRD4 < 60 ml/min ingresados por sospecha de SCA según la historia clínica, la exploración física y el electrocardiograma. Se evaluó la concentración de TnIc y CK-MB al ingreso hospitalario y a los seis meses, utilizando dos sistemas analíticos diferentes (para TnIc, los analizadores Access® y Vidas®, y para CK-MB, los analizadores Access® y Vitros®). Resultados: Durante el período de estudio, se incluyeron 484 pacientes con IRC y sospecha de SCA. Se diagnosticó SCA en el 12 % de los pacientes (58/484), mientras que se encontraron otras patologías cardíacas en el 29 % (140/484) y otras patologías no cardíacas en el 59 % (286/484). Para la TnIc del analizador Access® con el VC habitual (≥ 0,5 ng/ml), la sensibilidad fue de 43 % y la especificidad de 94 %, mientras que para el VC propuesto (≥ 0,11 ng/ml), los valores fueron 68 y 83 %, respectivamente. Para la TnIc del analizador Vidas® con el VC habitual (≥ 0,11 ng/ml), la sensibilidad fue de 64 % y la especificidad de 87 %, mientras que para el VC propuesto (≥ 0,06 ng/ml), los valores fueron 75 y 79 %, respectivamente. La sensibilidad y especificidad de ambas CK-MB fueron inferiores comparadas con la TnIc. Conclusión: Los VC propuestos en este estudio para ambas TnIc para el diagnóstico de SCA en pacientes con IRC de grado 3 a 5 son significativamente diferentes de los utilizados para la población general.
Objective: The aim of our study was to evaluate cut-off values for acute coronary syndrome (ACS) diagnosis in patients with chronic renal failure (CRF) for the cardiac biomarkers cardiac troponin I (cTnI) and creatine kinase MB isoenzyme (CK-MB) as compared to the cut-off values proposed by the manufacturers and those frequently used in the laboratory. Method: We performed a prospective study in patients with CRF with a glomerular filtration rate estimated by the MDRD-4 equation <60mL/min and admitted with suspected acute coronary syndrome due to clinical history, physical examination, and electrocardiography. cTnI and CK-MB measurements were assessed upon hospitalisation and six months later using two different analytical methods (for cTnI: Access® and Vidas® analysers, and for CK-MB: Access® and Vitros® analysers). Results: During the study period, 484 patients with CRF and suspected ACS were assessed. ACS was diagnosed in 12% of patients (58/484), while we found other cardiac pathologies (OCP) in 29% of patients (140/484) and other non-cardiac pathologies (ONCP) in 59% of patients (286/484). For cTnI assessed using the Access® analyser with the usual cut-off value (≥0.5ng/mL), sensitivity was 43% and specificity was 94%, while for the proposed cut-off value (≥0.11ng/mL), the values were 68% and 83%, respectively. For cTnI assessed using the Vidas® analyser with the usual cut-off value (≥0.11ng/mL), sensitivity was 64% and specificity was 87%, while for the proposed cut-off value (≥0.06ng/mL), the values were 75% and 79%, respectively. The sensitivity and specificity for both CK-MB were lower compared with cTnI. Conclusion: The cut-off values proposed in this study for both cTnI in patients with CRF (stage 3 to 5) to diagnose ACS are significantly different from that of the general population.
INTRODUCTION
Cardiovascular diseases (CVD) are the primary cause of death in the world, as well as in patients with chronic renal failure (CRF),1-3 who have an increased risk due to the presence of atypical clinical symptoms4-6 during acute coronary syndrome (ACS) as compared to the general population. In addition, CVD-derived mortality involves substantial health, social, and economic costs due to the use of costly clinical and therapeutic resources. Approximately 75%-85% of patients evaluated in the emergency department or hospitalised due to the suspicion of ACS are ultimately not diagnosed with this condition.7-8
Of all the possible biomarkers used to indicate myocardial damage, such as total creatinine kinase (CK), creatinine kinase MB isoenzyme (CK-MB), myoglobin, cardiac troponin I (cTnI), and cardiac troponin T (cTnT), troponins are considered to be the pillar that supports the clinical evaluation, risk stratification, and therapeutic indications for patients with ACS who are treated in hospital emergency departments, but these biomarkers may also be elevated in patients with CRF without clinical symptoms of myocardial ischaemia such as ACS, making the interpretation of these parameters in this type of patient a difficult task.9-14
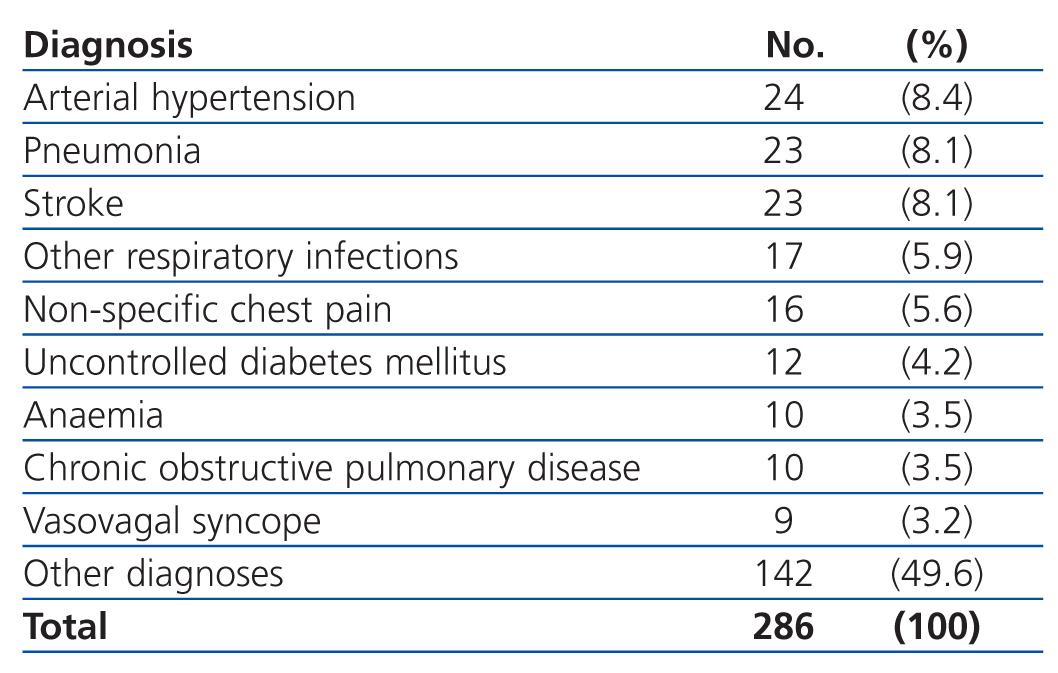
In this study, we sought to evaluate cut-off values (COV) for the diagnosis of ACS in patients with CRF using the cardiac biomarkers cTnI and CK-MB, and how these differ from the COV recommended by the manufacturers/distributors of these compounds and those commonly used in hospital laboratories (the COV recommended by the manufacturers of diagnostic reagents is the concentration that has been established in studies with patients from the general population and with no concomitant pathologies).
MATERIAL AND METHOD
Patients
We performed a prospective study examining the diagnostic tests carried out in the Ourense Hospital Complex between January 2009 and June 2010 (study period). The study population was composed of patients with varying levels of CRF (stage 3-5) and with the following inclusion criteria: patients with CRF and with an estimated glomerular filtration rate (eGFR) based on the MDRD4 equation15,16 <60ml/min/1.73m2 and who sought hospital care due to suspected ACS during the study period, and whose initial clinical evaluation included measurements of cTnI, CK-MB, and creatinine, in addition to a clinical history, physical examination, and electrocardiogram. The exclusion criteria were: patients transferred to another hospital, psychiatric patients, and those who refused to sign an informed consent. All patients freely gave their informed consent.
Patients were classified into three different groups based on the primary diagnosis obtained in the clinical history: 1) patients with ACS (gold standard); 2) patients with other cardiac pathologies (OCP); and 3) patients with other non-cardiac pathologies (ONCP). We used the diagnostic criteria for ACS established by the European Society of Cardiology in 200717 and the universal definition for acute myocardial infarction (AMI) from 2007,18 consisting of the following: ACS refers to the combination of clinical symptoms produced by acute myocardial ischaemia, primarily in the form of chest pain. These patients are subdivided into two groups based on electrocardiogram results: a) acute chest pain (>20 minutes) with persistent ST segment elevation (STE-ACS) and b) patients with acute chest pain but without ST segment elevation (NSTE-ACS) (this group includes patients with AMI without ST segment elevation and unstable angina). The universal definition of AMI from 2007 states that AMI exists when patients have at least one value above the 99th percentile for cardiac biomarkers (preferably troponin) and at least one of the following: myocardial ischaemia symptoms, changes in ST segments in electrocardiographic tests, development of pathological Q-waves, or imaging test evidence of a loss of viable myocardium. The OCP group included patients who were diagnosed with any type of cardiac pathology other than ACS. The ONCP group included patients with any type of pathology that was not heart related. Those patients diagnosed with multiple conditions and who could not properly be assigned to one of the aforementioned groups were not included in the study.
We estimated the appropriate study sample size for an expected prevalence of AMI of 15% based on the results from prior studies and bibliographic consultations. Based on an α error value of 0.05 and a precision of ±4% for a 95% confidence value, we calculated an optimal sample size of 484 patients. We recruited consecutive patients treated in the Ourense Hospital Complex until reaching the calculated sample size.
The study was carried out in two consecutive phases: phase I, or patient recruitment phase, in which the clinical variables were collected from clinical histories as well as laboratory parameters from the inter-laboratory information programme (Omega 2000), and phase II, or follow-up period, in which patients were monitored through telephone interviews and laboratory analyses 6 months after being incorporated into the study. We examined the following clinical variables: gender, age, tobacco use, diabetes mellitus, systemic arterial hypertension, a history of myocardial infarction or angina, chronic treatment regimens prior to hospitalisation (aspirin, beta blockers, angiotensin-converting enzyme inhibitors, or statins), chest pain, abdominal pain, dyspnoea, syncope, dizziness, 12-lead electrocardiogram upon hospitalisation, primary diagnosis, reason for discharge (disease resolution or death), and duration of hospital stay.
Biochemical markers
The biochemical markers analysed included cTnI, CK-MB, and creatinine, which were measured upon hospitalisation and after 6 months. Other tests compiled upon hospitalisation included cholesterol, triglycerides, high-density lipoproteins, low-density lipoproteins, and haemoglobin.
All tests were performed with blood serum samples in BD Vacutainer® tubes except for haemoglobin, which was evaluated using whole blood samples. The cardiac biomarkers cTnI and CK-MB were measured using different analytical systems: for cTnI measurements, we used Access® (Izasa) and Vidas® (BioMérieux) analysers; we used the Access® (Izasa) analyser for mass concentrations of CK-MB (CK-MBm), and the Vitros® (Johnson & Johnson) analyser for measuring CK-MB enzymatic activity (CK-MBact).
The Access AccuTnI® reactant manufactured by Beckman-Coulter is a chemiluminescent immunoenzymatic “sandwich” assay for quantitatively measuring cTnI levels. The detection threshold for this method is 0.02ng/ml, the upper reference limit (URL) or 99th percentile is 0.04ng/ml, and the COV recommended by the manufacturer for AMI is ≥0.5ng/ml.
Vidas® Troponin I Ultra is a reactant manufactured by BioMérieux that allows for measuring human cTnI in serum samples using an immunoenzymatic “sandwich” assay with fluorescence detection. The detection limit and URL is 0.01ng/ml, and the COV recommended by the manufacturer for the detection of AMI is ≥0.11ng/ml.
The Access CK-MB® reactant manufactured by Beckman-Coulter is a chemiluminescent immunoenzymatic “sandwich” assay for quantitative measurement of CK-MBm. The URL defined by the manufacturer is 6.3ng/ml, and the detection limit is 0.1ng/ml.
Measurements of CK-MBact using the Vitros® analyser manufactured by Johnson & Johnson uses the Vitros solid phase chemical system. The URL is 24U/l and the detection limit is 1U/l.
We measured creatinine using the Synchron LXi-725® analyser manufactured by Beckman, which uses the Jaffe method (alkaline picrate reactant) using the chemical kinetic method of spectrocolorimetry; the detection limit is 0.1mg/dl and the reference values range between 0.5mg/dl and 1.3mg/dl. GFR was estimated using the MDRD4 equation.15,16
Statistical analysis
We performed descriptive statistical analyses of the study variables based on the characteristics of each of these: quantitative variables were expressed as mean or median, and qualitative variables were expressed as frequencies and percentages. In order to compare sample means, medians, and proportions, we used ANOVA, Kruskal-Wallis, and Z-tests, respectively. We used parametric statistical tests in our study when it was possible. In all cases, we assumed an alpha risk value of 0.05 (95% confidence interval [CI]), and P-values <.05 were considered to be statistically significant. All statistical tests and figures were carried out using SPSS statistical software, version 15.
RESULTS
Characteristics of the study population
During the study period a total of 484 patients with CRF were examined for cardiac biomarkers due to suspicion of ACS. Six patients were excluded from the study: two due to transfer to another hospital, one due to acute renal failure, two due to a GFR>60ml/min/1.73m2, and another due to a repeated case. The mean patient age was 77 years (95% CI: 48-94 years), 68% were male (331), and 32% were female (153).
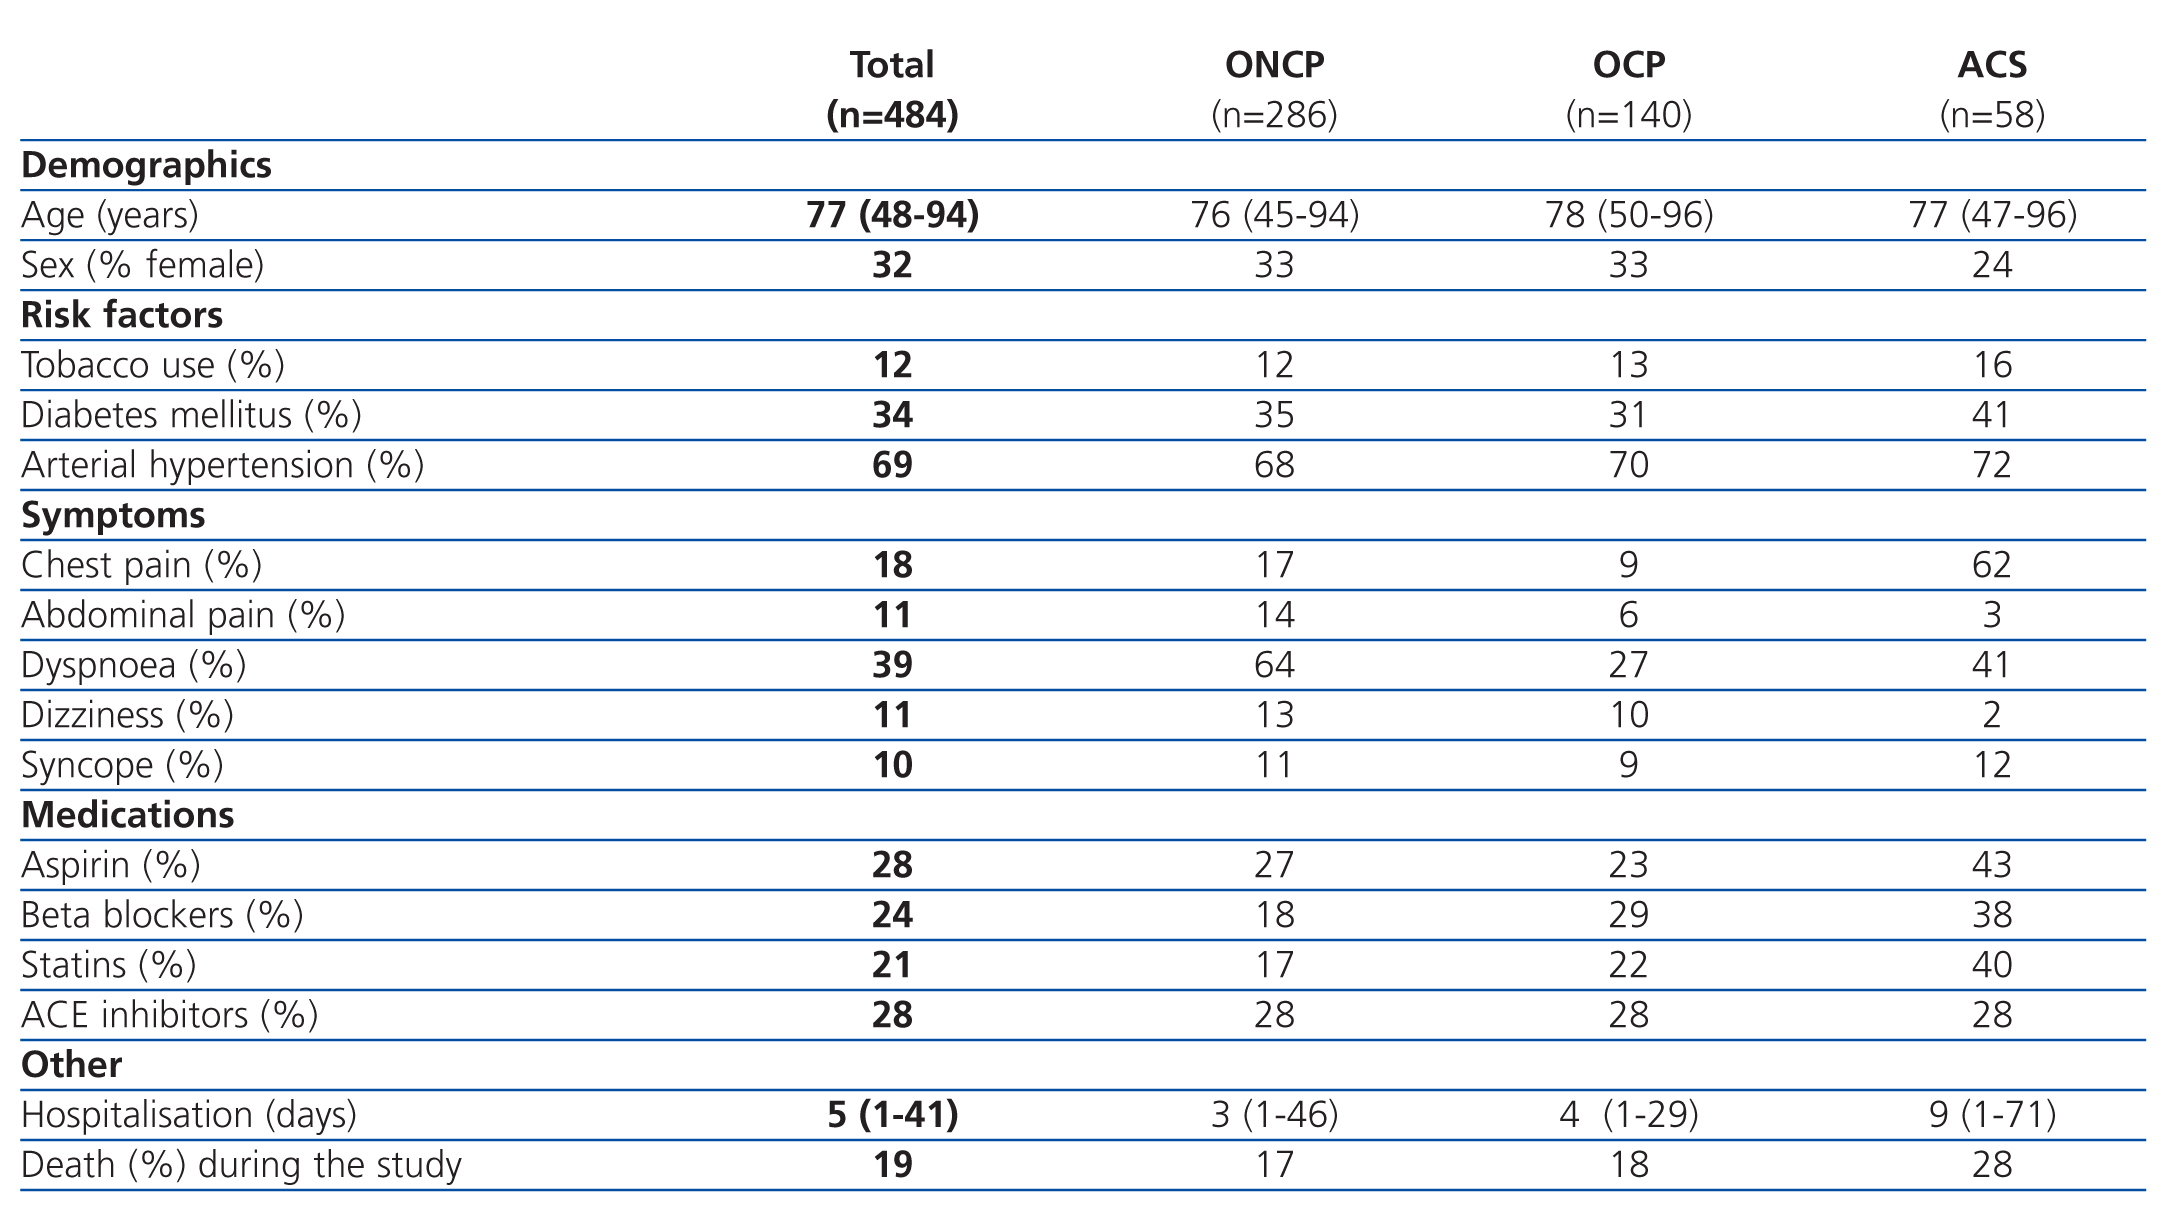
The patients were divided into 3 groups based on the primary diagnosis: ACS, OCP, and ONCP groups. ACS was identified in 12% of patients (58/484), OCP were identified in 29% (140/484), and ONCP were identified in 59% (284/484). Table 1 summarises the clinical variables measured in the overall sample and divided into patient groups. In the ACS group, coronary angiography was performed in only 32.7% of patients, with a lower frequency of use as the severity of CRF increased.
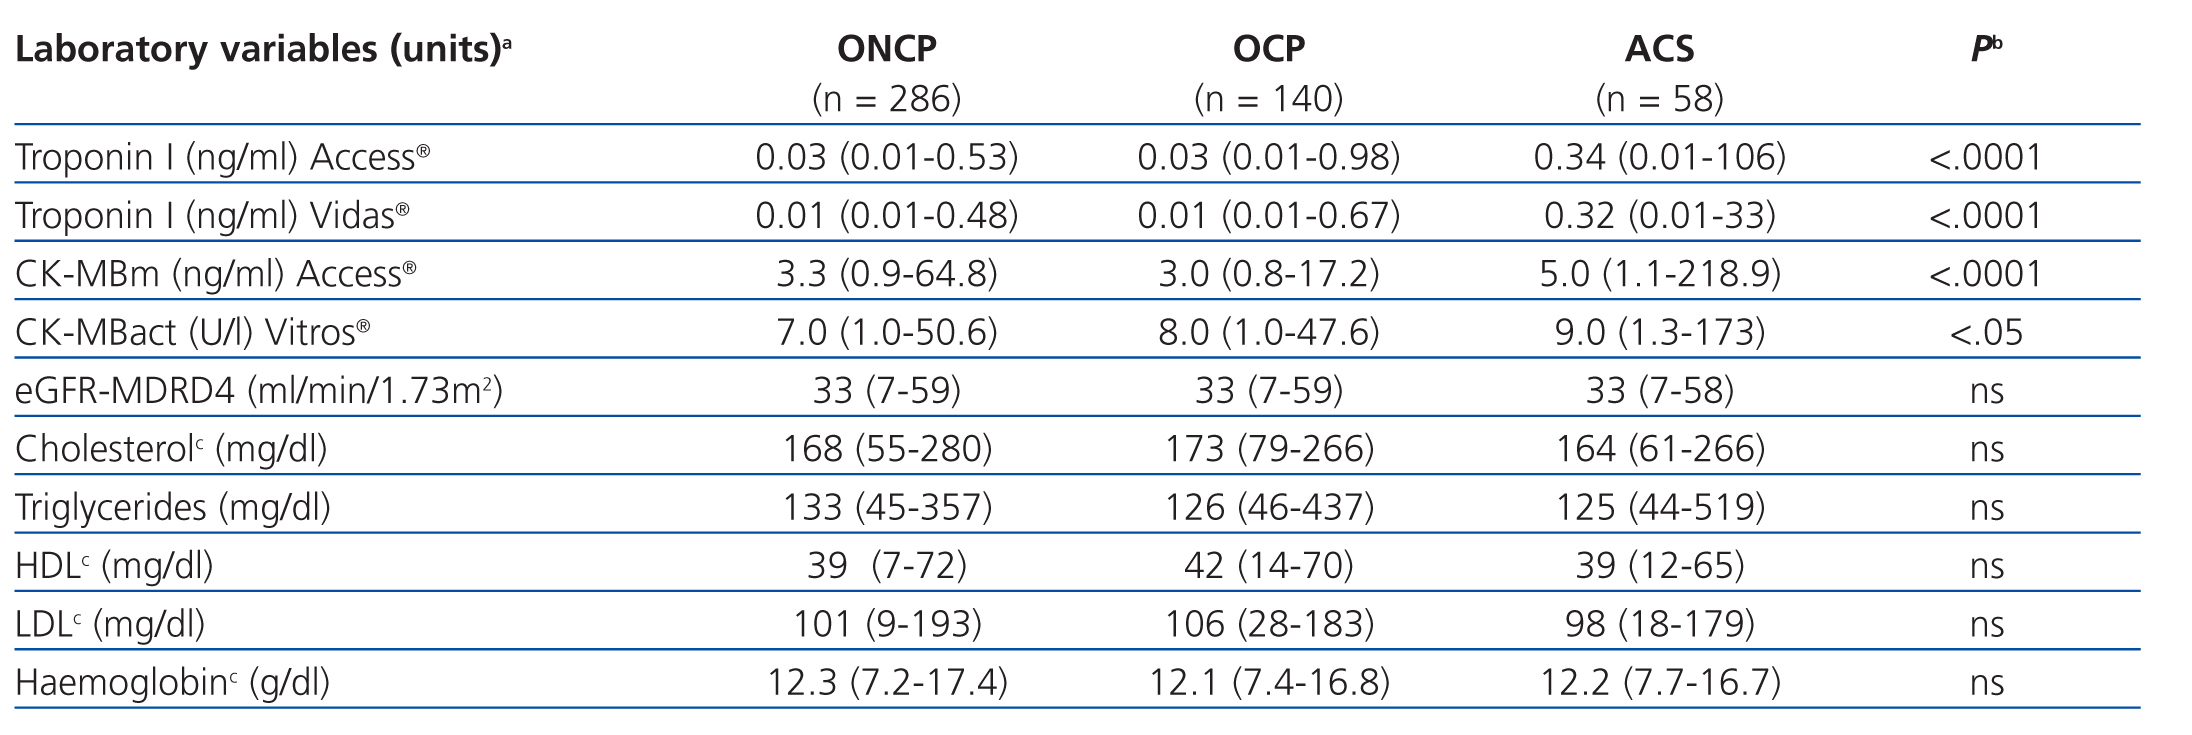
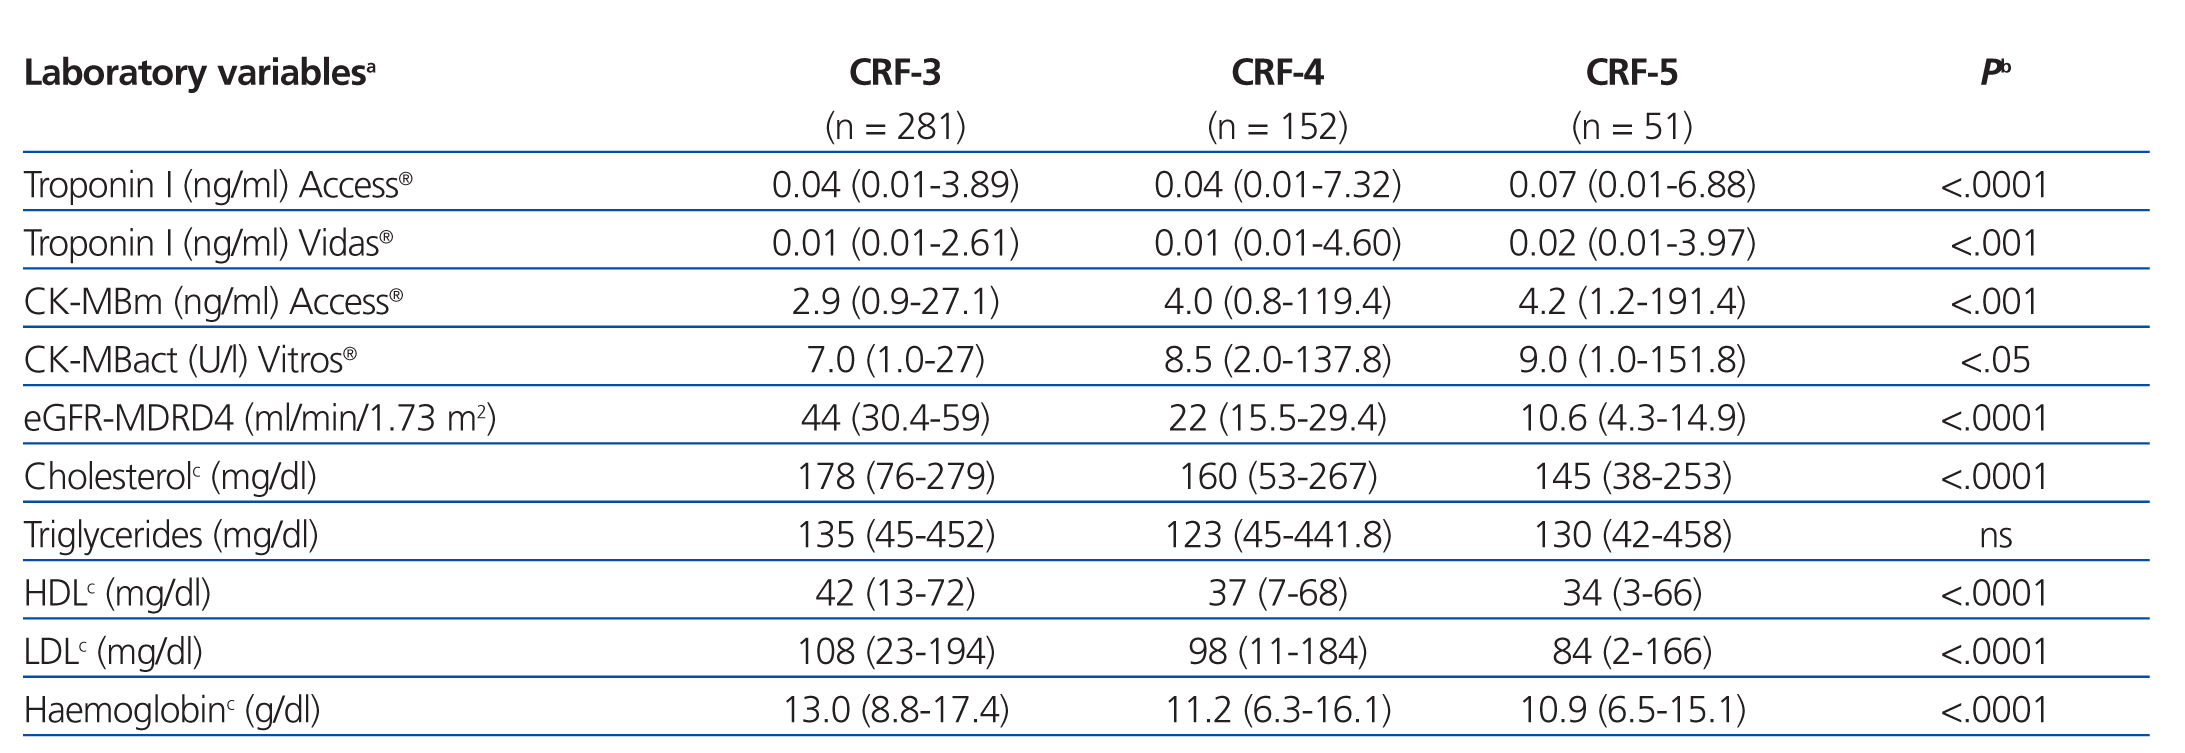
The results for each laboratory variable analysed are summarised in Table 2 (by patient group) and Table 3 (by level of CRF). The median levels of cardiac biomarkers measured at the moment of hospitalisation using the Access® analyser in patients from the ACS group were: cTnI: 0.34ng/ml (95% CI: 0.01-106ng/ml) and CK-MBm: 5ng/ml (95% CI: 1.1-218.9ng/ml). The measurement for cTnI using the Vidas® analyser was 0.32ng/ml (95% CI: 0.01-33ng/ml) and the measurement for CK-MBact using the Vitros® analyser was 9U/l (95% CI: 1.3-173U/l). In several patients with ACS, the initial concentration of cTnI or CK-MB was below the COV (even normal), but these values increased in subsequent measurements. In patients from the OCP group, the following results were obtained for cTnI using the Access® analyser: normal cTnI values in 62% of cases, grey zone cTnI values (elevated among the 99th percentile, but below the current COV) in 32%, and elevated cTnI values above the current COV in 6%, whereas cTnI values as measured using the Vidas® analyser were 57%, 25%, and 18%, respectively. In patients from the ONCP group assessed using the Access® analyser, normal cTnI results were observed in 71% of patients, grey zone cTnI values were observed in 25%, and elevated cTnI values above the current COV were observed in 4%. Using the Vidas® analyser, the results for cTnI were 74%, 13%, and 13%, respectively. Based on the severity of CRF, the study population was divided into patients with stage 3, 4, or 5 CRF (Table 3). A GFR within the interval of 30-59ml/min/1.73m2 was observed in 58% of patients (281), corresponding to stage 3 CRF.
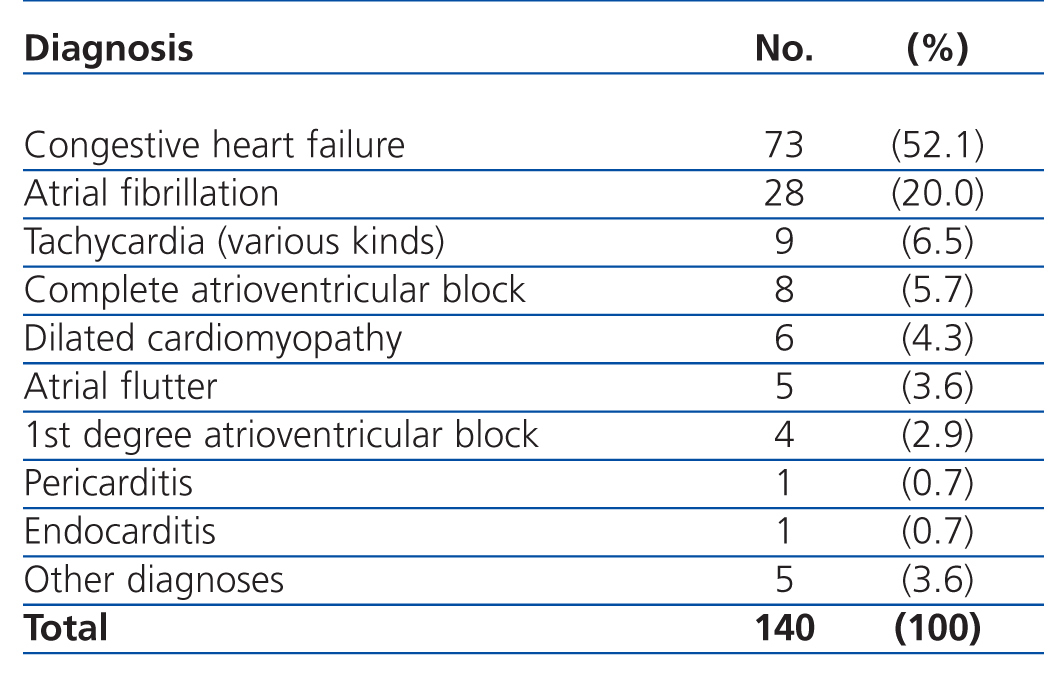
The most common primary diagnoses in the patients from our study sample were: congestive heart failure (15%), non-ST segment elevation myocardial infarction (6.6%), atrial fibrillation (5.8%), and arterial hypertension (5%). Table 4 shows the diagnoses for the OCP group, and Table 5 the results for the ONCP group. The median duration of hospital stay was 5 days (95% CI: 1-41 days). The mortality rate in our study patients was 19% (91 patients), and the primary mortality causes were congestive heart failure (20.9%) and AMI (12%). In 7 cases (1.4%), it was not possible to locate the patients by telephone or by mail in order to complete the six-month follow-up regimen.
Follow-up results
In the follow-up sessions with our study patients 6 months after inclusion in the study, we obtained information regarding state of health and subsequent hospitalisations due to AMI through a telephone interview in 386 patients that were still alive (we were unable to locate 7 patients). Additionally, we performed telephone interviews with the family members of 40 patients that died in the intervening period (the total number of patients that died during the study was 91, but 51 of these died during hospitalisation). 11 patients (12%) died due to AMI (two cases of re-hospitalisation due to AMI were recorded). The results from the laboratory analyses after 6 months (in 226 patients) were the following: values above the URL for cTnI were observed in 34 patients (15%) using the Access® analyser (5 in the ACS group, 14 in the OCP group, and 15 in the ONCP group) and in 42 patients (18%) using the Vidas® analyser (7 in the ACS group, 16 in the OCP group, and 19 in the ONCP group). Values above the URL for CK-MB were observed in 14 patients (6%) using the Access® analyser (4 in the ACS group, 6 in the OCP group, and 4 in the ONCP group) and in 7 patients (3%) using the Vitros® analyser (1 in the ACS group, 3 in the OCP group, and 3 in the ONCP group), although all were asymptomatic; the rest of the study patients had normal values for all cardiac biomarkers.
Based on the distribution of results for initial cTnI using the Access® analyser, the median cTnI value was greater in patients who died (0.08ng/ml) than in patients that survived (0.03ng/ml) (P<.0001), and similar results were observed using the Vidas® analyser, in which the median value for cTnI was greater in patients who died (0.05ng/ml) than in those who survived (0.01ng/ml) (P<.0001).
As regards the results for CK-MB, the median value for CK-MB at the start of the study using the Access® analyser was greater in patients who died (4.3ng/ml) than in those who survived (3.2ng/ml) (P<.0001), whereas the median CK-MB values at the start of the study as measured using the Vitros® analyser showed no statistically significant differences between patients who died and patients who survived.
ROC curves
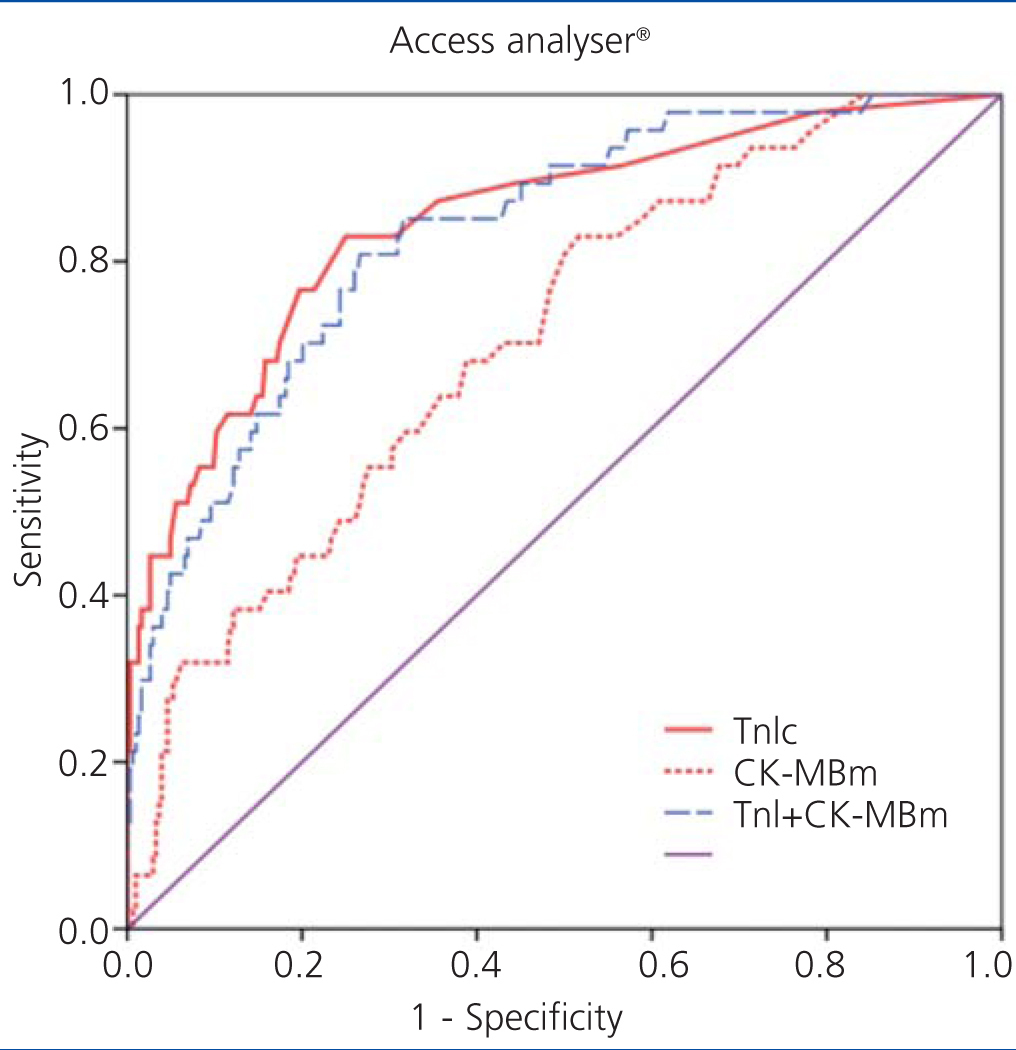
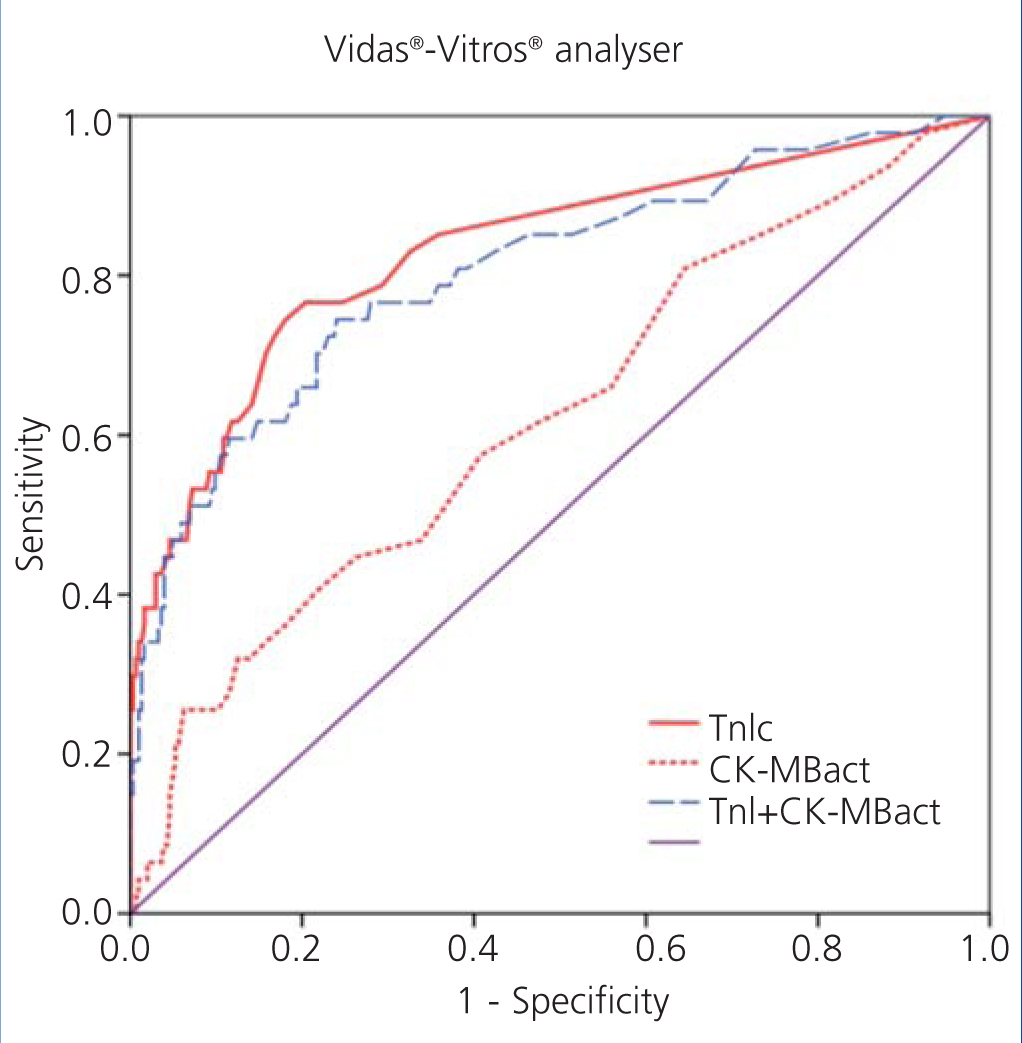
We examined receiver operating characteristic (ROC) curves for the different magnitudes obtained using both methods. The results for the different cardiac biomarkers used are presented in Table 6. The cTnI values for both analysers have a greater area under the curve than CK-MB mass and CK-MB activity.
Figure 1 displays the ROC curves for cTnI and CK-MB as obtained using the Access® analyser, and Figure 2 compares the ROC curves for cTnI using the Vidas® analyser and CK-MB using the Vitros® analyser.
The choice of a COV requires a detailed understanding of the medical decisions that are based on the results of these tests. The approach for deciding upon an optimal COV19 falls outside the scope of this study, and so we proposed a COV that improves the sensitivity for detecting ACS in these patients and that facilitates the application of early treatment techniques. An exploration of the ROC curves for cTnI, CK-MB mass, and CK-MB activity produces the following recommendations for the COV: the new COV that we propose for cTnI using the Access® analyser is ≥0.11ng/ml, since this provides a better sensitivity value (68%); we propose a new COV for the Vidas® analyser of ≥0.06ng/ml, with a sensitivity of 75% (both are better values than the sensitivity obtained using the COV currently in place in each laboratory for each analyser) (Table 7).
For CK-MB, the new COV that we propose using the Access® analyser is ≥4ng/ml, with a sensitivity of 67%, and the COV that we propose for CK-MB using the Vitros® analyser is ≥9U/l, with a sensitivity of 58% (better sensitivity values for both analysers than with the protocols currently in use).
DISCUSSION
Different options exist for possible COV that can be obtained for any troponin assay: 1) URL, which refers to the 99th percentile of troponin results in a reference population, 2) 10% coefficient of variation (VC), which is the troponin concentration at which the imprecision of the assay is 10%, and 3) COV based on the ROC curve (provided by the manufacturer), which involves a statistical procedure through which the optimal concentration is determined for each assay, which maximises clinical specificity and sensitivity in comparison with the gold standard.20 International guidelines17-18 have defined that an elevated troponin concentration is one that is above the 99th percentile in a healthy reference population, making this an abnormal result, but the exact value of the 99th percentile depends on the specific characteristics of said reference population,21 since it has been shown that troponin concentrations tend to increase in persons older than 60 years of age22 and in apparently healthy subjects that have undetected CVD. As such, the majority of laboratories accept the COV that are provided by the reactant manufacturers (based on ROC curves), or simply use the reference limits published in the medical literature. It has also been recommended that troponin assays be used with appropriate quality control and an optimal total imprecision (≤10% VC) at the 99th percentile value, which does apply to ultra-sensitive troponin assays; however, the majority of troponin assays currently in use have an intermediate imprecision value (10%-20% VC) at the 99th percentile, and some even have a >20% VC.23
We propose the use of a cTnI COV for diagnosing AMI in patients with CRF that is distinct from the COV for the general population, with a better sensitivity above the 99th percentile, since ACS is a lethal pathology and patients with CRF have a high degree of cardiovascular risk. Under this framework, the cTnI COV for the Access® system would be ≥0.11ng/ml, with a sensitivity of 68% and a specificity of 83%, while the COV for cTnI using the Vidas® system would be ≥0.06ng/ml, producing a sensitivity of 75% and a specificity of 79%. Given that cTnI has a better diagnostic potential, we believe that CK-MB (mass or activity) should not be assessed as a complementary test to cTnI for diagnosing AMI (due to the high associated costs), but rather as a means for diagnosing myocardial reinfarction24 and as a primary tool in hospitals that do not have access to laboratory techniques for analysing troponin levels.
The strategy of decreasing the COV would increase the number of cases of AMI diagnosed,25 but at the same time would allow patients with CRF to benefit from early therapy (conservative or invasive) and consequent improved prognoses. In the study by Lin et al.26 involving patients with suspected ACS, the prevalence of AMI was 13.5% using the COV calculated using the ROC curve, 17% using a 10% of COV, and 25% using the 99th percentile value.
According to the reagent manufacturer, the standard cTnI COV for diagnosing AMI with the Access® analyser (cTnI≥0.5ngml) provides a sensitivity of 96% and specificity of 94% for the general population. On the other hand, in our study, and using this same COV, we observed a sensitivity of 43% and a specificity of 94%; in a previous retrospective study carried out by our research group, the same COV produced a sensitivity of 70% and a specificity of 92% in patients with CRF.27 In a similar manner, the standard COV recommended by BioMérieux for the Vidas® analyser when measuring cTnI for the diagnosis of AMI is ≥0.11ng/ml, producing a sensitivity of 76% and a specificity of 94% (as indicated by the reagent manufacturer). However, in our study, this same COV produced a sensitivity of 64% and a specificity of 87%. As such, it would appear that the COV for both cTnI obtained in the general population have a lower diagnostic value in these patients with CRF.
An early diagnosis facilitated by the use of the 99th percentile of cTnI, which is increasingly lower with current assay techniques and ultra-sensitive troponin assays, allows for a faster identification of patients with AMI, but it is also important to mention that any damage to myocardial cells can cause the release of troponins into the bloodstream. As such, a wide variety of pathologies can produce elevated troponin levels, not only ischaemic causes, such that clinical variables must be used to distinguish the cause of elevated troponin levels for the purpose of treatment options, since this is a prognostic factor for adverse events in these patients. 28-32 The causes of elevated troponin levels in the absence of ACS can be divided into three groups: 1) cardiac diseases (whether in terms of myocardial damage or increased heart size); 2) non-cardiac diseases (general disorders or organ-specific disorders); and 3) methodological causes.33 In a similar manner, the causes of elevated CK-MB that are not related to ACS can be divided into 4 groups: 1) release of non-myocardial CK; 2) non-AMI cardiac damage; 3) reduced blood elimination of CKMB (hypothyroidism); and 4) methodological causes.34 In our study, the primary causes of elevated cTnI in the OCP group were congestive heart failure and atrial fibrillation, whereas in the ONCP group, the causes were CRF and arterial hypertension. In patients with CRF and no ACS, the frequency of elevated cardiac biochemical markers depended on the marker analysed and the analytical system used. In this manner, the rate of elevated cTnI values varies between 4% and 21%, and the rate for elevated cTnT values varies between 17% and 75%.1,28-29 Choy et al.12 registered a non-specific increase of 15% in cTnI values and 4% in CK-MB values.
Despite non-specific elevations in patients with CRF, cardiac troponins aid in the diagnosis of ACS (in combination with clinical symptoms and electrocardiogram results) and provide prognostic information for these patients, making proper interpretation of test results an essential step in providing appropriate treatment.
Our study does involve certain limitations, such as the lack of an evaluation of the time interval between the start of symptoms reported by the patient and the moment in which the blood sample was taken for cardiac biomarkers. Since it is difficult in many cases to accurately assess the time of evolution of the symptoms, primarily in the form of chest pain and dyspnoea, we decided not to include this variable.
Another limitation would be the lack of independence of the gold standard for the cardiac biomarkers. cTnI represents this gold standard for biochemical markers of myocardial damage, and is included in the universal definition for AMI in international consensus guidelines,18 in addition to clinical data and electrocardiographic results. Since cTnI is a diagnostic tool for AMI, it can exert substantial influence during the diagnostic process, especially in cases of atypical clinical symptoms or inconclusive electrocardiographic results.
The conclusions of our study are the following: 1) cTnI is the biological marker of choice for myocardial damage in patients with CRF (it provides a better diagnostic value than CK-MB, and the combined use of both markers does not improve the diagnostic value in these patients), and 2) the COV proposed in this study for both cTnI methods in the diagnosis of ACS in patients with stage 3-5 CRF are significantly different from those used for the general population. In this study, the proposed COV for cTnI using the Access® analyser is ≥0.11ng/ml, which improves the diagnostic sensitivity by 25% (from 43% using the standard COV of ≥0.5ng/ml to 68% using the new COV). For measuring cTnI using the Vidas® analyser, the proposed COV is ≥0.06ng/ml, which increases the diagnostic sensitivity by 11% (from 64% using the standard COV of ≥0.11ng/ml to 75% using the new COV). By decreasing the COV for cTnI, we can increase the sensitivity for diagnosing ACS, although this will also increase the number of false positives produced.
FUNDING
This research project forms part of the doctoral thesis of Larry M. Flores Solis, entitled Cardiac troponin I and creatinine kinase MB isoenzyme in patients with chronic renal failure, and was financed by the Ministry of Education through a grant from the National Program for the Formation of University Professors, reference number AP2005-2762.
Conflicts of interest
The authors state that they have no potential conflicts of interest related to the content of this article.
Table 1. Clinical characteristics of patients by group (n=484)
Table 2. Comparison of laboratory test values between patient groups (n=484)
Table 3. Comparison of laboratory values between patients based on chronic renal failure level (n=484)
Table 4. Primary diagnoses in the Other Cardiac Pathologies group (OCP)
Table 5. Primary diagnoses in the Other Non-cardiac Pathologies group (ONCP)
Table 6. Area under the ROC curve for cardiac troponin I and creatinine kinase MB
Table 7. Evaluation of the different cut-off levels for cardiac troponin I (Vidas and Access analysers) and for creatinine kinase activity* or mass** (for Vitros and Access analysers)
Figure 1. Comparison of areas under the curve for cardiac troponin I (cTnI) with mass concentration of creatinine kinase MB (CK-MBm) and with the combination of both using the Access analysers
Figure 2. Comparison of areas under the curve for cardiac troponin I (cTnI) with enzymatic activity of creatinine kinase MB (CK-MBact) and with the combination of both using Vidas-Vitros analysers


