Introducción: Aunque el cinacalcet ha mejorado el control del hiperparatiroidismo secundario en hemodiálisis, todavía un 50% de los pacientes no alcanzan las cifras de PTH recomendadas por las guías K/DOQI. El objetivo de este estudio fue analizar la eficacia del tratamiento del hiperparatiroidismo secundario con cinacalcet en pacientes no seleccionados en hemodiálisis crónica, de acuerdo con los objetivos marcados por las guías K/DOQI y KDIGO. Además, investigamos qué factores pueden influir en el grado de respuesta del hiperparatiroidismo secundario a cinacalcet. Material y métodos: Recogimos retrospectivamente la evolución de 74 pacientes en hemodiálisis con hiperparatiroidismo secundario que fueron tratados con cinacalcet durante al menos 6 meses. Resultados: De acuerdo con las guías K/DOQI, la proporción de pacientes con PTHi >300 pg/ml se redujo al 50%, la presencia de hiperfosforemia descendió del 38,4 al 23,3% y el producto Ca x P >55 mg2/dl2 bajó de 37,8 a 15,1%. La prevalencia de hipocalcemia aumentó de 2,7 al 12,3%. Con respecto a las guías KDIGO, la proporción con PTHi >600 pg/ml se redujo desde 41,1 al 16,4% y la de hiperfosforemia del 68,5 al 52,1%; pero al considerar a pacientes con PTHi inicial >600 pg/ml, la prevalencia de P >4,5 mg/dl descendió de 83,3 del 55,2%. Observamos un incremento de la dosis de carbonato cálcico (basal 0,61 ± 1,53 g de calcio elemento/ día frente a final 0,95 ± 1,98 g de calcio elemento/día; p = 0,03), debido más a la hipocalcemia que a la necesidad de quelar el fósforo. Encontramos menores descensos de la PTHi entre los pacientes que tenían prescrito inicialmente más sevelamer, y al final del seguimiento presentan mayores niveles séricos de PTHi (no sevelamer: 312 ± 245 pg/ml; sevelamer <6,4 g/día: 510 ± 490 pg/ml; sevelamer >6,4 g/día: 526 ± 393 pg/ml; p = 0,04) y de fósforo (no sevela mer: 4,5 ± 1,2 mg/dl; sevelamer <6,4 g/día: 4,2 ± 1,5 mg/dl; sevelamer >6,4 g/día: 5,7 ± 0,9 mg/dl; p = 0,01). El tratamiento asociado con paricalcitol no mostró ninguna influencia en el grado de respuesta. Los pacientes que alcanzaron los objetivos de PTH mostraron ya a los 3 meses de tratamiento un mayor descenso en los niveles séricos de PTHi (159 ± 84 frente a 630 ± 377 pg/ml; p <0,001), con dosis significativamente menores de cinacalcet (33,8 ± 22,5 frente a 51,1 ± 25,1 mg/día; p = 0,003). Con análisis multivariante, el grado de reducción de la PTHi dependió de sus cifras séricas iniciales y de la dosis inicial de sevelamer. Conclusiones: Cinacalcet mejora el control del hiperparatiroidismo secundario, si bien la respuesta es menor en los casos de mayor gravedad, representados por niveles más altos de PTH y mayores dosis iniciales de sevelamer. Por el contrario, un descenso importante de PTH a los 3 meses con dosis relativamente bajas de cinacalcet sería un marcador pronóstico de buena respuesta.
Introduction: Although cinacalcet has improved the control of secondary hyperparathyroidism in haemodialysis, 50% of patients still do not reach the PTH figures recommended by the K/DOQI guidelines. The objective of this study was to analyse the efficacy of treatment of secondary hyperparathyroidism with cinacalcet in unselected patients on chronic haemodialysis, according to the objectives set by the K/DOQI and KDIGO guidelines. Furthermore, we investigate what factors may influence the degree of secondary hyperparathyroidism response to cinacalcet. Material and methods: We retrospectively collected the evolution of 74 patients on haemodialysis with secondary hyperparathyroidism that were treated with cinacalcet for at least six months. Results: In accordance with K/DOQI guidelines, the proportion of patients with iPTH > 300pg/ml was reduced to 50%, the presence of hyperphosphataemia fell from 38.4 to 23.3% and the Ca x P product > 55mg2/dl2 fell from 37.8 to 15.1%. The prevalence of hypocalcaemia increased from 2.7 to 12.3%. With regard to the KDIGO guidelines, the proportion with iPTH > 600 pg/ml was reduced from 41.1 to 16.4% and that of hyperphosphataemia from 68.5 to 52.1%. However, when considering patients with initial iPTH > 600pg/ml, the prevalence of P > 4.5mg/dl fell from 83.3 to 55.2%. We observed an increase in the dose of calcium carbonate (baseline 0.61 ± 1.53g of elemental calcium/day versus final 0.95 ± 1.98g of elemental calcium/day; p = 0.03), due more to the hypocalcaemia than to the need to bind the phosphorus. We found smaller decreases in iPTH between the patients that had initially been prescribed more sevelamer, and at the end of follow-up they showed higher serum iPTH levels (no sevelamer: 312 ± 245pg/ml; sevelamer <_6.4g/ day: 510 ± 490pg/ml; sevelamer >6.4g/day: 526 ± 393pg/ml; p = 0.04) and phosphorus levels (no sevelamer: 4.5 ± 1.2mg/dl; sevelamer <_6.4g/ day: 4.2 ± 1.5mg/dl; sevelamer >6.4 g/ day: 5.7 ± 0.9mg/dl; p = 0.01). The treatment associated with paricalcitol did not show any effect on the degree of response. The patients that achieved the PTH objectives already showed a major decrease in the serum iPTH levels after 3 months of treatment (159 ± 84 versus 630 ± 377pg/ml; p < 0.001) with significantly lower doses of cinacalcet (33.8 ± 22.5 versus 51.1 ± 25.1mg/day; p = 0.003). With multivariate analysis, the degree of reduction in iPTH depended on its initial serum readings and on the initial sevelamer dose. Conclusions: Cinacalcet improves control of secondary hyperparathyroidism, although the response is lower in more severe cases, respresented by higher levels of PTH and higher initial doses of sevelamer. On the other hand, a significant decrease in PTH at 3 months with a relatively low dose of cinacalcet would be a prognostic marker for good response.
INTRODUCTION
In recent years new drugs have been introduced into daily clinical practice that have improved the degree of control of secondary hyperparathyroidism (SHPT) such as calcitrol, the selective activators of the vitamin D receptor (paricalcitol) and new calcium-free phosphorus binders such as sevelamer and lanthanum carbonate. Despite this therapeutic arsenal, achieving the objectives set by K/DOQI guidelines continues to be a difficult task for a significant number of patients. Cinacalcet is an oral calcimimetic agent that acts on the calcium-sensing receptor, which is the main regulator of the synthesis and release of parathyroid hormone (PTH). The activation of this receptor results in decreased concentrations of PTH and calcium, and in some cases in phosphorus as well, which achieves the objectives set by the guidelines.1-3
Lindberg1 demonstrated the efficacy of cinacalcet in the treatment of SHPT in reducing intact PTH (iPTH) readings by an average of 36-40% and calcium-phosphorus by 50-73%. Nevertheless, there has been little analysis of the factors that influence the magnitude of response to cinacalcet. The degree of control achieved depends on the previous PTH readings,2,4 so that patients with higher PTH tend to reach the guideline values less frequently (50% with PTH > 800pg/ml versus 70-73% with PTH < 800pg/ml). Furthermore, the association of paricalcitol increases the percentage of patients with control of PTH to 62% and the calcium-phosphorus product to 83%.4
Our objective in this study was to show the efficacy of cinacalcet in controlling SHPT in an unselected group of haemodialysis patients, more like actual practice, comparing the results achieved with the objectives proposed by the K/DOQI5 guidelines and the recently published KDIGO6 guidelines. Secondly, we set out to analyse what factors may influence the degree of PTH response to cinacalcet.
PATIENTS AND METHODS
This is a retrospective study in which we collected data on all patients who, having been on haemodialysis for more than 3 months, would have been treated with cinacalcet for SHPT for at least six months. Patients included did not coincide in time and were treated with cinacalcet between April 2005 and April 2008.
We included as analytical parameters total calcium, phosphorus and serum iPTH (chemiluminescence with selective monoclonal antibodies, Beckman-Izasa) before treatment with cinacalcet (baseline or B), at 3, 6, and 9 months, and at the end of the follow-up (final or F), as well as haemoglobin, haematocrit and usual serum biochemistry before and at the end of treatment with cinacalcet. All patients were dialysed with a calcium bath at 1.5mmol/l, in 3 weekly sessions lasting 3-4 hours. We collected data on the initial dose of cinacalcet, the maximum dose and the dose at the end of follow-up, which was the last monitoring performed or when it was terminated. The initial and final doses of phosphorus binders (calcium carbonate and sevelamer; there were no patients with calcium acetate) and paricalcitol were also collected. None of the patients received treatment with oral/iv calcitriol or with other phosphorus binders in the study period under consideration.
The data analysis was performed with the statistical package SPSS. For the comparison of means, we used the Student-t test for paired and unpaired data, and when the variables did not follow a normal distribution, we used the Wilcoxon test for paired samples and the Mann-Whitney test for unpaired samples. For the comparison of groups, we performed a variance analysis and for non-normal distributions we used the Kruskal-Wallis test. We used linear regression analysis as the multivariate analysis technique to show that the data followed a multivariate normal distribution. Statistical significance was assumed when p < 0.05.
RESULTS
The study included 74 patients, aged 61.7 ± 13.6 years (27-82 years) and 42 were men (56.8%). The average time on haemodialysis was 58.3 ± 57.7 months and follow-up treatment with cinacalcet lasted 15 ± 7 months (6-34 months).
Efficacy of cinacalcet in the management of secondary hyperparathyroidism
The initial dose was 30mg/day of cinacalcet, except in one patient who received 30mg/48 hours. After administering cinacalcet, iPTH decreased significantly with respect to baseline values (647 ± 329pg/ml): 22% at 3 months (506 ± 418pg/ml; p = 0.005), 28% at 6 months (466 ± 361pg/ml; p = 0.001), 45% at 9 months (362 ± 360pg/ml; p < 0.001) and 36% at the end of follow-up (403 ± 361pg/ml; p < 0.001). Calcium decreased from baseline (9.7 ± 0.8mg/dl) at 3 months (8.9 ± 0.9mg/dl; p < 0.001), at 6 months (9.1 ± 0.8mg/dl; p < 0.001), at 9 months (9.2 ± 1.0mg/dl; p < 0.001) and at the final time (9.1 ± 0.8mg/dl; p < 0.001). The alkaline phosphatase and phosphorus decreased significantly from baseline (5.3 ± 1.4mg/dl) at 3 months (4.8 ± 1.6mg/dl; p = 0.011), at 6 months (4.7 ± 1.6mg/dl; p = 0.006), at 9 months (4.7 ± 1.7mg/dl; p = 0.014) and at the end of follow-up (4.6 ± 1.5mg/dl; p = 0.003).
At the end of follow-up, the cinacalcet dose used was: 30mg/48 h in 20.3%, 30mg/day in 43.2%, 60mg/day in 21.6% and 90mg/day in 13.9%. The maximum dose used was: one patient 110mg/day, 90mg/day in 24.3%, 60mg/day in 31.1%, 30mg/day in 41.9% and one patient stayed with 30mg/48 h.
After cinacalcet, the calcium carbonate dose significantly increased (B 0.61 ± 1.53g of elemental calcium/day; F 0.95 ± 1.98g of elemental calcium/day; p = 0.03), while there was no overall modification of the paricalcitol dose (B 1.7 ± 4.8mg/week versus F 2.5 ± 4.9mg/week; p = NS) or of sevelamer (B 2.7 ± 3.7g/day versus F 2.1 ± 3.7g/day; p = NS).
Control objectives achieved according to the K/DOQI and KDIGO guidelines
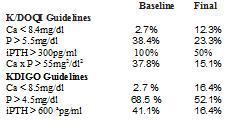
When compared to the recommendations of the K/DOQI guidelines, 38.4% had a P > 5.5mg/dl prior to treatment with cinacalcet, which decreased to 23.3%. The prevalence of hypocalcaemia with Ca < 8.4mg/dl increased from 2.7 to 12.3% after treatment with cinacalcet. The percentage of patients with PTH > 300pg/ml was reduced from 100 to 50% and patients with Ca x P product > 55mg2/dl2 decreased from 37.8 to 15.1% (Table 1).
In agreement with the KDIGO guidelines (Table 1), after they were treated with cinacalcet, the number of patients with P > 4.5mg/dl decreased from 68.5 to 52.1% and the prevalence of patients with Ca < 8.5mg/dl increased from 2.7 to 16.4%. Furthermore, the percentage of patients with iPTH > 600pg/ml decreased from 41.1 to 16.2% (the KDIGO guidelines recommend maintaining their levels between 2 and 9 times the normal limits according to the technique used, and to aim for an iPTH < 600pg/ml, since above these levels there is greater mortality for all causes in the DOPPS study.)
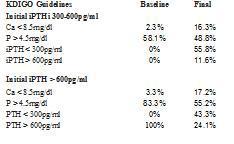
The objectives achieved in the degree of control over various parameters of bone mineral metabolism depend on the baseline iPTH levels (Table 2). When started from an iPTH > 600pg/ml, the percentage of patients with P > 4.5mg/dl changed from 83.3 to 55.2%. When iPTH was initially at 300-600pg/ml, the prevalence of patients with P > 4.5mg/dl decreased from 58.1 to 48.8%. In both cases the prevalence of hypocalcaemia increased. In the group that had a baseline iPTH of 300-600 pg/ml, we observed that 55.8% reached an iPTH < 300pg/ml, as did 43.3% of the group that had an initial iPTH > 600pg/ml, with 24.1% remaining at an iPTH > 600pg/ml (Table 2).
Factors that influence the degree of response to cinacalcet
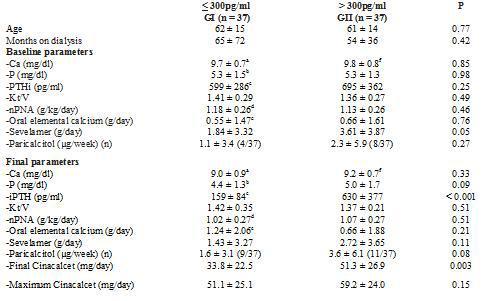
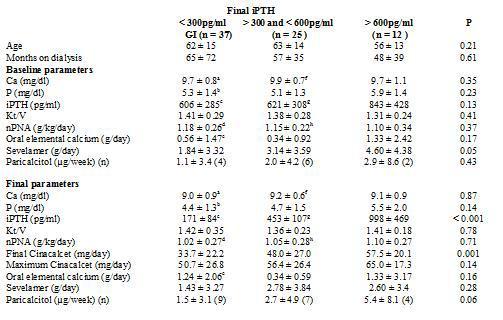
To analyse which factors can predict, at baseline, the degree of response to cinacalcet, we divided the group according to the levels of iPTH reached at the end of the follow-up. We employed as a cutoff point the target levels for PTH indicated by the K/DOQI guidelines, for which there are two groups according to the final iPTH: either ≤ 300pg/ml or > 300pg/ml, as shown in Table 3. Furthermore, we also considered the target readings suggested by the DOPPS study and the KDIGO guidelines, thus separating into 3 groups, as shown in Table 4. We did not find differences between the groups in terms of age, time on dialysis or the sex ratio or of diabetics.
When comparing the initial iPTH levels, we did not observe any differences between groups, although with the KDIGO criteria the patients with final iPTH levels > 600pg/ml initially showed somewhat higher serum iPTH levels, although the difference was not significant (Table 4). Nor did we find differences in initial levels of calcium, albumin, PCRhs, ferritin or haemoglobin/haematocrit. Among patients with final iPTH > 600pg/ml, phosphorus levels were somewhat higher and the Kt/V and the protein intake (nPNA) levels were somewhat lower in the groups with more controlled final iPTH, although this difference was not significant.
As for treatment, the initial doses of oral elemental calcium (in calcium carbonate form) and paricalcitol did not differ according to the final iPTH reached. However, we did observe that the initial dose of sevelamer was higher in the group with poorer final control using K/DOQI criteria (iPTH ≤ 300pg/ml 1.84 ± 3.32g/day versus an iPTH > 300pg/ml 3.61 ± 3.87g/day; p = 0.05) and also when considering various levels of final control (iPTH ≤ 300pg/ml 1.84 ± 3.32; iPTH > 300pg/ml and ≤ 600pg/ml 3.14 ± 3.59; iPTH > 600pg/ml 4.60 ± 4.38g/day; p = 0.05).
After treatment with cinacalcet, the phosphorus levels tended to be lower among those that achieved better final control of PTH, with no differences in the final readings of calcium or the other biochemical parameters, or Kt/V or nPNA. At the end of follow-up, those that did not achieve the PTH objectives of K/DOQI received a larger final dose of cinacalcet (iPTH ≤ 300pg/ml 33.8 ± 22.5mg/day; iPTH > 300pg/ml 51.1 ± 25.1mg/day; p = 0.003), with no significant differences observed in the final dose of oral calcium, sevelamer (iPTH ≤300pg/ml 1.43 ± 3.27g/day; iPTH > 300pg/ml 2.72 ± 3.65g/ day; p = NS), or paricalcitol (iPTH ≤ 300pg/ml 1.5 ± 3.1mcg/week; iPTH > 300pg/ml 3.6 ± 6.1µg/ week; p = 0.08). When considering three different levels of final control of iPTH (Table 4), the results were similar.
When comparing the evolution in the group with final iPTH ≤ 300pg/ml, we observed a decrease in the calcium (baseline 9.7 ± 0.7; final 9.0 ± 0.9; p < 0.001) and phosphorus levels (baseline 5.3 ± 1.5; final 4.4 ± 1.3; p < 0.002). The oral calcium dose was increased (baseline 0.55 ± 1.47; final 1.24 ± 2.06g/day; p = 0.017), without changing the sevelamer or paricalcitol doses. The degree of protein intake (nPNA) decreased at the end of follow-up (baseline 1.18 ± 0.26g/day; final 1.02 ± 0.27g/day; p < 0.001). In the group with final iPTH > 300pg/ml, only calcium levels decreased significantly (baseline 9.8 ± 0.8; final 9.2 ± 0.7; p < 0.003) without changes in iPTH (baseline 695 ± 362; final 630 ± 377; p = NS), phosphorus or other treatments (Table 3). In considering three final groups of PTH control, we also observed a reduction in calcium and nPNA levels in those with iPTH in 300-600pg/ml, without finding any change in those with final iPTH > 600pg/ml (Table 4).
When considering the intermediate points of the follow-up, we observed that calcium and phosphorus levels at 3, 6 and 9 months were similar between the groups with iPTH ≤ 300pg/ml and > 300pg/ml, while serum PTH levels were lower in the iPTH final ≤ 300pg/ml group starting in the third month, with iPTH levels decreasing by 32% at 3 months and 72% at the end of follow-up, without significant changes in the other group.
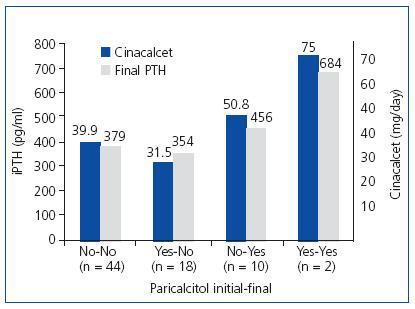
When analysing the influence of paricalcitol on the responsiveness of PTH to cinacalcet, we could not find a clear influence. Some 59.5% (44/74) of the patients were managed without need of paricalcitol. Some 24.3% (18/74) started treatment with paricalcitol, which was withdrawn during follow-up. Some 13.5% (10/74) required the addition of paricalcitol during the treatment and 2.7% (2/74) maintained the same treatment with paricalcitol that they had at baseline. Figure 1 shows the final serum iPTH levels and the final doses of cinacalcet administered in each group. In addition, we can see how the patients to whom paricalcitol was added or maintained their administration during treatment with cinacalcet were those with higher readings of iPTH and those that received a larger final dose of cinacalcet. As a result, it seems that paricalcitol was added primarily to support treatment with cinacalcet when PTH does decrease as desired.
We performed a multivariate analysis using multiple linear regression to find which baseline parameters could predict the degree of response to cinacalcet. We set the predictor variables for the final iPTH readings as iPTH, calcium, phosphorus, urea and creatinine, and taking oral calcium (calcium carbonate), sevelamer or paricalcitol at baseline. Only the taking of sevelamer was a predictor of final iPTH levels (R = 0.29; p = 0.018). When we looked for predictors of the degree of change in iPTH (baseline-final), we found that the predictor variables were sevelamer and baseline iPTH (r = 0.59; p < 0.001).
Phosphorus binders
The calcium carbonate dose increased overall during the treatment with cinacalcet from 0.61 ± 1.53 to 0.95 ± 1.97g of elemental calcium/day (p = 0.03). Prior to cinacalcet, 23% were taking calcium carbonate and 13.5% were prescribed more than 1.5g of elemental calcium, while at the end of the follow-up these percentages increased to 33.8 and 20.3% respectively (not significant). Among those who did not take it to begin with, 19.3% required it by the end, with the average final dose of this group at 0.43 ± 1.08g/day of elemental calcium. Among those that took it at the start, the average dose of elemental calcium was not significantly changed throughout the period (baseline 2.65 ± 2.22 versus a final 2.71 ± 3.10g/day), noting that it was terminated for 17.6% at the end of follow-up. The dose of oral calcium was significantly increased in patients who by the end achieved an iPTH < 300pg/ml, without finding, on the other hand, changes in the groups with poorer final control of PTH (Tables 3 and 4).
As for sevelamer, overall we found no changes in the dosage used (baseline 2.72 ± 6.69 versus final 2.08 ± 3.50). However, when only considering those who took sevelamer from the start, we observed a significant reduction in the dose from 6.30 ± 2.97 to 4.03 ± 3.77g/day (p = 0.002). At the start of treatment with cinacalcet, 43.2% took sevelamer and by the end of follow-up this number was 35.1% (not significant). When considering the final iPTH levels reached, we found that the dose of sevelamer decreased significantly among those who had final iPTH < 300pg/ml (baseline 6.18 ± 3.20g/day; final 3.78 ± 4.83g/day; n = 11; p = 0.038) and between 301-600 pg/ml (baseline 6.03 ± 2.63g/day; final 4.31 ± 3.18g/day; n = 13; p = 0.032), but not for those who had final PTH > 600pg/ml (baseline 6.90 ± 3.47g/day; final 3.90 ± 3.51g/day; n = 8).
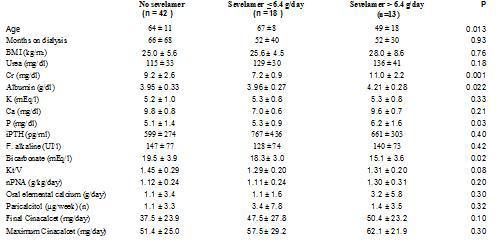
In order to clarify why taking sevelamer was shown to predict poor response to cinacalcet, we analysed the characteristics of these patients, dividing the population into two groups: takers and non-takers of sevelamer. Furthermore, the latter group was divided into two groups according to the median prescribed sevelamer dose: dose ≤ 6.4g/day or > 6.4g/day. The characteristics of the 3 groups prior to initiating treatment with cinacalcet is shown in Table 5. There were no differences in the levels of iPTH or calcium, but the patients with higher doses of sevelamer did present higher serum levels of phosphorus, creatinine and albumin, lower levels of bicarbonate and higher estimated protein intake (nPNA). Additionally, they were significantly younger and required higher doses of cinacalcet (not significant).
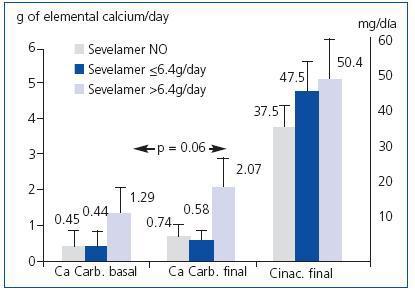
Among those that did not initially take sevelamer, 61.9% reached iPTH < 300pg/ml at the end of follow-up while only 34.4% did so when treated with sevelamer (p = 0.019). However, there were no differences between those that initially took calcium carbonate and those that did not. The patients that initially took sevelamer showed, at the end of follow-up, higher serum levels of iPTH (no sevelamer: 312 ± 245pg/ml; sevelamer ≤ 6.4g/day: 510 ± 490pg/ml; sevelamer > 6.4g/day: 526 ± 393pg/ml; p = 0.04) and phosphorus (no sevelamer: 4.5 ± 1.2mg/dl; sevelamer ≤ 6.4g/day: 4.2 ± 1.5mg/dl; sevelamer > 6.4g/day: 5.7 ± 0.9mg/dl; p = 0.01), with no differences in serum levels of calcium. The prescribed calcium carbonate dose increased after treatment with cinacalcet in the 3 groups, although not significantly (no sevelamer: baseline 0.45 ± 1.36 versus final 0.74 ± 1.78g de calcium/day; sevelamer ≤ 6.4g/day: baseline 0.44 ± 1.04 versus final 0.58 ± 0.73g elemental calcium/day; sevelamer > 6.4g/day: baseline 1.29 ± 2.30 versus final 2.07 ± 3.1g elemental calcium/day; non-significant Wilcoxon test for paired comparisons within each group). The group with higher initial sevelamer had higher prescribed doses of elemental calcium at the end, although the difference was not significant (Figure 2).
DISCUSSION
Achieving the objectives set by the guidelines for treatment of SHPT in haemodialysis has been facilitated by the inclusion of cinacalcet in the therapeutic arsenal since it significantly reduces serum levels of PTH and often also those of phosphorus and the calcium-phosphorus product.2,7 In our series we managed to reduce the prevalence of iPTH > 300pg/ml to 50% and the number of patients with Ca x P product > 55mg2/dl2 to 15.1%. The development of hypocalcaemia was significant, increasing from 2.7 to 12.3%, although at no stage did it bring about symptoms in any patient. Its development was independent of the degree of baseline SHPT and the degree of final control and carried with it an increase in the prescription of calcium carbonate, increasing from 23 to 33.8% at the end of follow-up. Initially only 13.5% of the patients were prescribed more than 1.5g of elemental calcium, while by the end this increased to 20.3%, due more to the attempt to maintain the serum calcium readings than for the need to bind the phosphorus.
Some authors have also found an increase in the patients’ need for calcium salts from 48 to 74%,,3 while others have not found this.7 The development of hypocalcaemia after treatment with cinacalcet is believed to be secondary to the inhibition of bone resorption and to an increase in bone mineralisation, presented with transient increases in serum bone alkaline phosphatase, with a behaviour that suggests the “hungry bone” syndrome that appears after parathyroidectomy8-10. When serial bone biopsies are performed, a reduction in the degree of bone fibrosis is observed along with a better mineralisation and a reduction in bone turnover, with histological changes that are related in intensity to the changes in serum bone markers.10
The effectiveness of using vitamin D analogues or selective activators of the vitamin D receptor associated with cinacalcet in the treatment of HPTS is controversial. In principle the reduction in the levels of calcium and phosphorus caused by cinacalcet allows us to add these drugs to treatment, allowing inhibition of the synthesis/release of PTH by various mechanisms.2,7,11 However, it could also worsen the control of phosphorus and lead to lower PTH reductions than would be expected if theses derivatives of vitamin D were not used.11 In our study, we cannot draw conclusions about the usefulness of the association of paricalcitol to cinacalcet due the design of the study and the small number of patients treated with paricalcitol. Our data show that paricalcitol was withdrawn in those patients who had it and responded well to cinacalcet. Paricalcitol was added to patients with poor response to cinacalcet, similar to what has been reported by others.2,7 In this respect, at the end of the treatment, the patients treated with paricalcitol were those who showed a greater “resistance” to cinacalcet.
The degree of reduction in the PTH readings at 3 months of treatment appeared to have prognostic value; these patients, at the end of follow-up, showed greater reductions in PTH readings and a need for lower doses of cinacalcet (78% of patients with doses lower than or equal to 30mg/day). In those patients that did not show such declines at 3 months of treatment, the final doses of cinacalcet used were higher (50% of patients with doses greater than or equal to 60mg/day), and the degree of final control of PTH achieved was clearly worse.
In our analysis we found that the observed decline in serum PTH levels is related to the initial readings, as has been reported by other authors.2 But we also noted that the response was poorer in those that were prescribed sevelamer at the beginning of treatment with cinacalcet. As reflected in Table 5, the patients that took sevelamer were younger, had a higher body mass index, had higher initial serum levels of phosphorus, creatinine and albumin, and a higher protein intake (estimated as nPNA). All of these parameters could translate into a better nutritional state and a higher dietary intake of phosphorus, which is a recognised factor in hindering the control of SHPT. At the end of follow-up, the phosphorus levels declined in the three groups (data not shown), but remained higher in the group that at the end maintained higher PTH levels, also with higher doses of sevelamer and despite the observed increased in the calcium carbonate dose.
Some studies have found that similar control of phosphorus can be achieved with binders containing calcium as with sevelamer, but the PTH readings often remain higher with sevelamer than with calcium-containing binders, ascribing this finding to the fact that calcium remains higher than with sevelamer,12,13 although there are also studies that find similar readings with both binders.14 In our case we did not observe major differences in the calcium levels reached in any group, which leads us to generally attribute the poorest control of PTH in patients that take sevelamer to the improper taking of phosphorus binder medication and the excessive intake of phosphorus.
In the multivariate analysis, only the taking of sevelamer combined with the initial PTH levels was predictive of the degree of response, with the starting levels of phosphorus and calcium and the dose of binders with calcium showing no influence. As a result, when starting cinacalcet treatment in those patients that are prescribed more sevelamer, it would recommendable to employ a longer monitoring of their calcium, phosphorus and iPTH levels, and to be aware that higher doses of cinacalcet may be needed to achieved the same iPTH readings. Indeed, some authors, when reviewing the doses used in relation to the severity of SHPT, find that the doses used in severe uncontrolled SHPT cases were not very different from those of better “responding” patients, thus recommending that one needs to be more aware that they will require higher doses and to pursue this objective in a more persistant manner in those cases with lesser response.10
The goal of treatment with cinacalcet has focused through the guidelines on reducing PTH readings to levels that determine a lower risk of morbidity and mortality, along with the reduction in serum phosphorus and calcium-phosphorus product. But from a practical standpoint, one might ask, “Should the target PTH reading be pursued even if it provokes a supplementary intake of calcium in order to alleviate the hypocalcaemia that is induced?” It is possible that in patients with more severe SHPT or with greater phosphorus intakes, a greater increase is observed in the calcium doses provided to combate hypocalcaemia, as our data suggests. The larger amounts of calcium provided to patients with hypocalcaemia is postulated to be deposited in the bone, helping to reduce unmineralised osteoid matrix.8 However, it is necessary to show that these calcium supplements do not contribute to increased vascular calcification in patients with more severe HPT. In experimental models, cinacalcet does not seem to produce vascular calcification, as does calcitriol.15,16 Also some authors have found that coronary calcification.17 and peripheral vascular calcification18 are reduced after treatment with cinacalcet. However, a separate problem may involve the induction of severe or excessively rapid hypocalcaemias in the effort to correct PTH by cinacalcet, although it is not known whether this may or may not increase the risk of greater morbidity and mortality with the haemodialysis group.19,20
In summary, in our series we have shown that cinacalcet is a cornerstone in the treatment of SHPT, helping to meet the objectives for control of phosphorus and the calcium-phosphorus product. However, what is more difficult is the control of PTH readings that fail to reach the levels recommended by the guidelines, especially in those with more severe SHPT and with greater use of binders such as sevelamer. In those patients, the monitoring must be longer, with the goal of significantly increasing the cinacalcet doses used, clearly pursuing an objective centred on PTH, but without losing sight of the high quantities of calcium salts that may be necessary and the potential impact that this may have on vascular calcification.
Table 1. Degree of control achieved according to the K/DOQI and KDIGO guidelines in the various parameters of bone mineral metabolism
Table 2. Degree of control achieved according to the KDIGO guidelines and initial PTH levels
Table 3. Comparison of bone-mineral metabolism variables, adequacy of dialysis and treatments received according to final PTH achieved (Student t, paired and non-paired)
Table 4. Comparison of bone-mineral metabolism variables, adequacy of dialysis and treatments received according to final PTH achieved (ANOVA through Kruskall-Wallis for comparison between groups and Wilcoxon test for paired intragroup comparisons).
Table 5. Comparison of various baseline parameters in patients depending on whether they were prescribed sevelamer as phosphorus binder at baseline (ANOVA through Kruskall-Wallis test)
Figure 1. Influence of paricalcitol on the degree of response of PTH to cinacalcet
Figure 2. Final doses of calcium carbonate and cinacalcet according to the baseline dose of sevelamer


