Introdución: Los niveles bajos de 25 hidroxivitamina D han sido relacionados con un aumento de la morbimortalidad de origen cardiovascular en la población general y en pacientes con enfermedad renal crónica. Objetivo: Nuestro objetivo fue estudiar los niveles de 25 hidroxivitamina D en un grupo de pacientes con enfermedad renal crónica estadios 4 y 5 prediálisis, y relacionarlos con los antecedentes de enfermedad cardiovascular y con factores conocidos de riesgo cardiovascular. Material y métodos: Se trata de un estudio observacional transversal de una cohorte de 171 pacientes seguidos en la consulta prediálisis de nuestro hospital, media de edad 64,16 ± 13 años, el 59,6% hombres, el 64,3% diabéticos, el 47,3% obesos y el 46,8% con antecedentes de enfermedad cardiovascular. A todos los pacientes se les midieron los niveles séricos de 25 hidroxivitamina D y de 1-25 dihidroxivitamina D, se recogieron datos clínicos y analíticos de función renal, anemia, perfil lipídico y metabolismo óseo-mineral; también se evaluó la presión arterial mediante registro ambulatorio de 24 horas (MAPA) y se realizó estudio ecocardiográfico. Resultados: La media de los niveles de 25 hidroxivitamina D fue de 22,1 ± 13 ng/ml, sólo un 18,7% de los pacientes presentaban niveles normales, un 58,5% presentaban niveles insuficientes o bajos y un 22,8% niveles deficientes o muy bajos. Las variables que se asociaron con los niveles bajos de vitamina D fueron la edad, la diabetes, el sexo femenino, la obesidad, el filtrado glomerular y el antecedente de enfermedad cardiovascular. Dentro de los parámetros asociados a la presión arterial, la presión del pulso fur la que más se relacionó con los niveles de vitamina D. No se encontró asociación entre los niveles de 25 hidroxivitamina D con otros parámetros del metabolismo óseo mineral ni con los valores ecográficos de hipertrofia ventricular izquierda. En el análisis multivariante las variables que más se asociaron al déficit de 25 hidroxivitamina D fueron el sexo femenino, el antecedente de enfermedad cardiovascular, el filtrado glomerular y la presión del pulso del MAPA. Conclusiones: Nuestro estudio confirma una alta prevalencia de insuficiencia y deficiencia de 25 hidroxivitamina D en la población con enfermedad renal crónica avanzada; este déficit se asocia con la presencia de factores de riesgo cardiovascular y con el antecedente de enfermedad cardiovascular. Sin embargo, no se encontró ninguna asociación con uno de los principales predictores de eventos cardiovasculares como es la hipertrofia ventricular izquierda.
Background: Decreased 25 hydroxyvitamin D serum levels have been related to an increase in cardiovascular morbility and mortality in both general population and chronic kidney disease patients. The aim of this study was to evaluate the relationship between 25 hydroxyvitamin D serum level, cardiovascular risk factors and previous established cardiovascular disease in a group of patients with advanced chronic kidney disease. Objective: Our aim was to study 25 hydroxyvitamin D levels in a group of patients with stage 4 and 5 chronic kidney disease on predialysis, and link them to history of cardiovascular disease and its known risk factors. Material and methods: We performed a cross-sectional observational study in a cohort of 171 stage 4 and 5 chronic kidney disease outpatients seen in our predialysis clinic, mean age 64.16 ± 13 years, 59.6% were men, 64.3% had diabetes, 47.3% had obesity, 46.8% had previous cardiovascular disease. 25 hydroxyvitamin D and 1-25 dihydroxyvitamin D were measured, we also determined other routine biochemical parameters. All subjects underwent an echocardiogram and 24 hours ambulatory blood pressure monitoring was also performed. Results: Mean 25 hydroxyvitamin D levels were 22.1 ± 13 ng/mL, only 18.7% of the patients had adequate levels, levels were insufficient in 58.5% of the patients and deficient in 22.8% of them. Low 25 hydroxyvitamin D levels were significantly related with age, diabetes, female gender, obesity, MDRD glomerular filtration rate and previous cardiovascular disease. Pulse pressure was the Ambulatory Blood Pressure Monitoring parameter that was better correlated with 25 hydroxyvitamin D levels. We could not find any association between vitamin D levels and other bone and mineral metabolism parameters. No relationship was seen between low vitamin D levels and left ventricular hypertrophy. On multivariate analysis lower levels of 25 hydroxyvitamin D were independently associated with female gender, previous cardiovascular disease, MDRD4-GFR and higher pulse pressure. Conclusions: Our study confirm a high prevalence of 25 hydroxyvitamin D insufficiency and deficiency in advanced chronic kidney disease patients, this was associated with the presence of cardiovascular risk markers and previous established cardiovascular disease. However we could not see any relationship with left ventricular hypertrophy which is a known predictor of future cardiovascular events in this population.
INTRODUCTION
Growing interest has arisen in recent years in the role of Vitamin D in processes beyond its affect on mineral-bone metabolism. There are many vitamin D receptors in the human body, not just in the intestine, kidney, and bones, but also in the brain, heart, skeletal muscle, smooth vascular muscle, the pancreas, lymphocytes, and monocytes, whose activation could explain some of its effects on the autoimmune system, cancer, and cardiovascular system.1,2
Low levels of 25 hydroxyvitamin D (25[(OH]D) have been correlated with the presence of arterial hypertension, left ventricular hypertrophy, and cardiovascular mortality in the general population.3-7
Cardiovascular disease is the main cause of morbidity in patients with chronic kidney disease.8 Various abnormalities in mineral-bone metabolism are frequent in these patients, such as elevated calcium-phosphorous products, hyperparathyroidism, and vitamin D deficiency, which have all been related to cardiovascular events.9,10 Several studies have demonstrated that patients with chronic kidney disease on dialysis or predialysis report a high prevalence of 25(OH)D deficit. Recent studies have suggested an inverse relationship between 25(OH)D levels and global or cardiovascular mortality in patients with chronic kidney disease.11,12
In the present study, we attempt to evaluate the relationship between vitamin D levels, arterial hypertension as measured by 24-hour ambulatory blood pressure monitoring (ABPM), echocardiographic parameters for left ventricular hypertrophy, and cardiovascular disease in a cohort of patients with stage 4 and stage 5 chronic kidney disease followed during the predialysis visit.
MATERIALS AND METHODS
This was a transverse observational study on a cohort of patients with stage 4 and 5 chronic kidney disease not on dialysis, who were followed in advanced chronic kidney disease (ACDK) units at our hospital during 2008 and 2009.
Patients
We studied 171 patients, 59.6% of which were men, with a mean age of 64.16 ± 13 years (range: 21-91); 64.3% were diabetic; mean glomerular filtration (GF) by MDRD4 was 20.5 ± 6 mL/min/1.73 m2 (range: 10-30), 76% were in stage 4 and 24% in stage 5, with a mean body mass index (BMI) of 30 ± 6 kg/cm2 (range: 18-49) (47.3% with BMI >30 kg/cm2). 26% had a background of ischemic cardiopathy, 13.5% had a background of cerebrovascular accidents, and 24% had a background of ischemia in the lower limbs.
Laboratory analysis
Serum levels of 25(OH)D2 + D3 were measured in all patients using chemiluminescence immunoassays (LIASON® 25 OH Vitamin D TOTAL Assay. DiaSorin Inc.), and levels of 1-25 dihydroxyvitamin D3 were measured by radioimmunoassays (RIA INCSTAR Corporation). We considered deficient or very low vitamin D levels to be below 15 ng/mL of 25(OH)D, insufficient or low levels to be between 15 and 30 ng/mL, and adequate or normal levels were those above 30 ng/mL, in accordance with the criteria published by K-DOQI guides.13
Our system employed the following biochemical analyses: haemogram, kidney function as estimated by the MDRD4 formula, albumin, ions, lipid profile, calcium, phosphorous, alkaline phosphatase, iPTH, 24 hour proteinuria, PCR, and homocysteine.
Blood pressure record
A 24-hour ABPM analysis was made on each patient using a Spacelabs monitor, model 90217-5, with data registration every 20 minutes during the day (from 0800 to 2100 hours) and every hour during the night (from 2200 to 0700 hours), recording mean systolic blood pressure (SBP), mean diastolic blood pressure (DBP), mean blood pressure, pulse pressure (PP), percentage of above-normal observations in each period, and nocturnal depression patterns.
Echocardiographic parameters
Each patient received M-mode and Doppler echocardiograms in order to evaluate the left ventricular mass index according to the Deveroux formula14 (considering left ventricular hypertrophy defined as greater than 110 g/m2 in women and 130 g/m2 in men); we also measured the relative thickness of the posterior wall, the geometry of the left ventricle, the ejection fraction, using the Teichhols method,15 and diastolic function by measuring the relationship between peak velocity of early and late (E/A) transmitral flow, considering it to be a case of diastolic dysfunction if E/A <1 or E/A >1.5 with DT <130 ms.
Statistical analysis
The statistical analysis was performed using SPSS 17.0. Data were expressed as percentages for categorical variables and as means with standard deviations for quantitative variables. We used the Student’s T-test, Mann-Whitney U test, and Chi-squared test for data analysis, in accordance with the nature of the variable measured. We performed a univariance analysis using the Spearman correlation coefficient for measuring the correlation between quantitative variables. We also performed a multivariance analysis using binary logistic regression, using normal (>30 ng/ml) or low/very low (<30 ng/ml) vitamin D levels as the dependent variable, and introducing the main significant variables from the univariance analysis, age, sex, diabetic condition, background of cardiovascular disease, BMI, GF from MDRD-4, SBP in ABPM, and PP in ABPM.
RESULTS
Mean 25(OH)D levels were 22.1 ± 13 ng/mL (range: 5-65), mean 1-25 dihydroxyvitamin D levels were 26.2 ± 12 pg/mL (range: 5-91), and we observed a tendency towards correlation between the two variables, although this was not statistically significant (r = 0.133; p = 0.08). 39 patients (22.8%) reported deficiency or very low levels (<15 ng/mL), 100 patients (58.5%) had insufficiency or low levels (15-30 ng/mL), and 32 patients (18.7%) had normal levels (>30 ng/mL) of 25(OH)D. None of the patients had received native vitamin D supplements (ergocalciferol, colecalciferol, or calcifediol); 25% of patients were on treatment with active metabolites or vitamin D analogues (17% on calcitriol and 8% on paricalcitol); we observed no significant differences in 25(OH)D or 1-25 dihydroxyvitamin D levels between patients on active vitamin D medication and those who were not (20.7 ± 9 vs. 22 ± 11; p = 0.435 for 25[OH]D and 24.2 ± 10 vs. 27.4 ± 12; p = 0.133 for 1-25 dihydroxyvitamin D). 26% of patients with low or very low 25(OH)D levels and 24% with normal levels were treated with active vitamin D medication (not significant, p = 0.757.)
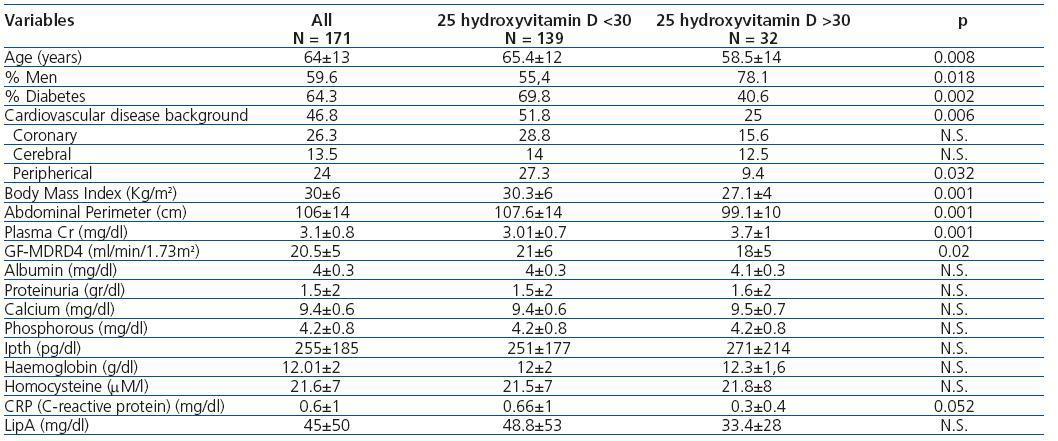
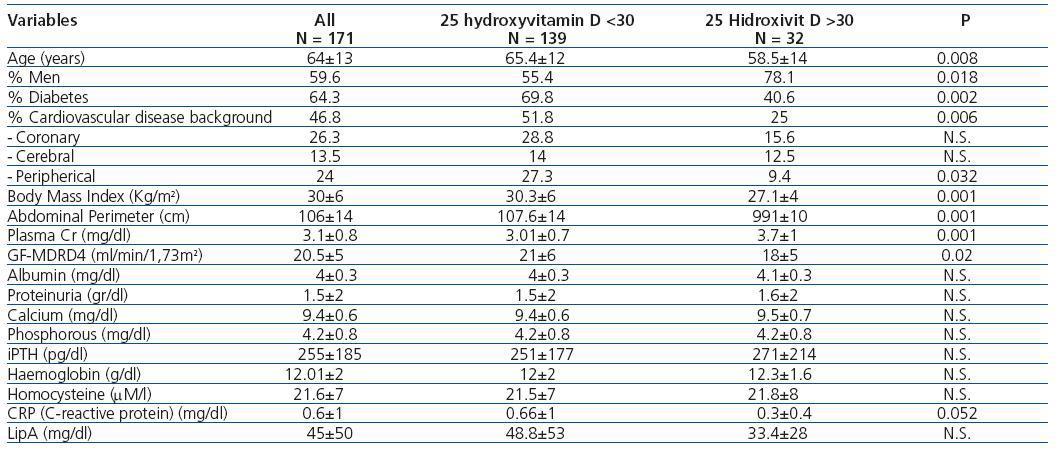
Table 1 compares the demographic, clinical, and analytical variables between patients with 25(OH)D deficiency or insufficiency and patients with normal values. It stands out that patients with inadequate values were generally older, had a higher percentage of women and diabetes, more cardiovascular disease background, greater obesity, and better GF. Table 2 summarizes the differences in demographic, clinical, and analytical variables between patients with 1-25 dihydroxyvitamin D levels above and below 25 pg/mL; we arbitrarily chose a cut-off point at 25 pg/ml to divide our population at approximately 50% of lower and higher levels. As the table demonstrates, there were significant differences between the two groups only in the values of GF, albumin, proteinuria, and lipoprotein A levels.
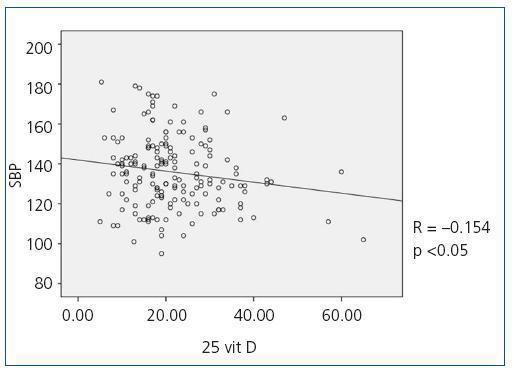
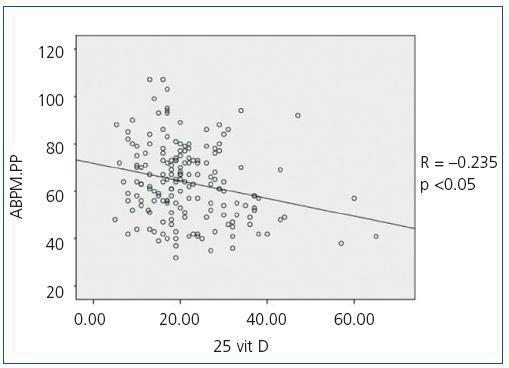
When we compared 25(OH)D levels with blood pressure values obtained using the ABPM, we observed a statistically significant inverse relationship between 25(OH)D levels and mean SBP during all time periods (24-hour SBP r = —0.154; p <0,05, diurnal SBP r = —0.150; p <0.05, nocturnal SBP r = —0.155; p <0.05), that is, as SBP increases, 25(OH)D levels decrease. Figure 1 shows the correlation between 25(OH)D and 24-hour SBP. We observed no statistically significant correlation between mean DBP and 25(OH)D levels in any time period. We did observe a statistically significant inverse correlation between PP in all periods and 25(OH)D levels, such that as PP increases, 25(OH)D levels decrease, as observed in figure 2 for the 24-hour period (24-hour PP r = —0.235; p <0.005, diurnal PP r = —0.231; p <0.005, nocturnal PP r = —0.204; p <0.01). No differences were observed in 25(OH)D levels in relation to nocturnal BP depression. We also observed no significant correlations between 1-25 dihydroxyvitamin D levels and any of the blood pressure parameters measured with the ABPM.
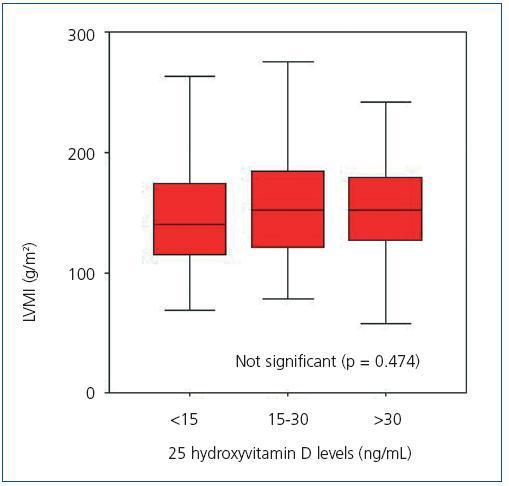
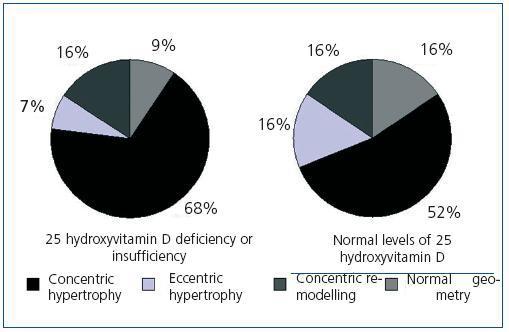
Upon analyzing the echocardiogram results, we found no relation between 25(OH)D levels and left ventricular mass index (Figure 3): 150 g/m2 (95% CI, 133-166) for patients with very low levels, 160 g/m2 (95% CI, 150-171) for patients with low levels, and 152 g/m2 (95% CI, 135-169) for patients with normal levels (p = 0.474). 74.5% of patients with low or very low 25(OH)D levels and 68.8% of patients with adequate vitamin D levels had criteria for left ventricular hypertrophy (not significant, p = 0.482). However, figure 4 shows that patients with 25 vitamin D deficiency or insufficiency show a greater tendency for concentric hypertrophy than patients with normal levels, while these show a higher percentage of normal geometry or eccentric hypertrophy. We observed no significant differences in systolic or diastolic function according to vitamin D levels.
The multivariance analysis showed that 25(OH)D levels were related to gender, PP in the ABPM study, a background of cardiovascular disease, and GF from MDRD-4 (Table 3).
DISCUSSION
As other studies on various stages of chronic kidney disease have demonstrated,16,17 we found a high prevalence of 25(OH)D deficiency and insufficiency in patients with advanced renal failure. This deficiency appears to be greater than in the general population,18 and can be explained by several different reasons. Patients with advanced chronic kidney disease can suffer a deficiency in nutrient assimilation from a reduction in the consumption of foods rich in vitamin D and in intestinal absorption; also, these patients tend to have comorbidities that cause a deterioration in physical health, restricting outdoors activities, and exposing them to less solar radiation. It has also been suggested that uraemia itself could produce a deficiency in endogenous cutaneous vitamin D synthesis.17 Our group of patients had a markedly high prevalence of low or very low 25(OH)D levels, given that these were patients from the southern tip of Gran Canaria, an island that presents one of the highest levels of mean solar radiation throughout the year in all of Europe.
In our group of patients, we found a relationship between 25(OH)D deficiency and advanced age and diabetes, findings that have been described in other studies with patients both with and without kidney failure,19-21 and which can be explained in part by the lower exposure to solar radiation due to decreased activity of elderly patients, lower consumption of vitamin D-rich foods in both groups, and autonomic diabetic enteropathy, involving a deficiency in absorbtion.22 We also observed a relationship between BMI and abdominal perimeter, which has been described in several studies relating vitamin D levels with obesity in the general population.23-25 We have also found a greater prevalence of low levels in female patients; this has been observed in other studies and still lacks a coherent explanation, although hormonal differences between the two genders has been implicated in the cause of this difference.3
We have observed that patients with normal 25(OH)D levels have higher serum creatinine levels and lower MDRD (3.7 mg/dL vs. 3 mg/dL; p <0.05 and 18 mL/min/1.73 m2 vs. 21 mL/min/1.73 m2; p <0.05); in fact, the percentage of patients with normal 25(OH)D levels is greater in the group of stage 5 CKD patients than stage 4 CKD patients (35 vs. 13%; p <0.005), not so for 1-25 dihydroxyvitamin D levels, which decrease with GF. We found no explanation for this trend, which appears to contradict published results from the medical literature that indicate that 25(OH)D levels decrease with GF.16
We found no relationship between 25(OH)D levels and other parameters of mineral-bone metabolism such as levels of iPTH, calcium, phosphorous, calcium x phosphorous product, or alkaline phosphatase. In some studies, particularly in patients on dialysis, a negative correlation has been observed with iPTH levels.26 We found no relationship with active vitamin D levels or vitamin D analogues, although most of our patients were on low dosages (1 µg per week of calcitriol or 3 µg per weeks of paricalcitol) and had not been on the treatment for very long.
In the general population, vitamin D deficiencies have been related to the development of arterial hypertension.27,28 In our study, we found a correlation between 25(OH)D levels and the blood pressure parameters measured by ABPM. We observed a weak inverse correlation of these levels with mean SBP and PP in all periods of the day. We did not observe any relation with mean DBP or nocturnal depression patterns. These data are consistent with results from other studies that relate vitamin D deficiency in chronic kidney disease with vascular calcifications and increased rigidity of the arterial wall, which above all is reflected in the increase in PP.29,30 Vascular calcifications and the reduction in arterial elasticity with a consequent increase in PP have all been related to increased cardiovascular mortality from chronic kidney failure31,32.
Several studies have related vitamin D deficiency with cardiovascular disease, both in the general population and in patients with chronic kidney disease;33-35 in our study, we observed an association between low or very low 25(OH)D levels and a background of cardiovascular disease (51% of patients presented with some background of cardiovascular disease as opposed to 25% of patients with normal 25(OH)D levels). However, it is difficult to infer causality of this relationship in a transverse study since the low levels could be a consequence of increased comorbility in this group, being associated with advanced age, the presence of diabetes, and obesity. Various mechanisms by which vitamin D deficiency could increase cardiovascular morbidity have been considered. On the one hand, we have already commented on the role that a vitamin D deficiency can play on the vascular wall, decreasing distensibility and favouring vascular calcification; on the other hand, due to its immunomodulating and anti-proliferative effects, a vitamin D deficiency could produce a pro-inflammatory state, which has been widely recognized as a cause of cardiovascular disease in chronic kidney disease.36-38 Finally, vitamin D has been implicated in the inhibition of the renin-angiotensin system, this being one of the mechanisms implicated in causing hypertension.39 Experimental studies on the absence of vitamin D have related it to hypertrophy of myocardiac muscle cells,40 which could favour left ventricular hypertrophy; it is well-known that left ventricular hypertrophy is one of the main predictive factors for cardiovascular mortality in chronic kidney disease.41 However, according to our knowledge on the subject, no study has been able to relate a deficiency in 25(OH)D with left ventricular hypertrophy in chronic kidney disease. We found no relationship between the two in our study, although this lack of association could be due to the limited number of patients in the program and the high prevalence of left ventricular hypertrophy in the group studied (73.7% of patients presented this condition). On the other hand, there does appear to be a tendency of a different geometry of the left ventricular hypertrophy, since the group with insufficient or deficient 25(OH)D levels reported a greater proportion of concentric hypertrophy than patients with normal levels, while these tended to have normal geometry or eccentric hypertrophy.
In our study, we found no difference in the level of proteinuria among patients with normal or low 25(OH)D levels. However, we did find greater proteinuria in patients with low levels of 1-25 dihydroxyvitamin D. It has been suggested that patients with nephrotic proteinuria should be excluded from studies that evaluate vitamin D levels because of the increase in 25(OH)D loss in the urine, and of the protein that binds to the vitamin D receptor.42 In our study, 18% of patients presented proteinuria in the nephrotic range (>3 g/24 h), and we decided not to exclude them from the study in spite of the fact that this could have created a limitation, but the exclusion would not have affected the results regarding 25(OH)D. There was no correlation between proteinuria and 25(OH)D levels and the percentage of patients with nephrotic proteinuria does not vary significantly between patients with low or very low levels and patients with normal levels of 25(OH)D (17 vs. 22 %) and the mean of 25(OH)D levels in patients with nephrotic proteinuria was similar to that of the rest of the patients (21.8 ± 9 vs. 22.6 ± 6; p = 0.518). Perhaps the difference lies in that in the study by Saha,42 50 patients with nephrotic syndrome and normal kidney function were studied, making this population different. However, our results are consistent with the findings from Koening43 on the inverse correlation of proteinuria with 1-25 dihydroxyvitamin D levels (r = —0.428; p <0.005). The percentage of patients with nephrotic proteinuria is greater in patients with lower 1-25 dihydroxyvitamin D levels (25 vs. 13%; p <0.005).
We are aware of the fact that this study has several limitations, specially the fact that it is a transverse observational study, which allows for an observation of some associations, but does not allow us to draw conclusions on causality. Additionally, the fact that our study was comprised of a limited number of patients with a profile of a high prevalence of diabetes, cardiovascular disease, and left ventricular hypertrophy corresponding to the population with chronic advanced kidney disease in the Canary Islands, makes it difficult to establish stronger associations that might be ascertained in a larger study sample with a more favourable profile. Thus, it will be necessary to perform multicentre studies with a large number of cases and a longitudinal study design to better associate low 25(OH)D levels and cardiovascular disease in chronic kidney disease, and for the evaluation of possible therapeutic strategies in order to correct the vitamin D deficiency at early stages of chronic kidney disease, since there is currently no evidence on the benefits of the correction of this proportion on the population in general.
To conclude, we believe that a high prevalence of 25(OH)D deficiency and insufficiency exists in our population of patients with advanced chronic kidney disease, that this deficiency is greater in women and that it is associated with a greater proportion of backgroung of cardiovascular disease and higher cardiovascular risk, since it is associated with advanced age, diabetes, obesity, and arterial hypertension. However, we have observed no significant relationship between 25(OH)D levels and left ventricular hypertrophy in this study.
ACKNOWLEDGEMENTS
We would like to thank Dr. José María Limiñana Cañal, of the research division at the Island University Hospital of Grand Canary, for his great help in the statistical analysis.
Table 1. Demographic, clinical, and analytical variables by normal or low levels of 25 hydroxyvitamin D
Table 2. Demographic, clinical, and analytical variables by normal or low levels of 1-25 hydroxyvitamin D
Table 3. Multivariate analysis with logistic regression for normal/inadequate 25 hydroxyvitamin D levels
Figure 1. Bivariate correlation between mean systolic blood pressure in the 24-hou4 ABPM and 25 hydroxyvitamin D levels
Figure 2. Bivariate correlation between pulse pressure calculated by the 24-hour ABPM and 25 hydroxyvitamin D levels
Figure 3. Left ventricular mass index according to 25 hydroxyvitamin D levels
Figure 4. Geometry of the left ventricle according to levels of 25 hydroxyvitamin D above or below 30 ng/mL


