Introducción: el objetivo de nuestro trabajo es analizar nuestra experiencia en el manejo de varios indicadores de calidad en Hemodiálisis (HD) basados en las guías de buena práctica clínica. Material y método: hemos estudiado a todos los pacientes prevalentes de nuestro programa de HD desde junio de 2005 a febrero de 2008. Los indicadores evaluados abarcaban diferentes áreas: anemia, metabolismo óseo-mineral, adecuación, riesgo cardiovascular, accesos vasculares y morbimortalidad. Las mediciones se han realizado con diferente periodicidad en función de la definición de cada uno de ellos. Resultados: recogemos los de aquellos indicadores en los que hemos encontrado una controversia entre nuestros resultados y los objetivos pretendidos. Es posible alcanzar una hemoglobina ≥11 g/dl en más del 85% de pacientes, pero con más del 20% con hemoglobina >13 g/dl. Logramos alcanzar el estándar con el fósforo (>85%), pero no con el calcio (72,7%) ni con la Hormona Paratiroidea (PTH) (38,8%), aunque con mejoría en los valores medios. La incorporación de nuevos pacientes al programa de HD, algunos no conocidos, nos impide alcanzar el estándar (≥85%) con Kt/V ≥1,3 de forma constante. Sólo un 62,2% de pacientes alcanzó cifras de Tensión Arterial Sistólica (TAS) ≤140 mmHg. El porcentaje de pacientes dializados a través de catéter (objetivo <10%) sólo lo cumplimos en 5 de 11 mediciones. La tasa de hospitalización se situó entre 0,49 y 0,71 episodios/paciente/año. La supervivencia es superponible a los resultados del Registro de la Comunidad Valenciana. Conclusión: la medida de indicadores en nuestra Sección ha mejorado nuestros resultados al mismo tiempo que nos ha generado dudas, en alguno de ellos, sobre su definición y estándares establecidos. Pensamos que es necesaria su revisión, redefiniéndolos, para intentar evitar variabilidad, iatrogenia y aumento de costes. Habría que considerar la posibilidad de utilizar sólo indicadores en los que la evidencia científica esté claramente demostrada.
Introducction: The object of this work was to review our use of various indicators of haemodialysis within the guidelines of good clinical practice. Materials and Methods: The study includes all patients from our haemodialysis program from June 2005 to February 2008. The indicators we evaluated included various areas: anaemia, bone-mineral metabolism, dialysis dose, cardiovascular risk, vascular access and morbidity/ mortality. The measurement intervals varied according to the parameter being evaluated. Results: We gathered those indicators in which we found a difference between our results and the targets set. It is possible to reach a haemoglobin of ≥ 11g/dl in more than 85% of the patients, although more than 20% of them showed > 13g/dl. We were able to stay on target with phosphorous (> 85%) but not with calcium (72.7%) or PTH (38.8%) although average values were improved. The incorporation of new patients to the haemodialysis programme, some previously unknown, limited our possibilities of achieving ≥85% with a Kt/V ≥ 1.3. Only 62.2% of the patients had a systolic blood pressure of ≤ 140mmHg. The percentage of patients dialysed by catheter (objective < 10%) was only achieved in five out of the eleven measures. The hospitalisation rate was between 0.49 and 0.71 episodes/patient/year. The patient survival rates coincide with those of the Comunidad Valenciana Register. Conclusion: the use of clinical performance measures has improved our results, whilst in some cases it has raised doubts over their definition and established targets. In general we feel that they should be revised and redefined where necessary in an attempt to avoid variability, iatrogenia, and increased costs. The use of only those indicators in which a clear scientific basis is evident, should be considered.
INTRODUCTION
The introduction of Quality Systems is a phenomenon being developed in the healthcare area.1 The essential objective of a quality system is continuous improvement in the care provided to patients, therefore, the use of clinical and management indicators that measure the results obtained are vital.2
The use of clinical measures involves not only measuring the results, but also analysing them and, based on this, creating an improvement plan, which should eventually lead to a better patient care. Furthermore, clinical measures are usually defined as an interval of results and a standard, which can be a rate or a percentage of patients complying with the margin concerned. Both the definition and standards are generally based on clinical evidence gathered from clinical guides or series of published meta-analyses.3
Throughout 2005, at the Nephrology Department of the Virgen de los Lirios Hospital in Alcoy, ISO 9001:2000 Quality Certification was introduced. In June 2005, measurement of basic clinical measures in the Haemodialysis Unit commenced, and in March 2007, thanks to the experience gained, the number of indicators increased, modifying the definition and standards used in some of those existing.
The experience measuring and analysing HD indicators has led to an evident improvement in our Unit's clinical practices. However, a series of questions has arisen, which has also shown contradictions among the targets sought and the final result.
The purpose of our study is to provide information about our experience managing a group of clinical HD measures, as well as establishing some controversy between what we "want or intend" with our targets and the "real situation" in daily clinical practice. However, we are aware of the limitations of a study conducted in a single centre and that the conclusions obtained cannot necessarily be extrapolated to other units with different characteristics.
MATERIAL AND METHODS
We performed a prospective study on all the patients in HD between June 2005 and February 2008 at the Dialysis Unit of the Virgen de los Lirios Hospital in Alcoy, a district hospital serving a population of 135,551 inhabitants (data from the electoral roll in 2005), where dialysis treatment was provided to all the patients in the area, with the exception of HVB and HIV positive patients on HD, who were sent to a centre of reference.
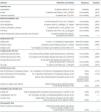
A series of clinical and analytical measures are gathered from all the patients, from the moment they are included in HD, regardless of their monthly test results and regular complementary tests, defined in the different quality system procedures in the Nephrology Department. These measures are grouped into several sections. In the HD section, we have divided the measures into different specific areas. Table 1 shows the measures chosen, their definition, method, the frequency with which they are measured and the standard set. Between June 2005 and December 2006, data was only gathered every three-months, together with the annual indicators of vascular access and morbidity/mortality, indicators of the haemoglobin results, pre-dialysis potassium, pre-dialysis phosphorus and Kt/V. The target ranges were based on the unanimously accepted clinical guidelines. EBPG4 and NFK-DOQI.5 In February 2007 we increased the number of measures in the areas of anaemia, mineral metabolism and dose adjustment, and added cardiovascular risk, measuring these areas every four months. The target ranges were based on the guidelines drawn up by the Spanish Nephrology Society (SEN),6 with occasional changes established by agreement with the nephrologists in the Unit. However, when the indicator measure was established, with the exception of vascular access, our criteria in all the measures were to try and achieve the targets in more than 85% of patients. In other words, less than one sixth of all patients would fall outside the range proposed.
The only analytical parameters used were those obtained in the month corresponding to the measurement. The fourmonthly analysis of the results allowed conclusions to be drawn, which were agreed among the Department nephrologists, as well as proposals for improvement in the form of changes in attitude with regard to the drug doses, the use of drug substances, the management of dialysis times, referral of patients to vascular surgery or interventional radiology, etc. The analytical results during the subsequent months, although they were not used for measuring the group, were individually evaluated by the nephrologist responsible for each patient, with a view to bringing them into line with the target before the next measurement.
We have limited ourselves in this work to reporting the results obtained in the measurements where controversy could be found, whether in the form of measurement or the standards set as targets. The results are reported as they were gathered in the measurements, generally in the form of percentages of the total patients. The analysis of survival only involved the patients included since January 2000 using Kaplan Meier curves.
RESULTS
Patients
Between June 2005 and February 2008, our Haemodialysis unit treated a total of 154 patients, 90 men (58.4%) and 64 women (41.6%), with an average age of 70.1 ± 15.3 years, 38 of whom were diabetic patients (24.7%.) In the different measurements, the number of patients analysed varied between 88 and 102 (number of patients in each analysis.) In the survival analysis a total of 177 patients who attended the unit since January 2000 were included (102 men and 75 women, with an average age of 67.1, 27.1% of whom were diabetics.)
Anaemia area
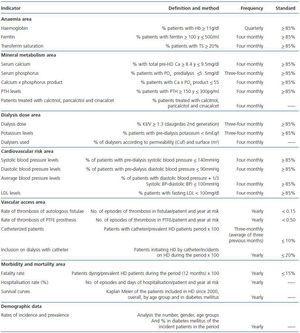
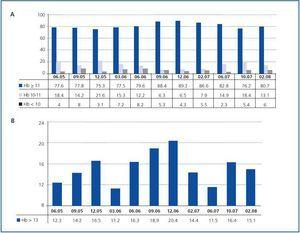
During the first measurement year, the percentage of patients with Haemoglobin (Hb) ≥ 11g/dl remained between 77.6 and 79.6%, achieving the standard (≥ 85%) 15 months after the start and remaining between 88.4 and 86.6% in the following three measurements. At the same time, there was an increase in the percentage of patients with Hb > 13g/dl, which rose from 16.3 to 20.4%. More than 20% of patients had > 13g/dl, coinciding with the larger percentage of patients achieving Hb ≥ 11g/dl. Later, there was a further correction of percentages to values similar to those prior to the aforementioned increase. The percentage of patients with Hb < 10g/dl did not reach 10% in any measurement (maximum 8.2%), and the largest variations were seen among the patients with Hb between 10 and 11 and > 13g/dl (figures 1a and 1b.) Between the months of February in 2007 and 2008, the average doses of erythropoietin and darbepoietin varied between 120.8 and 157.0U/kg/week and 0.47 and 0.63μg/kg/week, representing a variation of 30 and 34%, respectively. During the same period, the percentage of patients with ferritin > 100ng/ml was always above 90% (range 90.8-99.0%.)
Mineral metabolism area
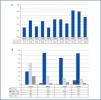
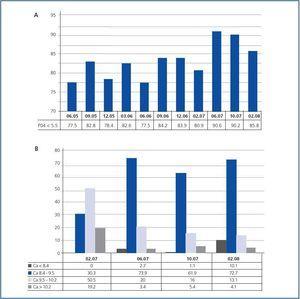
The percentage of patients with phosphorus values < 5.5mg/dl stayed below the standard during the first two years, varying between 77.5 and 84.2% (figure 2a.) Throughout 2007, the increasing use of cinacalcet, whose use rose from 11.1 to 27.3% of patients, contributed to surpass 85% of patients falling within the range set. Something similar occurred with serum calcium levels, which were introduced as a measure at the same time as PTH, in February 2007: starting with an earlier target range between 8.5 and 10mg/dl, we set the KDOQI objective of 8.4-9.5mg/dl. Basally, most of our patients were situated between 9.5 and 10.2mg/dl, with only 30.3% within the KDOQI range. Once again, the introduction of cinacalcet led to better calcium control, with percentages between 61.9 and 73.9% of patients within the standard and constantly falling percentages of patients surpassing it, at the expense of a larger number of patients with calcium < 8.4mg/dl (10.1%) (figure 2b.)
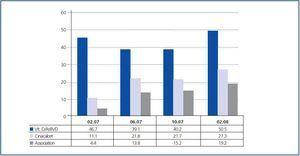
With regard to the PTH, the basic percentage of patients with PTH between 150 and 300pg/ml was 42.4%. This percentage worsened, falling to 31.5%, recovering in the final measurement to 38.8%, coinciding with a greater use of calcitriol and paricalcitol, especially in association with cinacalcet (figure 3), although it never exceeded 40%. Paradoxically, although there was no significant change in the distribution of frequencies in the different ranges, there was a constant, progressive fall in the four measurements of average PTH values, which went from 366 to 242pg/ml during the nine months of measurement, which indicates a fall in the number of patients with extremely high PTH values. Increasing the target interval values to 100-350pg/ml, an increase from 54.1 to 69.4% was seen, and a fall in the highest values of 350pg/ml, with the percentage of patients below 100pg/ml stable at around 14% in all the measurements. This indicates that, while patients with PTH > 350pg/ml (from 31.8 to 16.3%) were halved, the percentage of patients with PTH between 100 and 150pg/ml doubled (from 10.6 to 19.4%) (table 2.)
Adequacy area
The first two measurements of the Kt/V indicator were seen to be below the standard, with values of 75.5 and 73.7%, respectively. After adjusting the treatment regimens, an increase in the percentage of patients with Kt/V ≥ 1.3 was achieved, remaining between 84.5 and 88.8% during four measurements, before falling once more to 74.5%. After two measurements, the percentage of patients within the standard recovered to 93%. Of the last eight measurements, the standard was achieved in five (table 3.)
Cardiovascular risk area
The essential data registered in this section is blood pressure, which was included as an indicator in February 2007. As is usual in patients on HD, there were no problems controlling Diastolic Blood Pressure (DBP), with percentages of patients with DBP ≥ 90mmHg between 3.3 and 1.1%; i.e. only one isolated patient presented these figures.
In contrast to the case of DBP, it has been difficult to maintain the values of SBP below the limits sets (≤ 140mmHg.) It was only possible to achieve 62.2% of patient in the last measurement. However, there was a reduction in SBP values, as the percentage of patients with SBP ≤ 150mmHg increased constantly and progressively in all four measurements, from 67.8 to 85.7% (table 4.)
Vascular access area
In the three years of the study (2005-2007), the rates of thrombosis both in Autologous Fistulae (AVF) and Prosthesis (PTFE) stayed within the standard, between 0.07 and 0.10, and between 0.23 and 0.44 episodes per patient per year, respectively. The percentage of patients with AVF in use always exceeded 80% (85, 1-81, 1%), and the maximum percentage of PTFE was 5.2% in 2006.
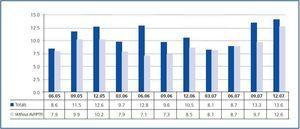
However, with regard to the percentage of patients dialysed by catheter, the objective (< 10%) was only achieved in five of the 11 measurements; although if we exclude patients with AVF or PTFE in the maturing phase, only in December 2006 and December 2007 was the figure of 10% exceeded (figure 4.) The difficulty in achieving the targets set does not depend, in our case, on any difficulty gaining access to vascular surgery or interventional radiology services, but on the high percentage of patients starting HD by catheter (43.8% in 2005, 31.6% in 2006 and 50% in 2007.) At the same time, these patients did not come from the predialysis clinic, but were patients who started HD as acute hospitalised patients or, to a lesser extent, from renal transplant or peritoneal dialysis programmes.
Morbidity and mortality area
The hospitalisation rate was between 0.49 and 0.71 episodes per patient per annum, and between 2.7 and 6.0 days per patient per year, including admittances in Nephrology, other departments or hospitals and scheduled hospitalisations. Fatality varied from 12.3% (2005) and 16.8% (2006) to 9.5% (2007) (fatalities among patients on HD from the registry of kidney patients of the Autonomous Community of Valencia, year 2005: 16.7%.) With regard to the analysis of survival, the overall results can be superimposed on those which are recorded for each autonomous community (table 5.)
DISCUSSION
Quality systems are originated, implanted and developed in the world of industry and are then progressively incorporated in other settings, one of which is the healthcare area.1 Within this quality system, indicators are tools that measure activity, in our healthcare area, both in terms of efficacy and efficiency. A measure can be used both for discovering the results of an activity, and, through analysis, preparing a plan for on-going improvement of these results.2 Therefore, the choice of measure, the way it is measured, its definition and the standard target set are criteria for which the conclusions of its analysis and the measurements derived thereof will be useful and appropriate. In the Nephrology field, the definition of a measure, generally a range of an analytical or clinical parameter, is derived from clinical guides, and the standard, degree or percentage of compliance are established using the results of published series.3
In our Unit, since obtaining the ISO 9001:2000 quality certificate in 2005, we have been engaged in an on-going process of gathering a series of measures covering all the processes involved in our activity (haemodialysis, peritoneal dialysis, outpatient consultations, hospitalisation, etc.) Given the structure of the Nephrology Department of a district hospital, the clinical indicators of the haemodialysis unit account for most of this regular activity. In this way, together with the individual care provided to patients on a daily basis, regular analyses are also made of the entire haemodialysis patient group and decisions are taken jointly with regard to how to act on certain parameters. These interventions are almost always able to modify the results of later measurements, generally to the better;7 however, we have sometimes observed that excess interventionism has led to unexpected effects, essentially an increase in the variability of certain parameters in individual patients during short periods of time, which may lead to iatrogenia.
With regard to anaemia, more than 12 months of larger doses of erythropoietic stimulating agents (ESA) were needed to reach the standard set for the haemoglobin indicator (85% patients Hb ≥ 11g/dl.) However, this also involved a progressive increase in the number of patients with Hb > 13g/dl which exceeded 20% of the patients, coinciding with the larger percentage of patients with Hb ≥ 11g/dl (figures 1a and 1b.) The correction made to avoid the phenomenon caused a further reduction in the percentage of patients above the limit proposed. The range of Hb ≥ 11g/dl as an indicator for anaemia is drawn from the European anaemia management guide,5 although individualisation of the objective is recommended, reducing the maximum levels to 12g/dl for diabetics and patients with cardiovascular disease. Following this, various studies gathered in the Phrommintikul’s meta-analysis,8 that show that higher levels of mortality, hypertension and thrombosis of vascular access in patients with higher Hb (12-16g/dl), show the need to establish a higher limit in the haemoglobin range. The revision of the KDOQI anaemia9 guide put this higher range at 13g/dl, with an ideal interval of between 11 and 12. Recently, the Spanish Agency for Medicines and Health Products (Agencia Española de Medicamentos y Productos Sanitarios), attached to the Spanish Ministry of Health, has prepared an informative note10 setting out the increased risk of death for renal patients with high Hb and recommending an interval of between 10 and 12g/dl. This reduction in haemoglobin levels with a margin of between 1 and 2g/dl leads us to another problem: variability of Hb.11 Often, with the intention of adjusting the Hb figure in each patient, healthcare professionals make frequent adjustments to the dose of ESA which may lead to continuous departures below and above the range, which is excessively narrow. According to our experience, the percentage of patients with Hb < 10g/dl can easily be kept below 10%, including patients with chronic bleeding, neoplasias, etc. As a result, It would not seem unreasonable to suggest as a range for the indicator a wide margin of between 10 and 13g/dl, which would enable a large percentage of stable patients to be kept free of excess interventionism, and would at the same time permit individualisation of the target in the different subgroups (young people without morbidity, diabetics with cardiovascular disease, etc.) without excluding them from the target range. In the mineral metabolism area, we were based on patient percentages for phosphorus < 5.5mg/dl of 77.5%, for calcium between 8.4-9.5mg/dl of the 30.3% and for PTH between 150-300pg/ml of 42.4%. Percentages were above those gathered in the DOPPS-II12 for phosphorus and PTH, and below them in the case of calcium (given that initially our higher range was 10mg/dl.) The increased number of patients treated with cinacalcet, from 11.1 to 27.3% (figure 3), allowed us to improve results, surpassing 85% in the KDOKI13 range for phosphorus and improving that for calcium up to 72.7% with a reduction of hypercalcaemic patients, although at the sacrifice of 10.1% with calcium < 8.4mg/dl.
However, in the evolution of the results with regard to the PTH, if we analyse only the percentages of patients in the KDOQI range (150-300pg/ml), they not only improve, but also slightly descend (table 2.) Indeed, if we make a more detailed analysis of the evolution of the PTH, there is a continuous drop in the average values from 366 to 242 pg/ml and an increase of up to 72.5% of patients with less than 300pg/ml, a similar percentage to those shown in studies of patients with hyperparathyroidism treated with cinacalcet.14,15 The changes produced fundamentally an increase in patients with PTH of between 100-150pg/ml, outside the KDOQI range, and the final result was that more than 80% of the patients had PTH < 350pg/ml. The first conclusion we can draw is that the indicator based on the KDOQI range of PTH (150-300pg/ml) is not capable of detecting the evident improvement of our results. Thus, one of the essential functions of a measure is lost, which is the measure’s capacity to show the beneficial or detrimental impact of an activity, in this case the control of PTH.
In this field, during the past 10 years, the successive appearance of new drugs (non-calcium binders, vitamin D analogues or activators of its receptor [AsRVD] and cinacalcet), the multitude of factors involved (dietary, proper intake of binders, calcium solution, drugs used to decrease vitamin D with actions on calcium and phosphorus levels, etc.), as well as the proliferation of guides and recommendations with variable levels of evidence, have made the problem more complex.
For example, the change in European recommended calcium levels of 8.8 and 11mg/dl in 200016 to the 8.4-9.5mg/dl range in the KDOQI guidelines in 200313 meant making radical changes in treatment regimens for patients on HD with regard to the dialysis solution and the contribution of calcium binders with repercussions on the test results, particularly an increase in PTH levels.17 The subsequent appearance of cinacalcet led to a fall in these levels.18 During recent years, our patients have changed their attitude to the treatment of mineral metabolism and renal bone disease, and sometimes therapeutic attitudes that have not been questioned have not improved their evolution, but have caused a tremendous increase in financial costs. In this respect, interesting topics of discussion are the results of Palmer's meta-analysis, in which vitamin D compounds were found not to cause consistent reductions in PTH levels and their benefits on patients must be proven,19 as are the editorial comments in NDT20 on this, with the widespread idea of adapting treatments to minimise side effects and the appropriateness of conducting studies that enable them to be managed correctly and their costs to be justified.21 We also wish to draw attention to the most recent DOPPS data on 25,588 patients, as yet unpublished, which shows no significant differences in mortality for PTH values of between 100-300 and 300-600pg/ml, according to calcium and phosphorus values.22
The SEN quality management group has proposed a standard in which more than 30% of patients should have PTH of between 150 and 300pg/ml and comments that the maximum achievable would be 50%.3 In our opinion if the standard of a measure includes fewer than one third of patients at risk, it is not useful, because it does not detect, as in our case. the response obtained after the interventions carried out and the analysis of the results. The same problem occurs when the interval is excessively narrow, which is considered difficult to achieve a priori, in spite of the many, costly therapeutic actions, with frequent changes in criteria and without any evidence of being exempt from undesirable effects.
New drugs and the information we now have available can lead us to redefine the measures and standards to be achieved in the area of bone-mineral metabolism, as well as a joint evaluation of these. We would go so far as to suggest that the phosphorus measure could be established below 5mg/dl23 for calcium between 8.4 and 10mg/dl,22 and for PTH between 100 and 500pg/ml (limits that must not be exceeded according to the SEN bone-mineral metabolism guidelines)23 or 100-600pg/ml,22 with standards that allow us to include most of the patients.
Few controversies can be established with regard to the adjustment of dialysis. Our range is based on the recommendations of the SEN guideline in haemodialysis centres24 of reaching a kt/V ≥ 1.3. Our impression is that the measurements in which this measure did not achieve the standard coincided with the inclusion of new patients in the programme, some of whom were unknown at the clinic and who were dialysed by catheter, as well as experiencing vascular access problems. In some series,25 the measurement of the indicators started several months after HD had begun. This attitude is also recommended by the SEN quality group for measuring Hb.3 Therefore, the recommendation to start measuring the indicators, at least those in analytical tests, three or four months after commencing dialysis, once the patient has been stabilised, with well developed vascular access after several weeks of puncture and with a progressive adaptation to the HD session.
Another indicator of vital importance is blood pressure, given its relationship with the mortality and morbidity of patients on HD. In the case in question, it was not possible to achieve a percentage of over 62.2% of patients with SBP ≤ 140mmHg, although we obtained a progressive improvement from 70% of patients with ≤ 150mmHg to more than 85% in 12 months (table 4.) Although we initially set the target range ≤ 140/90mmHg for our patients, in line with generally accepted guidelines,26 after one year of follow up it was observed that a slightly more modest target of ≤ 150/90mmHg is achievable and is better tolerated by the patients. Certain recently-published studies have shown an increase in mortality25 and intradialytic morbidity27 when the target sought is <140/90mmHg predialysis and < 130/80mmHg post dialysis. Extrapolation to patients on HD of basic guides in studies on the general population can lead us to assume potentially iatrogenic attitudes as evidence. An aspect as essential as blood pressure in patients on HD must be based on specific controlled studies of these patients to generate evidence.
It is also important to use the appropriate guidelines for our area. In the vascular access area, the SEN3 quality group uses the KDOQI vascular access measure28 in the standard for native arteriovenous fistulae: 0.25 episodes per patient per year. In Spain, this range would be unacceptable (one thrombosed fistula per annum for every four patients in the programme), as in our country the rate is around 0.1,29 meaning we have set a standard of 0.15
episodes per patient per year. The most controversial aspect of vascular access is that of the prevalence of catheters for permanent vascular access, the frequency of which is on the rise, both due to the characteristics of the patients currently on HD and the difficulty experienced by certain units to access vascular surgery units or interventional radiology. However, the KDOQI28 recommendation of keeping 10% or fewer patients with permanent catheter access is still followed. In our Unit, where we have easy access to vascular surgery and reparative interventional radiology with no waiting list, during recent years we have been unable to maintain this standard. In the British guidelines for 200730 it is suggested that HD centres should regularly audit the frequency of catheterised patients to keep the figure below 20%. Perhaps in Spain, a standard between the two positions should be sought (10-20%.)
Finally, we would like to comment that in our opinion, all HD units should start measuring their morbidity and mortality results (survival curves and hospitalisation rates) and compare them with those in their surroundings as the most important parameter when it comes to considering the quality of treatment received by their patients. The rate proposed by the SEN Quality Management group drew our attention (≤ 1,5 episodes/patient/year), when in our experience it is possible to achieve a lower rate of episode/patient/year.
To conclude, we consider that using measures in haemodialysis has enabled us to improve our patients’ results, but that it has also given rise to a series of questions with regard to matters set out in the literature and which were considered undisputable. The SEN3 quality management group’s experience has also been extremely helpful to us, as has its review of the literature on the subject, and its proposals for measures and standards. However, this activity has been taking place for less than a decade and has important implications for the therapeutic decisions taken in daily practice by nephrologists at HD units. Therefore, we believe that certain indicators need to be redefined, and that the ranges proposed in the guidelines should not be accepted without question, as the years go by they may need to be revised on the basis of new evidence, using wider ranges and standards to include the majority of patients, and applying conservative criteria to avoid excess interventionism that may lead to variability or iatrogenicity.
AUTHORS NOTE
Once the first version of this article was submitted to the editorial group at Nefrología, we learned of a multicentre study conducted by the SEN Quality Management Group (CNSEN), which studied the quality indicators of 28 haemodialysis units and included more than 2,500 patients over a 12-month period. A pre-publication version of this was available at the time of writing this note on the SEN31 Web page. We consider that CNSEN, due to its experience and the guarantee of SEN, and this study in particular, based on the number of centres and patients included, are necessary references on the quality of haemodialysis in Spain. However, no references have been made to this in our article as we did not have access to the content while preparing the initial or final drafts, and reading it has not changed our approach to the questions arising from suggesting measuring HD indicators.
Table 1. Indicators used in the Haemodialysis Unit at Alcoy Hospital
Figure 1.
Figure 2.
Figure 3.
Table 2. Results of the PTH indicator: percentages of patients in the different ranges, average of PTH and percentage of patients with PTH between 100 and 150pg/ml and below to 350pg/ml in each measurement
Table 3. Percentage of compliance with the dialysis dose indicator
Table 4. Percentages of patients according to their systolic blood pressure range
Figure 4.
Table 5. Patient survival


