


There is still a lack of information regarding the impact of sodium-glucose cotransporter 2 inhibitors (SGLT2i) on bone and mineral metabolism in patients with diabetes and chronic kidney disease (CKD). Therefore, we aimed to investigate the effects of SGLT2i in a cohort of patients suffering from diabetic kidney disease (DKD).
MethodsIn this prospective observational study, patients with type 2 diabetes and biopsy-proven diabetic nephropathy or presumptive DKD with eGFR levels ≥20 ml/min/1.73m2 and 25-OH vitamin D levels ≥20 ng/dl were included. 41 used SGLT2i (study group) and 39 continued their current treatment regimens (control group). Serum FGF-23, sclerostin, osteoprotegerin (OPG), and hydroxyproline levels were measured at baseline, 1 month and 3 months after treatment.
ResultsMean age of all patients was 67±9.3 years, and 48 (60%) were female. All patients in the study group used dapagliflozin. Taking into account the renal functions at the commencement of the study, the eGFR values for the study group and the control group were 51.2±15.6 and 44.6±16.9ml/min/1.73m2, respectively (p=0.01). After three months, these values were observed to be 47.4±16.7 and 44.3±18.8 ml/min/1.73m2 (p=0.43), respectively. At baseline, OPG levels were higher in the study group (p=0.025) but there were no differences between the groups in terms of FGF-23 and sclerostin levels (p=0.670 and p=0.467, respectively). Levels of OPG, FGF-23, and sclerostin significantly decreased throughout 3 months of treatment with dapagliflozin (p<0.001 for all). Hydroxyproline levels also declined but did not reach to statistical significance (p=0.075). Multiple linear regression models revealed that treatment with SGLT2i was associated with the change in levels of sclerostin (β=0.303, p=0.011) and OPG (β=0.210, p=0.010), but not with FGF-23 (β=0.089, p=0.150).
ConclusionsFGF-23, sclerostin and OPG levels significantly declined after treatment with dapagliflozin for 3 months.
Existe aún una falta de información sobre el impacto de los inhibidores del cotransportador de sodio-glucosa 2 (SGLT2i) en el metabolismo óseo y mineral en pacientes con diabetes y enfermedad renal crónica (ERC). Por esta razón, nos propusimos investigar los efectos de loa SGLT2i en una cohorte de pacientes con enfermedad renal diabética (ERD).
MétodosEn este estudio prospectivo observacional, se incluyeron pacientes con diabetes tipo 2 y presencia de nefropatía diabética (ERD) bien sea confirmada por biopsia o con sospecha de la misma, con niveles de eGFR ≥ 20 mL/min/1,73 m2 y niveles de vitamina D (25-OH) ≥ 20 ng/dL. Los pacientes se asignaron a dos grupos: un total de 41 pacientes que fueron tratados con SGLT2i (grupo de estudio) y 39 que continuaron con sus regímenes de tratamiento habituales (grupo control). Se midieron los niveles séricos de FGF-23, esclerostina, osteoprotegerina (OPG) e hidroxiprolina al inicio, al primero y a los tres meses después del tratamiento.
ResultadosLa edad media de todos los pacientes fue de 67 ± 9,3 años, y 48 (60%) eran mujeres. Todos los pacientes en el grupo de estudio utilizaron dapagliflozina. Considerando las funciones renales al inicio del estudio, los valores de eGFR para el grupo de estudio y el grupo control fueron 51,2 ± 15,6 y 44,6 ± 16,9 mL/min/1,73 m2, respectivamente (p = 0,01). Después de tres meses, los valores observados fueron de 47,4 ± 16,7 y 44,3 ± 18,8 mL/min/1,73 m2 (p = 0,43), respectivamente. Al inicio, los niveles de OPG fueron más altos en el grupo de estudio (p = 0,025), pero no hubo diferencias entre los grupos en cuanto a los niveles de FGF-23 y esclerostina (p = 0,670 y p = 0,467, respectivamente). Los niveles de OPG, FGF-23 y esclerostina disminuyeron significativamente durante los tres meses de tratamiento con dapagliflozina (p < 0,001 para todos). Los niveles de hidroxiprolina también disminuyeron, pero no alcanzaron significancia estadística (p = 0,075). Los modelos de regresión lineal múltiple revelaron que el tratamiento con SGLT2i estuvo asociado con el cambio en los niveles de esclerostina (β = 0,303, p = 0,011) y OPG (β = 0,210, p = 0,010), pero no con FGF-23 (β = 0,089, p = 0,150).
ConclusionesLos niveles de FGF-23, esclerostina y OPG disminuyeron significativamente luego del tratamiento con dapagliflozina durante tres meses.
Diabetes mellitus (DM) is a worldwide disease that progresses with macrovascular and microvascular complications and one of the leading causes of chronic kidney disease (CKD) around the world.1 Patients with DM and CKD are at risk for acute diabetes complications such as hypoglycemia and diabetic ketoacidosis, but they should also be monitored for long-term complications such as retinopathy, neuropathy, nephropathy, and cardiovascular disease.2 Sodium-glucose cotransporter 2 inhibitors (SGLT2i) have recently become a drug of choice in patients with diabetic kidney disease (DKD). Most recent The Kidney Disease: Improving Global Outcomes (KDIGO) 2022 guideline recommended SGLT2i in patients with type 2 DM and CKD as a first line treatment if estimated glomerular filtration rate (eGFR)≥20ml/min/1.73m2.2 In addition to their effects on glomerular hemodynamics, it has been suggested that SGLT2i might alter calcium and phosphate metabolism, with minor increases in serum magnesium, phosphate, and parathormone (PTH) due to its renal tubular mechanism of action.3,4
Changes in these components in CKD have significant clinical consequences in the bone and vascular systems,5 including decreased bone mass, increased fragility and fracture, and vascular and valvular calcifications.6 Bone and mineral markers such as osteoprotegerin (OPG), sclerostin, fibroblast growth factor-23 (FGF-23), and hydroxyproline are known to play a role in events such as metabolic bone disease, vascular calcification, and inflammation.7–10 More clinical research is needed to determine whether SGLT-2i affect bone metabolism.
We hypothesized that biomarkers such as OPG, sclerostin, FGF-23 and hydroxyproline, which have been shown to be related to vascular calcification and inflammation, may change positively in patients with DKD treated with dapagliflozin. Therefore, we aimed to investigate the effects of dapagliflozin in a cohort of patients suffering from DKD.
Materials and methodsPatientsPatients with a previous diagnosis of type 2 DM and biopsy-proven or presumptive DKD urinary albumin-creatinine ratio≥30mg/g or urinary protein–creatinine ratio (UPCR)≥200mg/g, or eGFR<60ml/min/1.73m2 in minimum two occasions 3 months apart who had eGFR levels≥20ml/min/1.73m2 and 25-OH vitamin D levels≥20ng/dl were included in this prospective observational study. Among 155 patients with DKD followed up in our nephrology outpatient clinic, 90 patients met the aforementioned criteria, and SGLT2i were offered to all patients. In our country, only dapagliflozin and empagliflozin were reimbursed by the single-payer healthcare system, and the choice of SGLT2i was at the discretion of treating physician. Those who chose to use SGLT-2i were classified as ‘study group’, while those who continued their current treatment regimen were classified as ‘control group’. All participants were informed in detail about the content of the study and included in the study with a voluntary consent form. Patients with a diagnosis of osteoporosis or using corticosteroids were excluded. Furthermore, those whose diuretic and anti-diabetic treatment regimens were changed during the 3-month follow-up were excluded from the study. Flow chart is shown in Fig. 1.

As part of the demographic data, age, sex, duration of DM, comorbidities and drug uses were noted. Patients in the study group were evaluated at baseline, and 1 month and 3 months after treatment initiation. The control group was evaluated at baseline and 3 months.
BiomarkersAfter 8–10h of fasting, venous blood samples were taken from the participants in the morning, and the samples were sent to the laboratory on the same day without waiting, and routine biochemical analyses were performed. Within the scope of the study, 5ml of sample were separated from the venous blood sample taken during routine blood collection by putting it into a gel-free tube. These separated samples were centrifuged at 4000rpm for 10min to separate plasma and serum. Serum samples were stored at −80°C until the time of analysis. UPCR and urinalysis were performed in first morning specimens of the day of blood sampling.
Serum FGF-23, sclerostin, OPG, and hydroxyproline levels, as well as urea, creatinine, sodium, potassium, calcium, albumin, phosphate, magnesium levels were measured. Biochemical tests were performed with the Abbott Diagnostic Architect c16000 Clinical Biochemistry Analyzer. Creatinine was analyzed using a standart Jaffe method on a Siemens Atellica analyzer using commercially available kits manufactured by Siemens. PTH was analyzed with the Abbott Diagnostic i2000SR Immunoassay Analyzer, using the Chemiluminescent Microparticle Immuno Assay method. Commercially available enzyme-linked immunosorbent assay kits were used for OPG, sclerostin, FGF-23 and hydroxyproline analyses OPG (catalog No: BTB-E1558Hu, standard curve range: 0.05–15ng/ml, sensitivity: 0.023ng/ml), sclerostin (catalog no: BTB-E3068Hu, standard curve range: 0.5–200ng/ml, sensitivity: 0.26ng/ml), FGF-23 (catalog no: BTB-E0059Hu, standard curve range: 5–1500pg/ml, sensitivity: 2.49pg/ml) (this kit is used for the detection of intact FGF23), and hydroxyproline (catalog no: BTB-E1900Hu, standard curve range: 20–4500nmol/l, sensitivity: 10.22nmol/l). eGFRs of patients were calculated by using CKD Epidemiology Collaboration (CKD-EPI) 2009 equation.11
Statistical analysisSPSS for Windows (SPSS version 25.0, IBM Corp., Armonk, NY, USA) was used for statistical analysis. Results were expressed as mean±standard deviation (SD) when normally distributed or as median interquartile range (IQR), 25–75% otherwise. Categorical variables were shown as frequency (%). Comparisons of continuous variables between two groups were made by using t-tests or the Mann–Whitney U test. Paired t-test or Wilcoxon signed-rank test was used to compare levels at baseline and after the treatment. Differences in proportions of different patient groups were compared using the Chi-squared test. Δ value of each biomarker represented the subtraction of the value at 3 months from the baseline value. In order to determine the factors affecting the change in biomarker levels (Δ), first simple and then multiple linear regression analysis was performed. For multiple linear regression analysis, variables were selected according to their statistical significance (p<0.10) in simple linear regression. All analyses were two sided and a p value of 0.05 or less was considered as statistically significant.
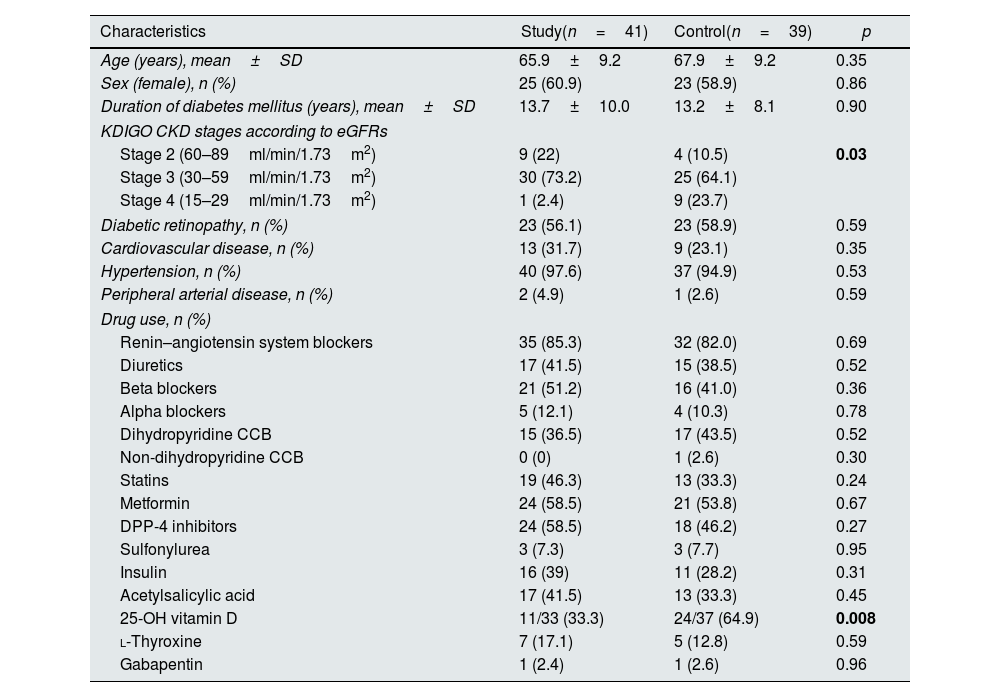
ResultsBaseline characteristics of patientsOverall, 47 patients agreed to use SGLT2i and were assigned to the study group. Forty-one of them (51.3%) completed the follow-up and were analyzed, while the control group consisted of 39 patients (48.7%). All patients in the study group were prescribed dapagliflozin 10mg/day. Mean age of all 80 patients was 67±9.3 years, and 48 (60%) were female. Two female patients in the control group and one in the study group were in the premenopausal period. The remaining individuals were all in the postmenopausal period; however, we lacked information regarding the timing of their entry into menopause. Mean duration of DM diagnosis was 13.4±9 years. There were no significant differences in terms of age (p=0.35), sex (p=0.86), duration of DM (p=0.90) and comorbidities between the study and control groups. Of 80 patients, 16.3% had stage 2 CKD, 68.8% had stage 3 CKD, and 12.5% had stage 4 CKD according to KDIGO guideline.12 Baseline characteristics of all patients are shown in Table 1. In the study group, 33.3% of participants (11 individuals) and in the control group, 64.9% of participants (24 individuals) were using native vitamin D. None of the patients were administered active forms of vitamin D, such as calcitriol and calcidiol, or any phosphate binders or medications such as paricalcitol. Nevertheless, it is noteworthy that 25-OH-vitamin D (calcidiol) levels remained within the normal range for all patients throughout the duration of the study.
Baseline clinical characteristics of all patients.
| Characteristics | Study(n=41) | Control(n=39) | p |
|---|---|---|---|
| Age (years), mean±SD | 65.9±9.2 | 67.9±9.2 | 0.35 |
| Sex (female), n (%) | 25 (60.9) | 23 (58.9) | 0.86 |
| Duration of diabetes mellitus (years), mean±SD | 13.7±10.0 | 13.2±8.1 | 0.90 |
| KDIGO CKD stages according to eGFRs | |||
| Stage 2 (60–89ml/min/1.73m2) | 9 (22) | 4 (10.5) | 0.03 |
| Stage 3 (30–59ml/min/1.73m2) | 30 (73.2) | 25 (64.1) | |
| Stage 4 (15–29ml/min/1.73m2) | 1 (2.4) | 9 (23.7) | |
| Diabetic retinopathy, n (%) | 23 (56.1) | 23 (58.9) | 0.59 |
| Cardiovascular disease, n (%) | 13 (31.7) | 9 (23.1) | 0.35 |
| Hypertension, n (%) | 40 (97.6) | 37 (94.9) | 0.53 |
| Peripheral arterial disease, n (%) | 2 (4.9) | 1 (2.6) | 0.59 |
| Drug use, n (%) | |||
| Renin–angiotensin system blockers | 35 (85.3) | 32 (82.0) | 0.69 |
| Diuretics | 17 (41.5) | 15 (38.5) | 0.52 |
| Beta blockers | 21 (51.2) | 16 (41.0) | 0.36 |
| Alpha blockers | 5 (12.1) | 4 (10.3) | 0.78 |
| Dihydropyridine CCB | 15 (36.5) | 17 (43.5) | 0.52 |
| Non-dihydropyridine CCB | 0 (0) | 1 (2.6) | 0.30 |
| Statins | 19 (46.3) | 13 (33.3) | 0.24 |
| Metformin | 24 (58.5) | 21 (53.8) | 0.67 |
| DPP-4 inhibitors | 24 (58.5) | 18 (46.2) | 0.27 |
| Sulfonylurea | 3 (7.3) | 3 (7.7) | 0.95 |
| Insulin | 16 (39) | 11 (28.2) | 0.31 |
| Acetylsalicylic acid | 17 (41.5) | 13 (33.3) | 0.45 |
| 25-OH vitamin D | 11/33 (33.3) | 24/37 (64.9) | 0.008 |
| l-Thyroxine | 7 (17.1) | 5 (12.8) | 0.59 |
| Gabapentin | 1 (2.4) | 1 (2.6) | 0.96 |
Abbreviations: CCB: calcium channel blocker, CKD: chronic kidney disease, DPP-4: dipeptidyl peptidase-4, eGFR: estimated glomerular filtration rate, KDIGO: Kidney Disease: Improving Global Outcomes, SD: standard deviation. Statistically significant p values are shown in bold.
Baseline mean values of serum glucose (p=0.02), HbA1c (p<0.001) and potassium (p=0.007) levels were higher in the study group compared to the control group at baseline. Serum creatinine (p=0.01) level was lower in the study group, as well. These differences disappeared after therapy. At 3 months, serum uric acid levels (p=0.004) were lower and urine density (p=0.01) was higher in the study group. Results of biochemical parameters and urinalysis of the two groups are shown in Table 2.
Various biochemical parameters at baseline and 3 months in study and control groups.
| Biochemical parameters | Study baseline(n=41) | Control baseline(n=39) | p | Study 3 months(n=41) | Control 3 months(n=39) | p |
|---|---|---|---|---|---|---|
| Glucose (mg/dl), mean±SD | 152.5±51.1 | 129.2±33.7 | 0.02 | 149.3±63.1 | 138±53.3 | 0.39 |
| HbA1c (%), mean±SD | 7.4±0.69 | 6.6±0.79 | <0.001 | 7.3±1.34 | 6.9±1.04 | 0.32 |
| Serum creatinine (mg/dl), mean±SD | 1.29±0.31 | 1.49±0.37 | 0.01 | 1.39±0.36 | 1.51±0.44 | 0.17 |
| eGFR (ml/min/1.73m2), mean±SD | 51.2±15.6 | 44.6±16.9 | 0.07 | 47.4±16.7 | 44.3±18.8 | 0.43 |
| Serum albumin (g/dl), mean±SD | 4.5±0.30 | 4.4±0.39 | 0.33 | 4.5±0.31 | 4.4±0.36 | 0.19 |
| Uric acid (mg/dl), mean±SD | 6.46±1.45 | 6.9±1.55 | 0.18 | 6.14±1.18 | 7.0±1.57 | 0.004 |
| Calcium (mg/dl), mean±SD | 9.6±0.42 | 9.5±0.39 | 0.49 | 9.6±0.40 | 9.5±0.36 | 0.20 |
| Magnesium (mg/dl), mean±SD | 1.74±0.29 | 1.77±0.20 | 0.69 | 1.92±0.28 | 1.82±0.21 | 0.94 |
| Phosphate (mg/dl), mean±SD | 3.60±0.61 | 3.55±0.66 | 0.73 | 3.89±0.50 | 3.69±0.74 | 0.19 |
| Sodium (mmol/l), mean±SD | 139.3±2.8 | 139.6±2.50 | 0.51 | 139.5±2.2 | 139.5±2.3 | 0.96 |
| Potassium (mmol/l), mean±SD | 4.89±0.4 | 4.63±0.40 | 0.007 | 4.73±0.4 | 4.69±0.5 | 0.61 |
| Bicarbonate (mmol/l), mean±SD | 26.8±2.45 | 26.4±2.8 | 0.49 | 26.1±2.68 | 27.1±3.3 | 0.13 |
| PTH (pg/ml), median (IQR) | 64.2 (45.9–90.9) | 76.3 (49.4–102.6) | 0.36 | 76.2 (45.8–109.6) | 80 (48.2–115.4) | 0.59 |
| ALP (U/L), mean±SD | 79.3±30.4 | 76.7±26.5 | 0.70 | 79.2±28.9 | 76.1±27.3 | 0.63 |
| Leukocyte (103/μl), mean±SD | 10.3±13.0 | 7.7±1.47 | 0.22 | 8.5±2.4 | 7.8±1.5 | 0.43 |
| Hemoglobin (g/dl), mean±SD | 12.5±1.45 | 12.6±1.65 | 0.71 | 13.0±1.61 | 12.6±1.75 | 0.11 |
| Urine density, mean±SD | 1.012±0.006 | 1.013±0.005 | 0.39 | 1.018±0.007 | 1.014±0.006 | 0.01 |
| Urine pH, mean±SD | 6.00±0.1 | 6.08±0.3 | 0.11 | 6.01±0.0 | 6.02±0.2 | 0.74 |
| UPCR (g/g), median (IQR) | 0.22 (0.14–0.44) | 0.29 (0.12–0.71) | 0.64 | 0.16 (0.13–0.36) | 0.21 (0.12–0.68) | 0.66 |
Abbreviations: ALP: alkaline phosphatase, eGFR: estimated glomerular filtration rate, IQR: interquartile range, PTH: parathormone, SD: standard deviation, UPCR: urine protein-to-creatinine ratio. Statistically significant p values are shown in bold.
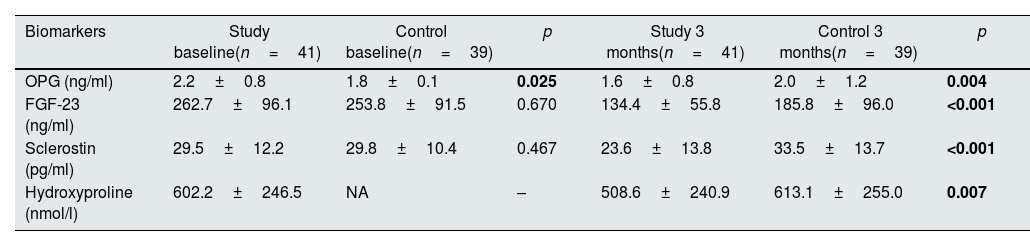
At baseline, OPG levels were significantly higher in the study group (p=0.025) but there were no differences between the groups in terms of FGF-23 and sclerostin levels (p=0.670 and p=0.467, respectively). At 3 months, levels of OPG, FGF-23, sclerostin and hydroxyproline were significantly lower in the study group compared to the control group (p=0.004, p<0.001, p<0.001 and p=0.007, respectively). Hydroxyproline levels could not be measured in the control group at baseline due to technical issues. Biomarker levels at baseline and 3 months are shown in Table 3.
Biomarker levels at baseline and 3 months in study and control groups.
| Biomarkers | Study baseline(n=41) | Control baseline(n=39) | p | Study 3 months(n=41) | Control 3 months(n=39) | p |
|---|---|---|---|---|---|---|
| OPG (ng/ml) | 2.2±0.8 | 1.8±0.1 | 0.025 | 1.6±0.8 | 2.0±1.2 | 0.004 |
| FGF-23 (ng/ml) | 262.7±96.1 | 253.8±91.5 | 0.670 | 134.4±55.8 | 185.8±96.0 | <0.001 |
| Sclerostin (pg/ml) | 29.5±12.2 | 29.8±10.4 | 0.467 | 23.6±13.8 | 33.5±13.7 | <0.001 |
| Hydroxyproline (nmol/l) | 602.2±246.5 | NA | – | 508.6±240.9 | 613.1±255.0 | 0.007 |
Abbreviations: FGF-23: fibroblast growth factor-23, NA: not available, OPG: osteoprotegerin.
Values were reported as mean±standard deviation. Hyroxyproline could not be measured in the control group at baseline. Statistically significant p values are shown in bold.
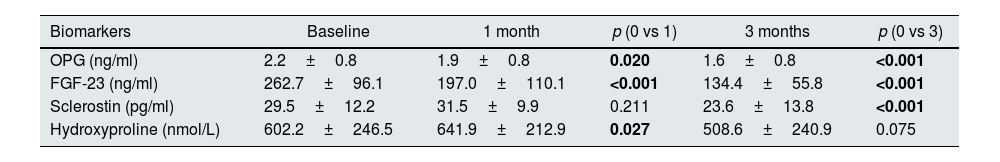
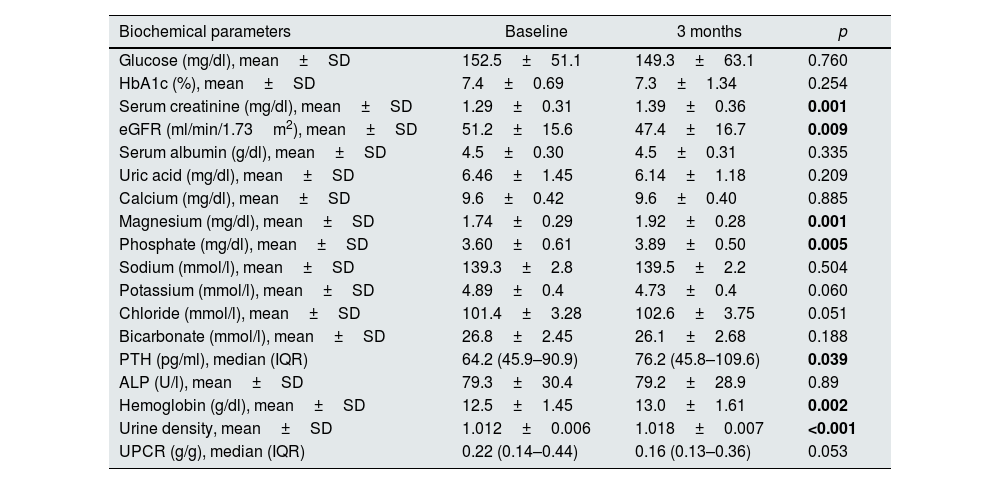
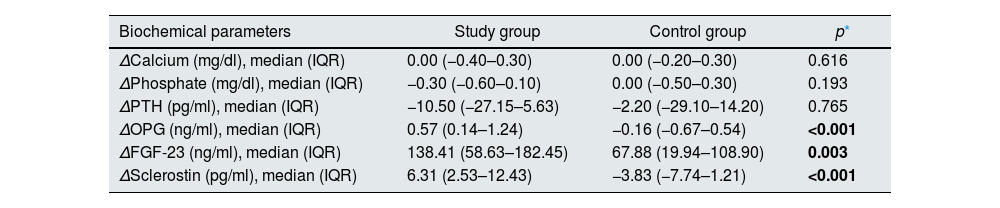
Levels of OPG, FGF-23, and sclerostin significantly decreased throughout 3 months of therapy (p<0.001 for all). Hydroxyproline levels declined but did not reach to statistical significance (p=0.075) (Table 4). Moreover, throughout the follow-up, serum creatinine (p=0.001), magnesium (p=0.001), phosphate (p=0.005), PTH (p=0.039), hemoglobin (p=0.002) and urine density (p<0.001) increased after using SGLT2i (Table 5). Comparison of two groups in terms of differences between the initial values of biochemical parameters related to bone-mineral metabolism and the values at the end of the third month (Delta (Δ)=first value−last value) are shown in Table 6. Moreover, the change in biomarkers related to bone mineral metabolism in 3 months is shown in Fig. 2.
Biomarker levels at baseline, 1 month and 3 months in the study group (n=41).
| Biomarkers | Baseline | 1 month | p (0 vs 1) | 3 months | p (0 vs 3) |
|---|---|---|---|---|---|
| OPG (ng/ml) | 2.2±0.8 | 1.9±0.8 | 0.020 | 1.6±0.8 | <0.001 |
| FGF-23 (ng/ml) | 262.7±96.1 | 197.0±110.1 | <0.001 | 134.4±55.8 | <0.001 |
| Sclerostin (pg/ml) | 29.5±12.2 | 31.5±9.9 | 0.211 | 23.6±13.8 | <0.001 |
| Hydroxyproline (nmol/L) | 602.2±246.5 | 641.9±212.9 | 0.027 | 508.6±240.9 | 0.075 |
Abbreviations: FGF-23: fibroblast growth factor-23, NA: not available, OPG: osteoprotegerin.
Values were reported as mean±standard deviation. Statistically significant p values are shown in bold.
Various biochemical parameters at baseline and 3 months in the study group (n=41).
| Biochemical parameters | Baseline | 3 months | p |
|---|---|---|---|
| Glucose (mg/dl), mean±SD | 152.5±51.1 | 149.3±63.1 | 0.760 |
| HbA1c (%), mean±SD | 7.4±0.69 | 7.3±1.34 | 0.254 |
| Serum creatinine (mg/dl), mean±SD | 1.29±0.31 | 1.39±0.36 | 0.001 |
| eGFR (ml/min/1.73m2), mean±SD | 51.2±15.6 | 47.4±16.7 | 0.009 |
| Serum albumin (g/dl), mean±SD | 4.5±0.30 | 4.5±0.31 | 0.335 |
| Uric acid (mg/dl), mean±SD | 6.46±1.45 | 6.14±1.18 | 0.209 |
| Calcium (mg/dl), mean±SD | 9.6±0.42 | 9.6±0.40 | 0.885 |
| Magnesium (mg/dl), mean±SD | 1.74±0.29 | 1.92±0.28 | 0.001 |
| Phosphate (mg/dl), mean±SD | 3.60±0.61 | 3.89±0.50 | 0.005 |
| Sodium (mmol/l), mean±SD | 139.3±2.8 | 139.5±2.2 | 0.504 |
| Potassium (mmol/l), mean±SD | 4.89±0.4 | 4.73±0.4 | 0.060 |
| Chloride (mmol/l), mean±SD | 101.4±3.28 | 102.6±3.75 | 0.051 |
| Bicarbonate (mmol/l), mean±SD | 26.8±2.45 | 26.1±2.68 | 0.188 |
| PTH (pg/ml), median (IQR) | 64.2 (45.9–90.9) | 76.2 (45.8–109.6) | 0.039 |
| ALP (U/l), mean±SD | 79.3±30.4 | 79.2±28.9 | 0.89 |
| Hemoglobin (g/dl), mean±SD | 12.5±1.45 | 13.0±1.61 | 0.002 |
| Urine density, mean±SD | 1.012±0.006 | 1.018±0.007 | <0.001 |
| UPCR (g/g), median (IQR) | 0.22 (0.14–0.44) | 0.16 (0.13–0.36) | 0.053 |
Abbreviations: ALP: alkaline phosphatase, eGFR: estimated glomerular filtration rate, IQR: interquartile range, PTH: parathormone, SD: standard deviation, UPCR: urine protein-to-creatinine ratio. Statistically significant p values are shown in bold.
Comparison of two groups in terms of differences between the initial values of biochemical parameters related to bone-mineral metabolism and the values at the end of the third month (delta=first value−last value). (n=41 study groups and 39 control).
| Biochemical parameters | Study group | Control group | p* |
|---|---|---|---|
| ΔCalcium (mg/dl), median (IQR) | 0.00 (−0.40–0.30) | 0.00 (−0.20–0.30) | 0.616 |
| ΔPhosphate (mg/dl), median (IQR) | −0.30 (−0.60–0.10) | 0.00 (−0.50–0.30) | 0.193 |
| ΔPTH (pg/ml), median (IQR) | −10.50 (−27.15–5.63) | −2.20 (−29.10–14.20) | 0.765 |
| ΔOPG (ng/ml), median (IQR) | 0.57 (0.14–1.24) | −0.16 (−0.67–0.54) | <0.001 |
| ΔFGF-23 (ng/ml), median (IQR) | 138.41 (58.63–182.45) | 67.88 (19.94–108.90) | 0.003 |
| ΔSclerostin (pg/ml), median (IQR) | 6.31 (2.53–12.43) | −3.83 (−7.74–1.21) | <0.001 |
Abbreviations: FGF-23: fibroblast growth factor-23, IQR: interquartile range, OPG: osteoprotegerin, PTH: parathormone.
Δ: Value at baseline−value at 3 months.

We evaluated the factors associated with FGF-23, sclerostin and OPG levels at 3 months. For the change in biomarkers, simple linear regression analyses were performed in terms of demographic data, comorbidities, drug use and biochemical results. Final multiple linear regression model revealed that treatment with SGLT2i (β=0.303, p=0.011) and ΔOPG (β=0.293, p=0.009) were associated with Δsclerostin (Supplementary Table S1). Furthermore, Δsclerostin (β=0.156, p=0.028), ΔOPG (β=0.587, p<0.001), baseline OPG (β=0.894, p<0.001), and baseline FGF23 (β=0.894, p<0.001) were found to be related to the ΔFGF23. There was no significant relationship between SGLT2i use and ΔFGF23 (p=0.150) (Supplementary Table S2). On the other hand, ΔOPG value was also found to be significantly associated with SGLT2i treatment (β=0.210, p=0.010), using l-thyroxine (β=−0.176, p=0.027), baseline OPG (β=0.498, p<0.001) and baseline sclerostin (β=−0.643, p<0.001) levels (Supplementary Table S3). Similar results were found when linear regression analysis was performed only in the group receiving SGLT2i (data not shown).
DiscussionIn this study, we demonstrated that treatment with dapagliflozin significantly reduced plasma levels of OPG, sclerostin, and FGF-23, which are bone-derived biomarkers known to be closely associated with cardiovascular morbidity and mortality, in patients with diabetic nephropathy.
Various examples of research have been performed to investigate the effects of SGLT-2i on bone health. It has been suggested that SGLT-2i may affect calcium and phosphate homeostasis while facilitating urinary glucose excretion by reducing sodium and glucose reabsorption from the proximal tubules.13 SGLT-2i promote reabsorption of phosphate, which increases the plasma FGF-23 levels. Elevated FGF-23 leads to a decrease in the plasma 1,25-OH vitamin D levels.14 The negative effects of SGLT2 inhibitors on bone may be mediated by a number of mechanisms, according to earlier research. According to a recent study, SGTL2 inhibition indirectly activates the FGF23/1,25-dihydroxyvitamin D/parathyroid hormone axis, which may lead to bone health problems. Despite this, both CKD and SGLT2 inhibitors activate the FGF23/1,25-dihydroxyvitamin D/PTH axis.15 In a recent review, significant neutral effect of SGLT2 inhibitors on bone has been suggested.14 In our study, patients with DM and CKD were divided into two groups: one on SGLT2i, and the other one on conventional treatment. After 3 months of clinical follow-up, we found no significant differences in calcium, phosphate, or PTH levels between the two groups.
Massagetis-Zagajewska et al. studied the effect of empagliflozin on bone mineral metabolism markers in diabetic and non-diabetic patients with stage 3 CKD.16 Serum calcium, phosphate, PTH, bone-specific alkaline phosphatase, FGF-23, plasma calcitriol, urinary calcium, phosphate, and albumin levels were measured at baseline and 7 days after empagliflozin treatment in 42 patients in the study. In the diabetic group, serum FGF-23 concentration was higher after empagliflozin treatment than at baseline. While the diabetic group's phosphate level increased significantly after treatment, the non-diabetic group showed no significant change.16 In another study, Jong et al. examined the effect of dapagliflozin on markers involved in phosphate homeostasis 17. This study of 31 patients evaluated changes in serum calcium, phosphate, FGF-23, PTH, 25-OH vitamin D, 1,25-OH vitamin D after 6 weeks of treatment with dapagliflozin compared to placebo. They found that dapagliflozin increased serum phosphate, PTH and FGF-23 levels.17 However, when we analyzed the dapagliflozin group after 3 months of follow-up, we found a significant increase in serum phosphate and magnesium levels but a significant decrease in FGF-23. Dapagliflozin may have decreased FGF-23 by a mechanism independent of phosphate and PTH. We are very well aware that our findings contradict the established literature: FGF-23 should also have increased with the elevated levels of serum phosphate and PTH. Our work is an uncontrolled observational study which comes with its limitations. Randomized controlled study by de Jong MA et al. (ref) might be more reliable due to its design.17 Still, we think that more data are needed to reach a definitive conclusion on this issue.
Recently, the use of OPG as a biomarker in the early diagnosis of CKD-related bone mineral disorder was investigated. In this study, which included 60 patients with stages 1–5 CKD, the change in OPG level was detected in stage 3, and the correlation coefficient with GFR was found to be the highest.18 We observed that there was a significant decrease in the OPG level during the 3 months after the start of the treatment in dapagliflozin group. This finding suggests that dapagliflozin treatment may have positive effects on bone mineral metabolism seen in the later stages of CKD by lowering OPG levels.
Numerous studies have been conducted to investigate the relationship between vascular calcification and serum sclerostin. As is well known, vascular calcification is a common condition in CKD, and its prevalence increases with CKD stage.19 This condition is associated with cardiovascular events and a poor prognosis in CKD.5 Increased sclerostin levels in type 2 DM are found to be associated with aortic calcification, abnormal intima-media thickness, and carotid plaques.20 Morena et al. investigated the relationship of OPG and sclerostin with coronary artery calcification in a study involving 241 patients with non-dialysis-dependent CKD. A significant increase in OPG and sclerostin was associated with a decline in kidney function. Both markers were found to have a strong and independent relationship with coronary artery calcification. When only eGFR, OPG, sclerostin and coronary artery calcification were considered, it was discovered that there is a clear relationship between decreased renal function, increased OPG, and sclerostin.21
After 3 months, we found a significant decrease in OPG, sclerostin, and FGF-23 values after treatment with dapagliflozin. This suggests that dapagliflozin may have a protective effect on vascular calcification by lowering these markers, which are though to play an important role in the pathogenesis of vascular calcification. PTH is the primary regulator of the RANK/RANKL/OPG system which regulates bone remodeling by upregulating OPG production and stimulating osteoblast synthesis of RANKL,22 raising the possibility that an increase in PTH by dapagliflozin could lead to a decrease in OPG and sclerostin. OPG inhibits RANK-RANKL interaction by binding to the receptor activator nuclear factor kappa B ligand (RANKL) that plays anti-osteoclastogenesis role. PTH is also one of the main regulators of Wnt/β-catenin pathway in bone which inhibit sclerostin. Many studies have been researched to the effects of both OPG and sclerostin on bone mineral disease, vascular calcification.18,22 However, although there was no significant difference in ΔPTH between the two groups, the change in OPG and sclerostin levels was quite significant. This made us think that the change in these biomarkers may not only be due to PTH elevation. To the best of our knowledge the novelty of this study is the first report to demonstrate the positive effect of dapagliflozin on sclerostin and OPG.
Our study has suffered from some limitations. First, this is a single center study with a low number of patients and a short follow-up, so firm conclusions cannot be drawn. Second, the study did not involve measurements of bone mineral density by traditional methods such as bone density scan or biopsies. Third, all of our patients were prescribed dapagliflozin, so these results may not be generalizable to other SGLT2i. Fourth, the initial HbA1C values of the two groups were significantly different, whereas there was no significant difference between the initial and third month values of the study group and between the third month values of the two groups. On the other hand, our study has some strengths. To the best of our knowledge, this study was the first to demonstrate the positive effect of dapagliflozin on the levels of biomarkers such as sclerostin and OPG in patients with diabetic nephropathy. In addition, we used a control group for comparisons. Another limitation worth noting is that, despite normal levels of inactive vitamin D, a significant disparity existed between the two groups in terms of the usage of inactive vitamin D.
In conclusion, dapagliflozin significantly reduced plasma levels of OPG, sclerostin, and FGF-23 in patients with diabetic nephropathy after 3 months of treatment. Multicentered prospective studies with longer follow-up periods are still needed to evaluate the effects of SGLT2i on biomarkers of bone and mineral disease in patients with CKD.
Ethics approval and consent to participateThis study was conducted in accordance with the ethical principles of the Declaration of Helsinki, the Good Clinical Practice guidelines of the International Conference on Harmonization, and local regulatory requirements. All patients provided written informed consent. The study was approved by the local ethics committee in our institution (28.07.21/E.24878/2011-KAEK-42), and funded by the Scientific Research Projects Unit of Bezmialem Vakif University with the project code 20210831.
FundingThis work was supported by Scientific Research Projects Coordination Unit of Bezmialem Vakif University with the project number 20210831. Funding source had no role in study design, execution and reporting.
Authors’ contributionsTI participated in data collection and manuscript preparation. SM participated in data analyses and manuscript preparation. OCE participated in study design, data collection, data analyses and manuscript preparation. MG and RK participated in data collection. MD and SS carried out biochemical tests. All authors approved the final version to be submitted.
Conflict of interestsThe authors declare no competing interests.
Availability of data and materialsDeidentified data are available upon reasonable request.
We would like to thank Bezmialem Vakıf University Scientific Research Projects Coordination Unit for their valuable contributions.
The followings are the supplementary data to this article:


