

Hypertension is very common in haemodialysis (HD) patients, and is associated with increased morbidity and mortality rates.
The goals of our research were to: 1. Measure blood pressure (BP) during HD sessions; 2. Study BP in between HD sessions with 44-h Ambulatory Blood Pressure Monitoring (ABPM); 3. Evaluate changes in treatment after the ABPM; 4. Perform bioimpedance spectroscopy (BIS) on all patients and, in those hyper-hydrated or hypertensive according to ABPM, assess for changes in BP after adjusting the dry weight; 5. Identify factors associated with average systolic and diastolic BP measured by ABPM.
Material and methodsProspective observational study, which included 100 patients from our dialysis unit. We measured BP before and after the HD sessions for two weeks and then, mid-week, we attached the ABPM device to the patients for 44 h. Before starting the following dialysis session, we performed BIS. A second ABPM was performed on hyper-hydrated patients and patients hypertensive according to ABPM to evaluate changes in BP values.
ResultsAccording to the ABPM, 65% of patients had daytime BP > 135/85 mmHg, 90% night-time BP > 120/70 mmHg and 76% average BP > 130/80 mmHg; 11% had a dipper pattern, 51% non-dipper and 38% riser. The average systolic and diastolic BP readings were 4.7 mmHg (3.8%) and 1.1 mmHg (1.64%) higher on the second day. The dose of antihypertensive medication had to be lowered in 6% of patients, 9% had to stop taking it, 28% needed increased doses and 17% had to add a new drug. The pre-HD diastolic BP best matched the ABPM. After performing the bioimpedance and adjusting dry weight, there was a statistically significant decrease in all BP values. The univariate analysis showed that the average systolic BP was higher in patients with a high-calcium dialysis bath, more antihypertensive drugs and higher doses of EPO. The multivariate analysis showed significant association for EPO and number of drugs (p < 0.01). The average diastolic BP was higher in younger patients and patients with lower Charlson index, lower body mass index and less diuresis, those on higher doses of EPO and non-diabetics. The linear regression study showed age (p < 0.005), body mass index (p < 0.03) and EPO (p < 0.03) as significant variables.
ConclusionsOur study shows: 1. The variability of hypertension criteria according to use of BP values from during the HD session or ABPM; 2. The variability of BP in the interdialysis period; 3. That the pre-dialysis diastolic BP best corresponds with the ABPM. 4. That the use of both BIS and ABPM improves the control of BP; 5. That the dose of EPO is the most important factor associated with hypertension in our patients.
La hipertensión arterial (HTA) en los pacientes en hemodiálisis (HD) es muy frecuente y se asocia a un aumento de la morbimortalidad.
Los objetivos de nuestro trabajo han sido: 1. Conocer la tensión arterial (TA) en la sesión de HD. 2. Estudiar la TA, en el periodo interdialítico, mediante monitorización ambulatoria de presión arterial (MAPA) de 44 horas. 3. Conocer la concordancia entre la TA en la sesión de HD y MAPA. 4. Valorar los cambios de tratamiento después de la realización del MAPA. 5. Realizar una bioimpedancia espectroscópica (BIS) a todos los pacientes y en los hiperhidratados e hipertensos, según MAPA, valorar cambios en la TA después de ajustar el peso seco (PS). 6. Conocer factores asociados a la TA sistólica (TAS) y TA diastólica (TAD) promedio del MAPA.
Material y métodosEstudio prospectivo observacional, que incluyó a 100 pacientes de nuestra unidad de diálisis. Se han recogido las tensiones pre y post-HD, durante dos semanas y, posteriormente, colocamos a los pacientes un aparato de MAPA a mitad de semana, durante 44 horas. Previo a comenzar la siguiente sesión de diálisis, realizamos una BIS. A aquellos pacientes hiperhidratados e hipertensos, según MAPA, se les realizó un segundo MAPA para valorar cambios en los valores de TA.
ResultadosSegún MAPA, el 65% de pacientes presentaron una TA diurna >135/85 mmHg, 90% TA nocturna >120/70 mmHg y 76% TA promedio >130/80 mmHg. El 11% presentó un patrón dipper, 51% no dipper y 38% riser. Las TAS y TAD promedio fueron 4,7 mmHg (3,8%) y 1,1 mmHg (1,64%) más altas el segundo día. En el 6% de pacientes fue necesario bajar la dosis de antihipertensivos, 9% suspenderlos, 28% aumentar dosis y 17% añadir un nuevo fármaco. La TAD pre-HD es la que mejor concordancia presenta con el MAPA. Después de realizar BIS y ajustar PS hubo un descenso significativo en todas las cifras de TA. El análisis univariante mostró que la TAS promedio fue más alta en pacientes con baño alto en calcio, mayor cantidad de fármacos antihipertensivos y mayores dosis de eritropoyetina (EPO). El análisis multivariante mostró asociación significativa para EPO y número de fármacos (p < 0,01). La TAD promedio fue más alta en pacientes más jóvenes, con Charlson más bajos, menor índice de masa corporal (IMC), menos diuresis, no diabéticos y con mayores dosis de EPO. El estudio de regresión lineal mostró como variables significativas la edad (p < 0,005), IMC (p < 0,03) y EPO (p < 0,03).
ConclusionesNuestro estudio muestra: 1. La variabilidad de criterio de HTA, según utilicemos cifras de TA durante la sesión de HD o MAPA. 2. La variabilidad de TA en el periodo interdiálisis. 3. La TAD prediálisis es la que mejor concordancia presenta con el MAPA. 4. La utilización conjunta de la BIS y el MAPA mejora el control de la TA. 5. La dosis de EPO es el factor más importante asociado a la HTA en nuestros pacientes.
In hemodialysis HD patients Hypertension (HTN) is very frequent,1 it is associated with increased morbidity and mortality, and it is often difficult to diagnose.2,3
The prevalence of HTN in HD patients is between 70–88%,2,4–8 depending on the timing of the HD session where it is measured (pre-HD or post-HD) and whether it is a self measurement of arterial pressure (AMPA) is used or ambulatory blood pressure monitoring ABPM.1
There are two studies that investigate the prevalence of HTN in HD patients using the 44 -h ABPM; one from United States of 369 patients showing a prevalence of HTN of 82%6; a second study is an analysis of the EURECA registry ( European Cardiovascular and Renal Medicine ) including 396 patients and the prevalence was 84.3% (7).
In HD patients the blood pressure (BP) has certain characteristics that are not observed in other populations ; these are:
-
Large variations in the values of BP pre-HD and post-HD and from one day to the next, varying in relation to extracellular volume.9
-
Changes during the HD sessions, such as is the ultrafiltration rate,10 which depend on overhydration and residual diuresis of the patient that vary from one session to another.11
-
The technique used for measurement of BP may be inappropriate.12
-
Other factors also present in the rest of the population such as seasonal variations13 or the white coat effect.14
There are measures that may favor the BP control: different HD schemes,15 variations in sodium in the dialysis bath,16,17 diet,17 and an increase in the duration or frequency of the sessions.18
Despite the fact that ABPM could be the gold standard method for the diagnosis of hypertension in HD patients, there are only few studies of this type in HD patients.
The objectives of our work were: 1. To learn about the BP in the HD session. 2. Study BP, in the interdialytic period, using a 44-h ABPM. 3. To evaluate the concordance between BP values obtained in the HD session and ABPM. 4. Assess treatment changes after performing the ABPM. 5. Perform a BIS in all patients and in hyperhydrated and hypertensive patients, according to ABPM, assess changes in BP after adjusting the dry weight. 6. Know factors associated with SBP and DBP and the average MAP.
Material and methodsStudy populationThis is a rospective observational study in patients from our hemodialysis unit between 11/02/2016 and 07/03/2019. The clinical, demographic, dialysis and anemia data were extracted from the computerized medical records. The work was approved by the ethics committee of the hospital.
Inclusion criteriaStable patients over 18 years of age who have been on dialysis for more than three months, accepted to participate and signed the consent formed.
Exclusion criteriaThe exclusion criteria were: severe heart disease and / or intercurrent diseases in the month prior to the study, consumption of drugs, modification of the dry weight or antihypertensive drugs within the two weeks prior to the study inclusion, patient refusal to sign the informed consent, not able to communicate in Spanish, present cognitive deficit, incorrect ABPM registration and inability to perform BIS due to any of the following reasons: carrying defibrillators, pacemakers, stents, metallic suture material in the heart or main arteries or, metal prostheses.
Definition of hypertension and blood pressure measurementsHD sessionAll patients were dialysed three times weekly, using high-flux polysulfone dialyzers, a bath with 35 mEq/l bicarbonate and 138 milli-siemens/cm (mS/cm) sodium conductivity, 17 of them with online modality and the rest standard HD.
Blood pressures before and after the HD sessions were recorded in a Fresenius 5008 monitor for two weeks.
Pre-HD BP was obtained prior to puncturing the access or connecting the catheter, in the arm opposite to the fistula and after the patient has been in the supine position for 5 min. Post-HD after disconnecting the patient and stop the bleeding of the puncture sites in case of fistulas.
HTN was defined, according to the criteria of the 2005 KDOQI guidelines: pre-HD BP greater than 140/90 mmHg, post-HD BP of 130/80 mmHg or patients who need to use antihypertensive drugs.
ABPMThe device was used for ABPM measurements was the Custo Screen 300, validated by the ESH ( European Society of Hypertension, 2010). It was placed in the middle of the week, for 44 -h period. The measurements begin immediately after the end of the HD session and end prior to the beginning of the next session; measurements were scheduled every 30 min during the daytime period (06:00 to 22:00 h) and every hour at night (22:00 to 06:00 h). A valid record was considered one that included at least 36 h of monitoring, 60 records, and less than 10% of erroneous measurements.
Extrapolating the values from the general population, HTN was defined if BP values were > 135/85 mmHg at daytime, >120/70 mmHg nighttime, and mean BP > 130/80 mmHg.
To define whether a patient is a dipper or not, we use the decrease in the average SBP of the two nights collected, since this value that is most associated with the prognosis of HTN, being dipper those with a decrease of 10 to 20%, no dipper less than <10% and riser those that increase the SBP during the night.
To perform the second ABPM in hyperhydrated patients, we used the mean SBP values greater than 130 mmHg to define HTN, since SBP is the most associated with morbidity and mortality.
Bioimpedance measurementsBIS from Fresenius Medical Care (BCM®) was used for the assessment of body composition. The measurement was performed after the completion of ABPM, before starting the dialysis session.
It was considered volume dependent hypertension when in BCM patients had a overhydration greater than two liters, a criteria similar to what has been published by other authors (Vega et al.), in the study of overhydration in dialysis patients.19
Variables analyzed in relation to BPPatient-related variablesAge, sex, BMI, diabetes mellitus (DM), time on hemodialysis (months), residual diuresis and Charlson comorbidity index (without age), number of antihypertensive drugs.
Variables related to dialysisCalcium content in the bath (2.5 vs. 3 mEq/l), ultrafiltration rate (ml/h) and interdialysis weight gain and type of vascular access (tunnelled catheter, native fistula, prosthetic fistula).
Measurements of Anemia parametersWe obtained the mean hemoglobin level from the last three months (g/dL) prior to the ABPM, the resistance index of erythropoietin (weekly dose of erythropoietin/weight/hemoglobin) and the average dose of erythropoietin during the last six sessions expressed as: IU/kg/week.
Statistical analysisQuantitative variables are presented as mean and standard deviation or median and interquartile range, according to the distribution of values. The distribution of qualitative variables is presented as absolute and relative frequencies.
To evaluate the concordance between the techniques of BP measurement, the intraclass correlation coefficient was estimated by means of a mixed effects model and considering absolute concordance. A value <0.3 is interpreted as bad or null, a value between 0.31 and 0.50 as poor, a value between 0.51 and 0.70 as moderate, a value between 0.71 and 0.90 as good and > 0.90, very good.
The change in BP values, before and after bioimpedance (BIA) were analyzed by the Wilcoxon test, a non-parametric hypothesis test for repeated measures.
To analyze factors associated with the values of BP, a univariate analysis was performed comparing the distribution of BP values by groups using the Student's t test or one factor analysis of variance, in the case of centered and approximately normal variables; otherwise we used non-parametric tests, the Mann–Whitney U test or the Kruskal-Wallis test. In the case of qualitative variables, we used Pearson's χ 2 test, Fisher's exact test. Subsequently, a multivariate linear regression model was adjusted including the statistically significant and / or clinically relevant variables.
All tests are considered bilateral with p-values less than 0.05 as statistically significant.
SPSS 17 software was used for statistical analysis.
ResultsGeneral characteristicsBetween February 2016 and March 2019, there were 150 patients recruited to perform a 44 -h ABPM, however 12 patients refused to undergo the ABPM, 35 presented exclusion criteria, three presented insufficient measurements, leaving 100 patients to be analyzed.
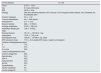
The clinical and demographic characteristics and the data from the dialysis sessions, anemia and treatment are shown in Table 1.
Clinical characteristics of the patients (Mean +/− SD).
| Clinical features | N = 100 |
|---|---|
| Years | 61.87 +/− 14.47 |
| Sex | 61 males 39 females |
| BMI | 26.30 +/− 4.69 |
| Etiology | DM: 34%; Glomerulonephritis: 15%; Vascular: 12%; Polycystic kidney disease: 10%; Interstitial: 6%; Not affiliated: 23% |
| Charlson (ageless) | 3.9 +/− 1.84 |
| Time on hemodialysis | 49 +/− 2.46 months |
| Standard KTV | 2.17 +/− 0.31 |
| Session duration | 222 +/− 17.58 min |
| Average ultrafiltration | 2136 +/− 788.4 mL |
| Interdialytic Weight gain (kgs) | 1.88 +/− 0.83 kg |
| Residual diuresis | 781.15 +/− 705.76 mL / day |
| Hemoglobin | 12.33 +/− 7.42 g / dL |
| Erythropoietin dose | 128.32 +/− 127.58 IU / kg / week |
| EPO resistance index | 7.72 +/− 6.04 weekly EPO doses / weight / g hemoglobin |
| Number of antihypertensive drugs: | |
| 0 | 11% |
| 1-2 | 37% |
| 3 or more | 52% |
| Types of antihypertensive used: | |
| Calcium antagonists | 65% |
| Beta blockers | 54% |
| ARA II | 42% |
| Alpha blockers | 27% |
| IECAS | 24% |
| Sympatholytics | 4% |
| Arterial vasodilator | 3% |
| Central antagonist | 1% |
All patients had been on hemodialysis for more than three months, had three weekly sessions with an average duration of 222 min +/−17.58 per session and with average weight gains between sessions of 1.88 +/− 0.83 kg, 60 of them presented residual diuresis (>250 mL/24 h), 51% had native fistulas, 12% with prosthetics fistulas, and 37% had tunnelled catheter.
BP during the hemodialysis sessionThe pre-HD mean SBP and DBP were 146.98 +/− 15.37 and 69.92 +/− 12.61 mmHg. The mean SBP and DBP post-HD were: 140.3 +/− 17.31 and 70.64 +/− 10.88 mmHg. Table 2 shows the percentage of patients that were hypertensive pre-HD and post-HD.
BP by ABPMThe mean duration of the ABPM was 43.57 +/− 5.76 h, and the mean number of measurements was 74.66 +/− 8.
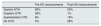
The daytime SBP and DBP means were: 140.95 +/− 18.5 and 81.64 +/− 11 mmHg, the nighttime means were 139 +/− 21.97 and 78.2 +/− 12.61 mmHg and the average BP: 140 +/− 19.29 and 80.12 +/− 11.31 mmHg. 65% had a daytime BP > 135/8 5 mmHg, 90 % had a nighttime BP > 120/70 mmHg, and 76% had an average BP > 130/80 mmHg (Table 3).
The mean SBP and DBP were 4.7 mmHg (3.8%) and 1.1 mmHg (1.64%) higher on the second day of ABPM
Only 11% of the studied population presented a dipper pattern, 51% were non- dipper and 38% were riser.
Concordance between tensions of the sessions and the ABPMTable 4 shows that the concordance between the SBP pre-HD and SBP from ABPM are moderate, while that between the post-HD SBP and those obtained by ABPM are poor.
Concordance between systolic blood pressures in the the hemodialysis sessions and the ABPM.
| Dialysis | ABPM | Systolic Blood Pressure | |
|---|---|---|---|
| Intraclass correlation coefficient | Interpretation | ||
| Pre | Daytime | 0.605 [0.465–0.716] | Moderate |
| Post | Daytime | 0.480 [0.313–0.617] | Poor |
| Pre | Nocturnal | 0.596 [0.453–0.709] | Moderate |
| Post | Nocturnal | 0.455 [0.285–0.5 97] | Poor |
| Pre | Average | 0.616 [0.478–0.724] | Moderate |
| Post | Average | 0.484 [0.319–0.621] | Poor |
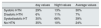
Table 5 shows a good concordance between pre HD DBP and the daytime and average ABPM. And moderate for nocturnal ABPM, while those between the post-HD DBP and the values from ABPM are moderate.
Concordance between diastolic blood pressures of the sessions and the ABPM.
| Dialysis | ABPM | [0.3-4] Diastolic blood pressure | |
|---|---|---|---|
| Intraclass correlation coefficient | Interpretation | ||
| Pre | Daytime | 0.744 [0.642-0.820] | Good |
| Post | Daytime | 0.649 [0.520-0.750] | Moderate |
| Pre | Nocturnal | 0.696 [0.579-0.785] | Moderate |
| Post | Nocturnal | 0.599 [0.457-0.711] | Moderate |
| Pre | Average | 0.743 [0.641-0.820] | Good |
| Post | Average | 0.640 [0.508-0.742] | Moderate |
The SBP post-HD is the one with the worst concordance with the values of ABPM. By contrast, the DBP pre-HD is the one with the best agreement.
Antihypertensive drugs and ABPMTable 1 shows the distribution of antihypertensive drugs.
A 89% of the patients received at least one antihypertensive drug, 52% received three or more. The most widely used was calcium antagonists in a 65% of the patients.
After evaluating the results of the ABPM measurements; 6% needed a reduction in the dose of drugs, 28% required an increase, 9% the medication had to be discontinued, and in 17% need to add a new one.
Hyperhydration and BISAfter performing the bioimpedances, 61 % of patients did not need adjustment, in 32% the dry weight was lowered and in 7% it was increased.
There were 32 patients who were hyperhydrated, six of them had normal BP according to the average SBP of the ABPM. Of the remaining 26 (hyperhydrated and hypertensive, according to the average SBP of the ABPM ≥ 130 mmHg): four could not have the dry weight lowered their due to hemodynamic intolerance, four refused to have the ABPM repeated and four required hospital admissions, finally remaining 14 hyperhydrated and hypertensive patients who were able to lower their Dry weight and perform a second ABPM and BIS.
Table 6 shows the patients whose dry weight was reduced, observing a statistically significant decrease in all values of blood pressure; the nocturnal DBP had the greatest decrease: 10.36% (+/−9.94) and the average DBP showed the smallest decrease: 7.04% (+/−7.97).
Changes in BP after dry weight adjustments.
| Daytime TAS | Daytime TAD | NighttimeTAS | Nighttime TAD | Average TAS | Average TAD | |
|---|---|---|---|---|---|---|
| ABPM 1 (mmHg) | 149.86 +/− 15.68 | 86.07 +/− 13.21 | 144.86 +/− 20.21 | 81.57 +/− 16, 52 | 148.57 +/− 16.03 | 84.64 +/− 13.99 |
| ABPM 2 (mmHg) | 137.14 +/− 15.36 | 79.29 +/− 9.78 | 129.14 +/− 12.01 | 71.93 +/− 9.26 | 135.71 +/− 12.38 | 77.93 +/− 8.88 |
| Percent decline (%) | 8.12 +/− 9.82 | 7.25 +/− 7.77 | 9.67 +/− 11.86 | 10.36 +/− 9.94 | 8.13 +/− 9.22 | 7.04 +/− 7.97 |
| P | 0. 007 | 0.005 | 0.011 | 0.003 | 0.006 | 0.005 |
The changes in parameter between the first and second bioimpedances were all significant, except for the ICW (Table 7).
Variation of the parameters between the first and second bioimpedance.
| OH2-OH1 | ECW2-ECW1 | TBW2-TBW1 | ICW2-ICW1 | E/I2- E/I1 | |
|---|---|---|---|---|---|
| Difference (L) | −3.182 | −3.190 | −2.098 | −0.535 | −2.841 |
| P value | 0.001 | 0.001 | 0.036 | 0.593 | 0.005 |
OH: Overhydration. ECW: Extracellular water. TBW: Total body water. ICW: intracellular water. E/I: Ratio: extracellular water/intracellular water.
Gender: Women 143.59 +/− 19.20 vs. 137.82 +/− 19.17 mmHg in men (P: 0.14).
Diabetes: Non-diabetic 138.12 +/− 19 vs. diabetics 142.10 +/− 19.49 mmHg in diabetics (P: 0.30).
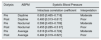
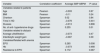
Antihypertensive drugs: There was a significant positive correlation between the number of drugs and SBP (Table 8).
Quantitative variables and their relationship with average SBP according to ABPM.
| Variable | Correlation coefficient | Average SBP ABPM | P value |
|---|---|---|---|
| Variables related to patients | |||
| Age | Pearson | −0.003 | 0.97 |
| BMI | Pearson | −0.11 | 0.24 |
| Charlson | Spearman | 0.02 | 0.84 |
| Time in HD | Spearman | −0.078 | 0.441 |
| Diuresis | Spearman | −0.013 | 0.896 |
| No. of anti- hypertensive drugs | Spearman | 0.255 | 0.01 |
| Variables related to dialysis | |||
| Average ultrafiltration | Spearman | −0.073 | 0.47 |
| Interdialytic weight gain | Spearman | −0.087 | 0.39 |
| VariablesrRelated with anemia | |||
| EPO | Spearman | 0.265 | 0.008 |
| Hb | Spearman | −0.073 | 0.468 |
| Resistance to EPO | Spearman | 0.172 | 0.087 |
The rest of the patients related variables are shown in Table 8.
Variables related to dialysis:BathCalcium: Calcium 3 mEq/L 143,78 +/− 19 mmHg vs. calcium of 2.5 mEq/L 136.36 +/− 19 mmHg (P: 0.050).
Vascular access: Patients with tunneled catheters 141.78 +/− 19.21 mmHg, native fistulas 137.67 +/− 18.70 mm / Hg and prosthetic fistulas 145 +/− 22.10 mmHg (P: 0.397).
The rest of the dialysis related variables are shown in Table 8.
Variables related to anemiaThere is a modest but significant positive correlation between the doses of EPO and the average SBP. No significant correlations were observed between average SBP and hemoglobin level or the EPO resistance index (Table 8).
Linear regression analysis confirmed that the variables with a significant correlation with SBP were EPO (p < 0.01) and the number of antihypertensive drugs (p < 0.01).
Average DBPPatient-related variables:Gender: The values of average DBP in Women and men were 82.38 +/− 10.64 and in men 78.67 +/− 11.57 mmHg respectively (P: 0.11).
Diabetes: The average DBP were: Non-diabetic 82.9 +/− 10.88 and diabetics 77.22 +/− 11.13 mmHg (P: 0.011).
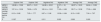
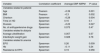
Age, BMI, Charlson comorbidity index, and urine output showed a significant negative correlation with the average DBP.
The rest of the patients related variables are shown in Table 9.
Quantitative variables and their relationship with average DBP according to ABPM.
| Variable | Correlation coefficient | Average DBP ABPM | P value |
|---|---|---|---|
| Variables related to patients | |||
| Age | Pearson | −0.39 | 0.001 |
| BMI | Pearson | −0.3 | 0.002 |
| Charlson | Spearman | −0.28 | 0.004 |
| Time on HD | Spearman | 0.16 | 0.1 |
| Diuresis | Spearman | −0.22 | 0.027 |
| No. of antihypertensive drugs | Spearman | 0.073 | 0.47 |
| Variables related to dialysis | |||
| Average ultrafiltration | Spearman | 0.057 | 0.57 |
| Interdialytic weight gain | Spearman | 0.028 | 0.78 |
| Variables related to anemia | |||
| EPO | Spearman | 0.26 | 0.009 |
| Hb | Spearman | −0.11 | 0.24 |
| Resistance to EPO | Spearman | 0.19 | 0.056 |
Bath calcium: with a Calcium of 3 mEq / L: 81.22 +/− 11.58 mmHg; with a Calcium of 2.5 mEq / L: 79.02 +/− 11.048 mm (P: 0.33).
Vascular access: Patients with tunnelled catheters 79.97 +/− 11.02 mmHg, native AV fistulas: 80.29 +/− 11.40 mmHg and prosthetic fistulas 79.83 +/− 12.75 mmHg (P = 0. 98).
The rest of the variables related to dialysis are shown in Table 9.
Variables related to anemia:As shown in Table 9, the EPO dose showed a modest but significant positive correlation with the average DBP. However there is no significant correlation between average DBP and hemoglobin level or the EPO resistance index.
The linear regression analysis adjusted for all significant variables in the univariate study showed age (p < 0.005), BMI (p < 0.03), and EPO (p < 0.03) as significant variables associated with average DBP.
DiscussionThe prevalence of HTN in kidney patients is very high.2,4–8 There is also a large variability of BP values among these patients. Most of them, except for a minority of 5–15%, present a decrease in BP at the end of the dialysis sessions, on the contrary, during the interdialysis period the majority of patients show a progressive increase in BP.11,20 For these reasons, many authors suggest that in HD patients the ABPM would be the method gold standard for diagnosis of hypertension.1,21 However, very few studies have been conducted on ABPM in HD patients.
Our study shows the great variability of BP in these patients. If we consider as a reference the values of BP during the HD session, all patients meet some criteria for HTN at some point (Table 2). If we rely on 44 h -ABPM, 65% of patients are hypertensive in the daytime measurement, 90% in the nighttime, and 76% considering average BP (Table 3). Other data of interest is the high percentage of patients with nocturnal pathological pattern: 51% non- dipper and 38% riser, data similar to other publications.7,22 This pattern is associated with left ventricular hypertrophy and cardiovascular and all-cause morbidity and mortality, and target organ damage. Therefore it is important to be aware of its presence and try to reverse it.22–27 These diagnostic and prognostic problems that arise with measurements during the sessions have led to the publication of two documents, one from the American Society of Hypertension and the American Society of Nephrology 1 ; and the other from the EURECA ( European Cardiovascular and Renal Medicine ) group of the European Renal Association and European Dialysis and Transplantation Society (ERA-EDTA). These documents suggest using the 44 -h ABPM for the diagnosis and management of hypertension in patients on dialysis.25
However, in daily clinical practice, as well as in epidemiological studies of hypertension in hemodialysis patients, the measurements of BP are obtained in the dialysis units, although these values do not reflect what happened in the interdialytic period, and furthermore, their accuracy it has not been well established.13,28,29 It is important to know, to what extent the BP measurements made during the HD session correspond to the BP values obtained by ABPM. There are studies that found a poor concordance between the BP values collected in the HD sessions and those from ABPM.14,28,29 Other studies found that pre-HD BP would be most important,30 and others suggest to use post-HD measurements,31 whereas others suggest to use the combination of both32 and there are also authors that suggest to obtain the values of BP 20 min after the end of the sessions.33 In our work, the SBP pre-HD has a moderate agreement with values of SBP by ABPM, while the DBP pre-HD shows good agreement with average and daytime measurements by ABPM and moderate with measurement at night which coincide with the observations by Conlon et al.,30 while the post-HD SBP shows a poor correlation with the ABPM and the post-HD DBP shows a moderate concordance. In summary, our study shows that predialysis DBP shows the best agreement with ABPM.
The use of BIS for fluid management in HD patients is a useful tool for adjusting dry weight and blood volume and, therefore, for the management of BP.34 Observational studies show that the reduction in blood volume is associated with a decrease in BP in a 70 to 90% of cases.6,35,36 Based on these data, in our work, when reducing dry weight by 32% of hyperhydrated and hypertensive patients, there was a significant decrease in all BP parameters obtained by ABPM, and the nocturnal DBP showed the greatest decrease (10.36%) (Table 6) and in all the BIS parameters, except the ICW. This is due to the fact that the latter is not modified by dialysis, during which we extract an ultrafiltrate from the plasma, which is extracellular water; intracellular water is mainly in muscle and is not extracted.
In our study we have also analyzed the variables related with the average ABPM.Using a univariate analysis the average SBP was higher in patients with higher calcium the bath, more antihypertensive drugs and higher doses of EPO; in the regression analysis the number of antihypertensives drugs and the dose of epo remains significant.
With respect to the average DBP, the univariate analysis shows a significantly higher DBP in younger patients, with less diuresis, lower Charlson, lower BMI, no DM and higher doses of EPO. The regression analysis confirms that the patient's age, BMI and EPO are the variables associated with a higher DBP. Let's analyze these variables:
-
Antihypertensive drugs: Our study shows that the greater the number of antihypertensive drugs, the higher the average SBP, but not the DBP. Agarwal et al.6 showed an association between greater use of antihypertensive drugs and the lack of control of mean BP by BPM and post-HD BP measurements. This association probably shows poor BP control, and as a consequence, the physician doctor increases the number of antihypertensive drugs.
-
Age: In our study, the older age is associated with lower the DBP. This lower DBP could be explained by the fact that aging causes a reduction in peripheral resistances, as indicated by the work of Protogerou et al.37
-
Calcium in the bath: The effect of the calcium concentration in the bath on BP would be mainly due to changes in myocardial contractility and vascular reactivity.38,39 In our work we observed that the mean SBP was 7.4 mmHg higher in patients with a calcium bath of 3 mEq / l. Although there are studies published showing lower intradialysis tensions with lower calcium in the bath,40,41 we have not found studies evaluating the relationship of the bath calcium concentration and the BP values by ABPM.
-
Residual diuresis: This would decrease interdialysis weight gain and extracellular fluid volume, it would be associated with a better correction of anemia and a decrease in erythropoietin consumption and lower levels of inflammatory cytokines.42–44 However, we did not find studies in the literature that analyze ABPM parameters and residual diuresis. In our study, the DBP were lower in those patients with more residual diuresis, probably due to better control of extracellular volume.
-
Dose of EPO: HTN is a known side effect of the administration of EPO. We have observed a significant relationship between the dose of EPO and both the average SBP and DBP. There are several studies that observed a significant correlation between doses of EPO and BP; Agarwal et al study showed, that the EPO dose was associated with a higher prevalence of HTN regardless of how was measured, pre, post or interdialytic.6 Liu et al., in his work with 90 HD patients, observed an association between high doses of EPO and more adverse circadian rhythm.22
DM: HT is frequent in diabetic patients and is believed to be due to the impact of insulin resistance on the kidney and the vascular tree.45–47 In our work, the DBP was lower in diabetic patients. This finding is similar to a study by Franklin et al. who obtained data from the NHANES cross-sectional study of 19,808 people (general US population and not specifically kidney patients), demonstrating that age, female gender and diabetes were independently associated with lower DBP in treated patients and not treated..48
BMI: In our work we found that the average DBP obtained by ABPM was higher in patients with lower BMI. In the work of Agarwal,6 a lower BMI was an independent factor for the prevalence of HTN measured by ABPM and a factor associated with a lack of BP control, based on pre-HD values of BP.
The design of our study has weaknesses such as: not being able to evaluate the morbidity and mortality of the patients and not having a greater number of hyperhydrated and hypertensive patients to have more significant data. On the contrary, among the strengths of this study is that there are few studies in the group of patients on hemodialysis using ABPM and BIS together.
In conclusion, our study shows: 1. The variability of HTN criteria, depending on whether it is used values of BP during the HD session or at different day periods of ABPM. 2. The variability of BP in the interdialysis period. 3. The best degree of concordance between the BP in the HD sessions and the ABPM corresponds to the pre-HD TAD. 4. The joint use of the BIS and the ABPM improves the control of BP. 5. The dose of EPO is the most important factor associated with HTN in our patients.
FundingThe authors declare that this article did not receive funding from any type of public or private entity.
Conflicts of interestThe authors have no conflicts of interest to declare.
Please cite this article as: Furaz Czerpak K, Gruss Vergara E, Barril Cuadrado G, Pérez Fernández E, Benavides N, de la Flor J, Mendez Á, Martín R. Utilidad del MAPA y bioimpedancia para el tratamiento y control de la HTA en pacientes en hemodiálisis crónica. Nefrologia. 2021;41:17–26.