


In some studies, the peritoneal solute transfer rate (PSTR) through the peritoneal membrane has been related to an increased risk of mortality. It has been observed in the literature that those patients with rapid diffusion of solutes through the peritoneal membrane (high/fast transfer) and probably those with high average transfer characterized by the Peritoneal Equilibrium Test (PET) are associated with higher mortality compared to those patients who have a slow transfer rate. However, some authors have not documented this fact. In the present study, we want to evaluate the (etiological) relationship between the characteristics of peritoneal membrane transfer and mortality and survival of the technique in an incident population on peritoneal dialysis in RTS Colombia during the years 2007–2017 using a competing risk model.
Materials and methodsA retrospective cohort study was carried out at RTS Colombia in the period between 2007 and 2017. In total, there were 8170 incident patients older than 18 years, who had a Peritoneal Equilibration Test (PET) between 28 and 180 days from the start of therapy. Demographic, clinical, and laboratory variables were evaluated. The (etiological) relationship between the type of peritoneal solute transfer rate at the start of therapy and overall mortality and technique survival were analyzed using a competing risk model (cause-specific proportional hazard model described by Royston-Lambert).
ResultsPatients were classified into four categories based on the PET result: Slow/Low transfer (16.0%), low average (35.4%), high average (32.9%), and High/Fast transfer (15.7%). During follow-up, with a median of 730 days, 3025 (37.02%) patients died, 1079 (13.2%) were transferred to hemodialysis and 661 (8.1%) were transplanted. In the analysis of competing risks, adjusted for age, sex, presence of DM, HTA, body mass index, residual function, albumin, hemoglobin, phosphorus, and modality of PD at the start of therapy, we found cause-specific HR (HRce) for high/fast transfer was 1.13 (95% CI 0.98–1.30) p = 0.078, high average 1.08 (95% CI 0.96–1.22) p = 0.195, low average 1.09 (95% CI 0.96–1.22) p = 0.156 compared to the low/slow transfer rate. For technique survival, cause-specific HR for high/rapid transfer of 1.22 (95% CI 0.98–1.52) p = 0.66, high average HR was 1.10 (95% CI 0.91–1.33) p = 0.296, low average HR of 1.03 (95% CI 0.85–1.24) p = 0.733 compared with the low/slow transfer rate, adjusted for age, sex, DM, HTA, BMI, residual renal function, albumin, phosphorus, hemoglobin, and PD modality at start of therapy. Non-significant differences.
ConclusionsWhen evaluating the etiological relationship between the type of peritoneal solute transfer rate and overall mortality and survival of the technique using a competing risk model, we found no etiological relationship between the characteristics of peritoneal membrane transfer according to the classification given by Twardowski assessed at the start of peritoneal dialysis therapy and overall mortality or technique survival in adjusted models. The analysis will then be made from the prognostic model with the purpose of predicting the risk of mortality and survival of the technique using the risk subdistribution model (Fine & Gray).
La tasa de transferencia de moléculas pequeñas (PSTR) a través de la membrana peritoneal ha sido relacionado con un aumento en el riesgo de mortalidad en algunos estudios. Se ha observado en la literatura que aquellos pacientes con rápida difusión de solutos a través de la membrana peritoneal (transferencia alta/rápida) y probablemente aquellos con transferencia promedio alto caracterizado en la Prueba de Equilibrio Peritoneal (PET) se asocian a una mayor mortalidad comparado con aquellos pacientes quienes tienen transferencia lenta. Sin embargo, algunos autores no han documentado este hecho. En el presente estudio queremos evaluar la relación (etiológica) entre las características de transferencia de la membrana peritoneal y mortalidad y supervivencia de la técnica en una población incidente en diálisis peritoneal en RTS Colombia durante los años 2007 a 2017 utilizando un modelo de riesgos competitivos.
Materiales y métodosSe realizó un estudio de cohortes retrospectivo en RTS Colombia en el período comprendido entre los años 2007 y 2017. En total fueron 8170 pacientes incidentes mayores de 18 años, quienes tenían una prueba de equilibrio peritoneal (PET) entre los 28 y 180 días de inicio de terapia. Se evaluaron variables demográficas, clínicas y de laboratorio. Se analizó la relación (etiológica) entre el tipo de transferencia de la membrana peritoneal al inicio de la terapia y mortalidad global y la supervivencia de la técnica utilizando un modelo de riesgos competitivos (modelo de riesgo proporcional causa específico descrito por Royston-Lambert).
ResultadosLos pacientes se clasificaron en cuatro categorías según el resultado del PET: transferencia Lento/Bajo (16,0%), promedio bajo (35,4%), promedio alto (32,9%) y transferencia Alta/Rápido (15.7%). Durante el seguimiento, mediana de 730 días, fallecieron 3025 (37,02%) pacientes, 1.079 (13,2%) fueron transferidos a hemodiálisis (HD) y 661 (8,1%) fueron trasplantados. En el análisis de riesgos competitivos, ajustado por edad, sexo, presencia de DM, HTA, índice de masa corporal, función residual al inicio de la terapia, albúmina, hemoglobina, fósforo y terapia de inicio encontramos que el HR causa específico (HRce) para transferencia alto/rápido fue de 1,13 (IC 95% 0,98-1,30) p = 0,078, promedio alto 1,08 (IC 95% 0,96-1,22) p = 0,195, promedio bajo 1,09 (IC 95% 0,96-1,22) p = 0,156 comparados con el tipo de transferencia bajo. Para la supervivencia de la técnica, el HR causa-específico para transferencia alto/rápido de 1,22 (IC 95% 0,98-1,52) p = 0,66, promedio alto el HR fue de 1,10 (IC 95% 0,91-1,33) p = 0,296, promedio bajo HR de 1,03 (IC 95% 0,85-1,24) p = 0,733 comparados con el tipo de transferencia bajo/lento, ajustado por edad, sexo, DM, HTA, IMC, función renal residual, albúmina, fósforo, hemoglobina y terapia de inicio. Diferencias no significativas.
ConclusionesAl evaluar la relación etiológica entre el tipo de transferencia de membrana peritoneal y mortalidad global y supervivencia de la técnica utilizando un modelo de riesgos competitivos, no encontramos relación etiológica entre las características de transferencia de la membrana peritoneal de acuerdo con la clasificación dada por Twardowski evaluada al inicio de la terapia de diálisis peritoneal y la mortalidad global o en la supervivencia de la técnica en los modelos ajustados. Se hará posteriormente el análisis desde el modelo pronostico con el propósito de predecir el riesgo de mortalidad y sobrevida de la técnica utilizando el modelo de subdistribución de riesgos (Fine & Gray).
Characterizing the peritoneal membrane small solute transfer rate (PSTR) through the peritoneal equilibration test (PET) has been the traditional method of assessing solute passage and permeability of the peritoneal membrane since Twardowski described this method in 1987.1
Several authors have related the status or PSTR by with differences in mortality among patients on peritoneal dialysis, with high (fast) PSTR associated with a higher risk of mortality.2
High (fast) PSTR is associated with a functional or structural alteration, an increase in effective peritoneal membrane surface area and/or increase in permeability, in which effective ultrafiltration (UF) capacity is rapidly lost by dissipation of the osmotic gradient of glucose, causing low UF with, in many cases, the development of water overload and excess glucose exposure. This characteristic can be observed from the beginning of therapy, but chronic exposure to high concentrations of glucose, time on dialysis, hyperosmolarity, pH of peritoneal dialysis solutions and episodes of peritonitis may predispose patients to developing this type of transfer over time.
This rapid transfer status correlates with improved solute clearance across the peritoneal membrane, easily achieving minimal solute clearance goals; however, paradoxically, several studies have found an association between this type of peritoneal membrane transfer and increased morbidity and mortality, even independently of residual renal function.3 Other authors have found that patient survival and technique would be related to having a high solute PSTR at the start of therapy.4–10
The low UF and hypoalbuminemia found in these patients would be associated with excessive protein loss to the peritoneal fluid, in addition to the hemodilution effect, resulting in hypervolemia, malnutrition and increased mortality.
Contrary to these findings other authors have reported that peritoneal membrane transfer type status does not increase the risk of mortality.11–16
The evidence presented in the most representative articles of the last years has not been conclusive in demonstrating whether PSTR evaluated with PET in incident patients really has a direct and clear relationship with patient mortality at least during the first year of therapy. It is likely that some studies would not have had enough patients to achieve statistical utility. In addition, the survival analyses used models that did not consider competing risks, and in some cases the effects may have been overestimated.
In the present study we evaluate the etiological relationship between peritoneal membrane transfer characteristics and mortality and technique survival in an incident population on peritoneal dialysis in renal therapy services (RTS) Colombia during the years 2007–2017 using a competing risks model.
Materials and methodsWe conducted a retrospective cohort study based on routine data from electronic medical records (RENIR® [Servinte, Grupo Carvajal, Cali, Colombia] and VERSIA® [Baxter, Spain]) of RTS Colombia during the period from January 1, 2007, to December 31, 2017. Follow-up was done until December 31, 2018. The total population of incident peritoneal dialysis patients in renal units (42 centers distributed throughout the country) was evaluated. Data analyzed was takenonly from the first PET test.
In total, we had 17,203 incident patients on peritoneal dialysis in the database, of which 16,822 patients were older than 18 years; 11,409 patients recorded data from at least one PET (5413 patients without PET data at some point), duplicate data were eliminated (1386) and, subsequently, all patients with a first PET performed before 28 days of therapy initiation and 180 days after therapy initiation were removed (1853 data), in total we had a population of 8170 patients with an equal number of PETs for survival analysis and for characterization of the type of peritoneal membrane transfer (Fig. 1).

The test was performed according to the protocol initially described by Twardowski, using two-liter solutions with 2.27% glucose (Dianeal® 2.5% Baxter Healthcare, Cali, Colombia), according to RTS Colombia protocol for all renal units. A correction factor was used in the required cases. The procedure was the same for all renal units.
To classify the groups we used the average creatinine d/p at hour 4 of PET ± 1 standard deviation (±1 SD), according to Twardowski's description. In this cohort, the exposed group was defined as those with high PSTR, per PET, and the unexposed group as those with any of the other three types of PSTR. In each group we evaluated the mortality and survival of the technique. In addition, we estimated the effects that other exposures could have at the beginning of therapy, such as having residual renal function, assignment of type of peritoneal dialysis therapy, history of DM, HTN, we calculated the incidence rates of the dependent variable (mortality) both in the exposed population (high PSTR) and in the non-exposed population (low, low average and high average PSTR).
All patients started peritoneal dialysis management with Dianeal solutions®; very few patients had access to icodextrin during follow-up.
Inclusion criteria:
- □
Patients over 18 years old.
- □
Incident patients on peritoneal dialysis therapy, and those who have a PET scan performed between day 28 and day 180 of therapy.
- □
Only those patients with creatinine d/p range at hour 4 PET between 0.30–1.15 were included.
Exclusion criteria:
- □
Patients with incomplete PET results or with transcription errors in their results.
- □
Patients admitted to peritoneal dialysis therapy for non-renal indications.
Sample size calculation: If we were to calculate a sample size with a confidence level of 95% (type I error of 0.05) and a power of 80% (type II error of 0.20), with a mortality probability of 18% in the group with high transport vs. 13% in the other types of transport, ratio of exposed vs. not exposed of 6.25, assuming a hazard ratio (HR) of 1.34, we would obtain an estimated population of 3121 patients (Epi-info™, version 7.2.2.6, Centers for Disease Control and Prevention, Atlanta, GA, USA). We can also apply the following formula designed to calculate sample size in censored survival analysis,17 which gives a similar sample size.
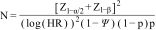
In our case: Z1-α/2 is 1.96, with a confidence level of 95%
Z1-β is 0. 842, power of 80%, type 2 error of 0.2
HR: 1.34
□% mortality censorship: 20%
p: 16%, exposed group, fast transport
This formula gives a sample size of 4516 patients.
Statistical analysisExploratory data analysis of demographic, clinical, laboratory variables, types of peritoneal dialysis therapy, measures of central tendency, dispersion, 95% confidence intervals (CI), absolute and relative frequencies for quantitative variables. The Shapiro–Wilk test was used to define whether the variables have normal distribution. Medians and interquartile ranges (IQR) were calculated if the data did not fit a normal distribution.
Bivariate analysis. The null hypothesis (H = 0) defines that there is no difference in mortality in the different groups. For technique survival, the null hypothesis (H = 0) defines that there is no difference in technique survival between the different peritoneal membrane transfer groups. The χ2, t-test was used to compare proportions.
For the analysis of overall patient survival, technique survival and its relationship with the type of transfer (etiological relationship) we found that the survival estimation given by the Kaplan–Meier (KM) model and the HR estimation by the Cox proportional hazards model is not the most appropriate, since we found that there are competing risks for overall mortality and for the technique survival outcome.
The competing events for overall mortality are recovery of renal function and renal transplantation.
For technique survival, the competing events are recovery of renal function, death and renal transplantation. Survival of the peritoneal dialysis technique was defined as transition to HD therapy for more than 90 days.
A flexible parametric survival model for competing risks with cause-specific HR calculation (HRce) was used, since the research question is related to etiology (effect estimation) rather than prognosis (risk estimation).18–27
Multiple analysis: a parametric flexible regression model was estimated for competing risks, considering the covariables that were significant in the bivariate analysis with a p value of less than 0.2 to be considered in the adjusted model. Adjustment was made for confounding variables such as age, sex, etiology of renal disease. The statistical program Stata 17 (StataCorp LLC, Lakeway Drive College Station, Texas, USA) was used.
EthicsThis is a retrospective, descriptive cohort study, and in accordance with the regulations issued by the Ministry of Health, through resolution 008430 of 1993 of the Republic of Colombia, in title II, chapter 1, article 11, it is no-risk research, in which no manipulation is performed on the biological, psychological or social variables of the patients and, therefore, does not require informed consent, nor does it have the ethical implications of research in humans. However, we consider that there is minimal risk and we adhere to CIOMS 2016, guideline 4. All patients admitted to dialysis therapy in RTS units gave informed consent for their therapy, for sending data to their insurance companies and use of their information for clinical studies.
The study was endorsed by the RTS Ethics and Research Committee report N° 26 of February 5, 2019, and report 002-019 of the Institutional Human Ethics Review Committee of the Universidad del Valle of March 12, 2019.
ResultsOf the 8170 PETs in the study, the mean d/p creatinine at hour 4 PET was found to be 0.642 with a SD of 0.130. High PSTR was defined as those with hour 4 PET creatinine d/p greater than 0.772 (>average plus 1 SD), high average those with hour 4 PET creatinine d/p between 0.642−0.772 (between average plus 1 SD), low average d/p between 0.511−0.642 (between average and −1 SD) and low those with hour 4 PET creatinine d/p less than 0.511 (less than average −1 SD).
Some 15.70% were classified in the fast (high) group, 32.85% in high average, 35.41% in low average, (66.26% high and low average) and 16.03% were slow (low) (Table 1).
Classification of peritoneal membrane transfer types. Incident patients on peritoneal dialysis therapy 2007–2017 RTS Colombia.
| Type of transfer | Value | Population (n = 8170) | Percentage |
|---|---|---|---|
| Low (slow) | <0.511 | 1.310 | 16.03 |
| Low average | 0.511−0.642 | 2.893 | 35.41 |
| High average | 0.642−0.772 | 2.684 | 32.85 |
| High (fast) | >0.772 | 1.283 | 15.7 |
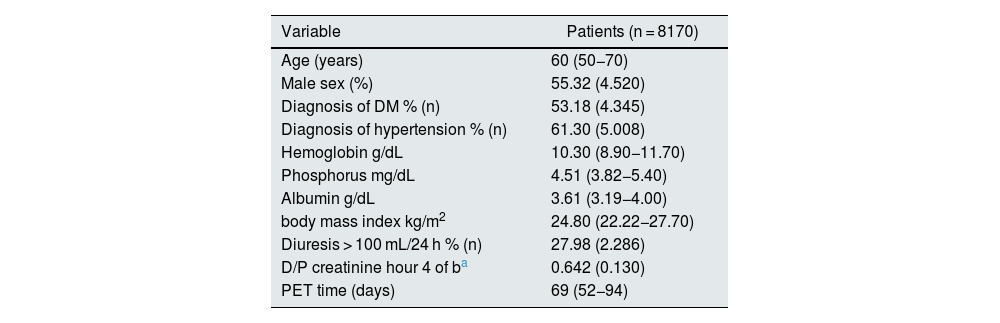
Of the 8170 included in the analysis, 4520 were male (55.32%), median age 60 (RIC 50−70), 53.18% had a diagnosis of diabetes mellitus (DM), median time to PET was 69 days (RIC 52−94), 61.30% had a diagnosis of arterial hypertension (HTN), the median hemoglobin (Hb) at the start of therapy was 10.30 (RIC 8.9–11.70), phosphorus 4.51 (RIC 3.82−5.40), albumin 3.61 (RIC 3.19−4.00), body mass index (BMI) 24.80 (RIC 22.22−27.70), 27.98% of patients had diuresis greater than 100 mL in 24 h on admission to therapy (Tables 2 and 3).
Demographic characteristics of the incident population on peritoneal dialysis 2007-2017 RTS Colombia Data expressed in %, median with RIC.
| Variable | Patients (n = 8170) |
|---|---|
| Age (years) | 60 (50−70) |
| Male sex (%) | 55.32 (4.520) |
| Diagnosis of DM % (n) | 53.18 (4.345) |
| Diagnosis of hypertension % (n) | 61.30 (5.008) |
| Hemoglobin g/dL | 10.30 (8.90−11.70) |
| Phosphorus mg/dL | 4.51 (3.82−5.40) |
| Albumin g/dL | 3.61 (3.19−4.00) |
| body mass index kg/m2 | 24.80 (22.22−27.70) |
| Diuresis > 100 mL/24 h % (n) | 27.98 (2.286) |
| D/P creatinine hour 4 of ba | 0.642 (0.130) |
| PET time (days) | 69 (52−94) |
DM: diabetes mellitus; HT: hypertension; IQR: interquartile range; PET: peritoneal equilibration test; SD: standard deviation.
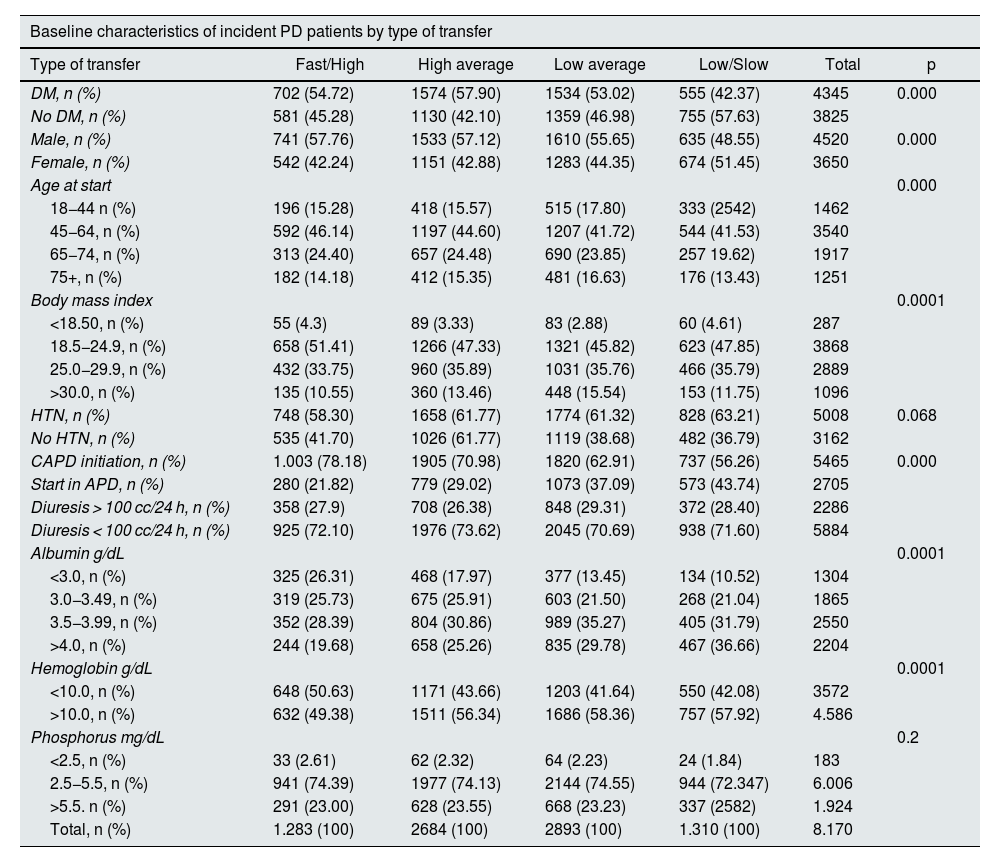
Laboratory characteristics at study entry according to PSTR.
| Baseline characteristics of incident PD patients by type of transfer | ||||||
|---|---|---|---|---|---|---|
| Type of transfer | Fast/High | High average | Low average | Low/Slow | Total | p |
| DM, n (%) | 702 (54.72) | 1574 (57.90) | 1534 (53.02) | 555 (42.37) | 4345 | 0.000 |
| No DM, n (%) | 581 (45.28) | 1130 (42.10) | 1359 (46.98) | 755 (57.63) | 3825 | |
| Male, n (%) | 741 (57.76) | 1533 (57.12) | 1610 (55.65) | 635 (48.55) | 4520 | 0.000 |
| Female, n (%) | 542 (42.24) | 1151 (42.88) | 1283 (44.35) | 674 (51.45) | 3650 | |
| Age at start | 0.000 | |||||
| 18−44 n (%) | 196 (15.28) | 418 (15.57) | 515 (17.80) | 333 (2542) | 1462 | |
| 45−64, n (%) | 592 (46.14) | 1197 (44.60) | 1207 (41.72) | 544 (41.53) | 3540 | |
| 65−74, n (%) | 313 (24.40) | 657 (24.48) | 690 (23.85) | 257 19.62) | 1917 | |
| 75+, n (%) | 182 (14.18) | 412 (15.35) | 481 (16.63) | 176 (13.43) | 1251 | |
| Body mass index | 0.0001 | |||||
| <18.50, n (%) | 55 (4.3) | 89 (3.33) | 83 (2.88) | 60 (4.61) | 287 | |
| 18.5−24.9, n (%) | 658 (51.41) | 1266 (47.33) | 1321 (45.82) | 623 (47.85) | 3868 | |
| 25.0−29.9, n (%) | 432 (33.75) | 960 (35.89) | 1031 (35.76) | 466 (35.79) | 2889 | |
| >30.0, n (%) | 135 (10.55) | 360 (13.46) | 448 (15.54) | 153 (11.75) | 1096 | |
| HTN, n (%) | 748 (58.30) | 1658 (61.77) | 1774 (61.32) | 828 (63.21) | 5008 | 0.068 |
| No HTN, n (%) | 535 (41.70) | 1026 (61.77) | 1119 (38.68) | 482 (36.79) | 3162 | |
| CAPD initiation, n (%) | 1.003 (78.18) | 1905 (70.98) | 1820 (62.91) | 737 (56.26) | 5465 | 0.000 |
| Start in APD, n (%) | 280 (21.82) | 779 (29.02) | 1073 (37.09) | 573 (43.74) | 2705 | |
| Diuresis > 100 cc/24 h, n (%) | 358 (27.9) | 708 (26.38) | 848 (29.31) | 372 (28.40) | 2286 | |
| Diuresis < 100 cc/24 h, n (%) | 925 (72.10) | 1976 (73.62) | 2045 (70.69) | 938 (71.60) | 5884 | |
| Albumin g/dL | 0.0001 | |||||
| <3.0, n (%) | 325 (26.31) | 468 (17.97) | 377 (13.45) | 134 (10.52) | 1304 | |
| 3.0−3.49, n (%) | 319 (25.73) | 675 (25.91) | 603 (21.50) | 268 (21.04) | 1865 | |
| 3.5−3.99, n (%) | 352 (28.39) | 804 (30.86) | 989 (35.27) | 405 (31.79) | 2550 | |
| >4.0, n (%) | 244 (19.68) | 658 (25.26) | 835 (29.78) | 467 (36.66) | 2204 | |
| Hemoglobin g/dL | 0.0001 | |||||
| <10.0, n (%) | 648 (50.63) | 1171 (43.66) | 1203 (41.64) | 550 (42.08) | 3572 | |
| >10.0, n (%) | 632 (49.38) | 1511 (56.34) | 1686 (58.36) | 757 (57.92) | 4.586 | |
| Phosphorus mg/dL | 0.2 | |||||
| <2.5, n (%) | 33 (2.61) | 62 (2.32) | 64 (2.23) | 24 (1.84) | 183 | |
| 2.5−5.5, n (%) | 941 (74.39) | 1977 (74.13) | 2144 (74.55) | 944 (72.347) | 6.006 | |
| >5.5. n (%) | 291 (23.00) | 628 (23.55) | 668 (23.23) | 337 (2582) | 1.924 | |
| Total, n (%) | 1.283 (100) | 2684 (100) | 2893 (100) | 1.310 (100) | 8.170 | |
DM: diabetes mellitus; HT: hypertension; PET: peritoneal equilibration test; PSTR: peritoneal small solute transfer; APD: automated peritoneal dialysis; CAPD: continuous ambulatory peritoneal dialysis.
Median follow-up was 730 days with ICR 413−1243 days, time at risk 7434 days; 33.11% (2705) of patients started on automated peritoneal dialysis (APD).
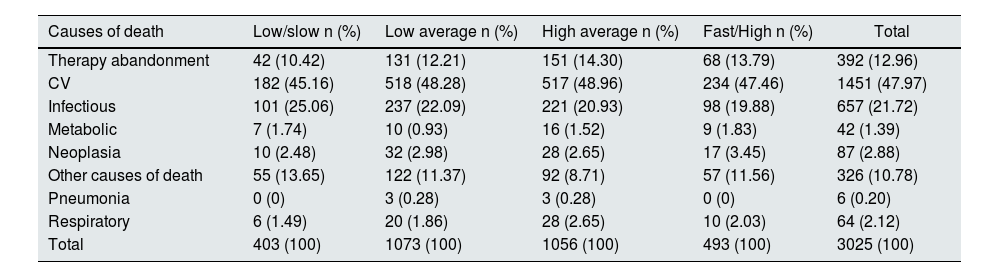
Among the causes of discharge (Table 4), 1079 patients were transferred to HD, there were 2633 deaths, 661 patients received renal transplantation. Patients with treatment discontinuation (392) were classified as mortality cases, since they required life-sustaining therapy, the date of treatment discontinuation was used as the date of death. Patients who dropped out of therapy and were transferred to other centers were censored, while living patients were administratively censored. Table 5 shows the causes of mortality according to the PSTR group.
Causes of discharge of incident patients on peritoneal dialysis. RTS Colombia 2007–2017.
| Causes for leaving | n | % |
|---|---|---|
| Abandonment of therapy | 174 | 2.13 |
| Transition to hemodialysis | 1079 | 13.21 |
| Death (all causes) | 2633 | 32.23 |
| Recovery of renal function | 337 | 4.12 |
| Suspension of treatment | 392 | 4.8 |
| Transfer to other non-RTS centers | 1319 | 16.14 |
| Renal transplant | 661 | 8.09 |
| Alive at the end of follow-up | 1575 | 19.28 |
| Total | 8170 | 100 |
Causes of death according to PSTR.
| Causes of death | Low/slow n (%) | Low average n (%) | High average n (%) | Fast/High n (%) | Total |
|---|---|---|---|---|---|
| Therapy abandonment | 42 (10.42) | 131 (12.21) | 151 (14.30) | 68 (13.79) | 392 (12.96) |
| CV | 182 (45.16) | 518 (48.28) | 517 (48.96) | 234 (47.46) | 1451 (47.97) |
| Infectious | 101 (25.06) | 237 (22.09) | 221 (20.93) | 98 (19.88) | 657 (21.72) |
| Metabolic | 7 (1.74) | 10 (0.93) | 16 (1.52) | 9 (1.83) | 42 (1.39) |
| Neoplasia | 10 (2.48) | 32 (2.98) | 28 (2.65) | 17 (3.45) | 87 (2.88) |
| Other causes of death | 55 (13.65) | 122 (11.37) | 92 (8.71) | 57 (11.56) | 326 (10.78) |
| Pneumonia | 0 (0) | 3 (0.28) | 3 (0.28) | 0 (0) | 6 (0.20) |
| Respiratory | 6 (1.49) | 20 (1.86) | 28 (2.65) | 10 (2.03) | 64 (2.12) |
| Total | 403 (100) | 1073 (100) | 1056 (100) | 493 (100) | 3025 (100) |
CV: cardiovascular death.
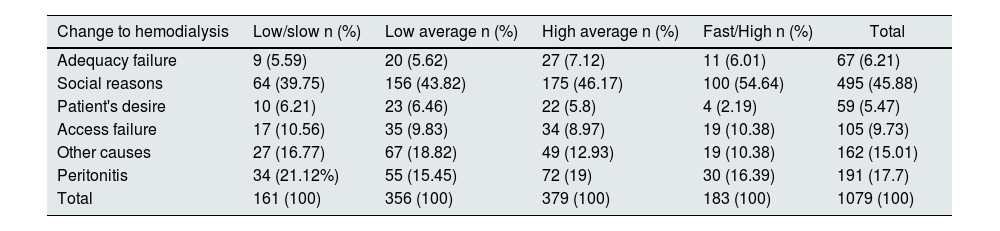
In the survival of the technique, 1079 patients were transferred to hemodialysis, the highest percentage being associated with social reasons (45.88%), 17.70% due to peritonitis, 9.73% associated with access failure and 6.21% associated with failure in adequacy (Table 6).
Causes of change to hemodialysis therapy, incident patients on peritoneal dialysis 2007–2017 RTS Colombia.
| Change to hemodialysis | Low/slow n (%) | Low average n (%) | High average n (%) | Fast/High n (%) | Total |
|---|---|---|---|---|---|
| Adequacy failure | 9 (5.59) | 20 (5.62) | 27 (7.12) | 11 (6.01) | 67 (6.21) |
| Social reasons | 64 (39.75) | 156 (43.82) | 175 (46.17) | 100 (54.64) | 495 (45.88) |
| Patient's desire | 10 (6.21) | 23 (6.46) | 22 (5.8) | 4 (2.19) | 59 (5.47) |
| Access failure | 17 (10.56) | 35 (9.83) | 34 (8.97) | 19 (10.38) | 105 (9.73) |
| Other causes | 27 (16.77) | 67 (18.82) | 49 (12.93) | 19 (10.38) | 162 (15.01) |
| Peritonitis | 34 (21.12%) | 55 (15.45) | 72 (19) | 30 (16.39) | 191 (17.7) |
| Total | 161 (100) | 356 (100) | 379 (100) | 183 (100) | 1079 (100) |
The flexible parametric model described by Royston–Lambert25 was used for the overall patient survival analysis.
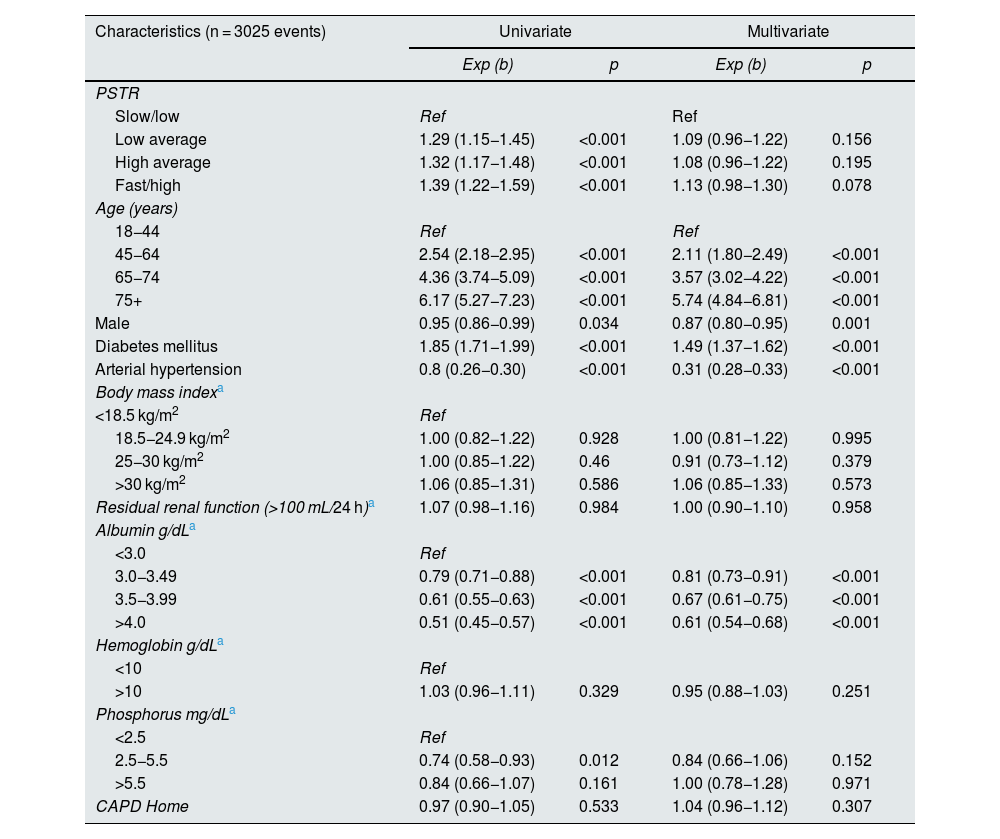
We found that the HRce for patients with high/fast PSTR was 1.13 (95% CI 0.98−1.30) p = 0.078 compared to low/slow PSTR type. For the high average group the HRce was 1.08 (95% CI 0.96−1.22), p = 0.195, for the low average group the HRce was 1.09 (95% CI 0.96−1.22), p = 0.156, model adjusted for age, sex, DM, AHT, BMI, presence of residual renal function at baseline, albumin, hemoglobin, phosphorus and type of initial peritoneal dialysis therapy (Table 7).
Cause-specific proportional hazards model, flexible parametric survival model with competing risks. Type of peritoneal membrane transfer according to PET and overall mortality. Incident patients on peritoneal dialysis RTS Colombia 2007-2017.
| Characteristics (n = 3025 events) | Univariate | Multivariate | ||
|---|---|---|---|---|
| Exp (b) | p | Exp (b) | p | |
| PSTR | ||||
| Slow/low | Ref | Ref | ||
| Low average | 1.29 (1.15−1.45) | <0.001 | 1.09 (0.96−1.22) | 0.156 |
| High average | 1.32 (1.17−1.48) | <0.001 | 1.08 (0.96−1.22) | 0.195 |
| Fast/high | 1.39 (1.22−1.59) | <0.001 | 1.13 (0.98−1.30) | 0.078 |
| Age (years) | ||||
| 18−44 | Ref | Ref | ||
| 45−64 | 2.54 (2.18−2.95) | <0.001 | 2.11 (1.80−2.49) | <0.001 |
| 65−74 | 4.36 (3.74−5.09) | <0.001 | 3.57 (3.02−4.22) | <0.001 |
| 75+ | 6.17 (5.27−7.23) | <0.001 | 5.74 (4.84−6.81) | <0.001 |
| Male | 0.95 (0.86−0.99) | 0.034 | 0.87 (0.80−0.95) | 0.001 |
| Diabetes mellitus | 1.85 (1.71−1.99) | <0.001 | 1.49 (1.37−1.62) | <0.001 |
| Arterial hypertension | 0.8 (0.26−0.30) | <0.001 | 0.31 (0.28−0.33) | <0.001 |
| Body mass indexa | ||||
| <18.5 kg/m2 | Ref | |||
| 18.5−24.9 kg/m2 | 1.00 (0.82−1.22) | 0.928 | 1.00 (0.81−1.22) | 0.995 |
| 25−30 kg/m2 | 1.00 (0.85−1.22) | 0.46 | 0.91 (0.73−1.12) | 0.379 |
| >30 kg/m2 | 1.06 (0.85−1.31) | 0.586 | 1.06 (0.85−1.33) | 0.573 |
| Residual renal function (>100 mL/24 h)a | 1.07 (0.98−1.16) | 0.984 | 1.00 (0.90−1.10) | 0.958 |
| Albumin g/dLa | ||||
| <3.0 | Ref | |||
| 3.0−3.49 | 0.79 (0.71−0.88) | <0.001 | 0.81 (0.73−0.91) | <0.001 |
| 3.5−3.99 | 0.61 (0.55−0.63) | <0.001 | 0.67 (0.61−0.75) | <0.001 |
| >4.0 | 0.51 (0.45−0.57) | <0.001 | 0.61 (0.54−0.68) | <0.001 |
| Hemoglobin g/dLa | ||||
| <10 | Ref | |||
| >10 | 1.03 (0.96−1.11) | 0.329 | 0.95 (0.88−1.03) | 0.251 |
| Phosphorus mg/dLa | ||||
| <2.5 | Ref | |||
| 2.5−5.5 | 0.74 (0.58−0.93) | 0.012 | 0.84 (0.66−1.06) | 0.152 |
| >5.5 | 0.84 (0.66−1.07) | 0.161 | 1.00 (0.78−1.28) | 0.971 |
| CAPD Home | 0.97 (0.90−1.05) | 0.533 | 1.04 (0.96−1.12) | 0.307 |
PET: peritoneal equilibration test; PSTR: peritoneal small solute transfer; PD: peritoneal dialysis; CAPD: continuous ambulatory peritoneal dialysis.
For the technique survival model, the event is transition to hemodialysis for more than 90 days and renal transplantation, recovery of renal function and patient death are taken as competing risks. The same competing risks model used for overall patient survival was used.
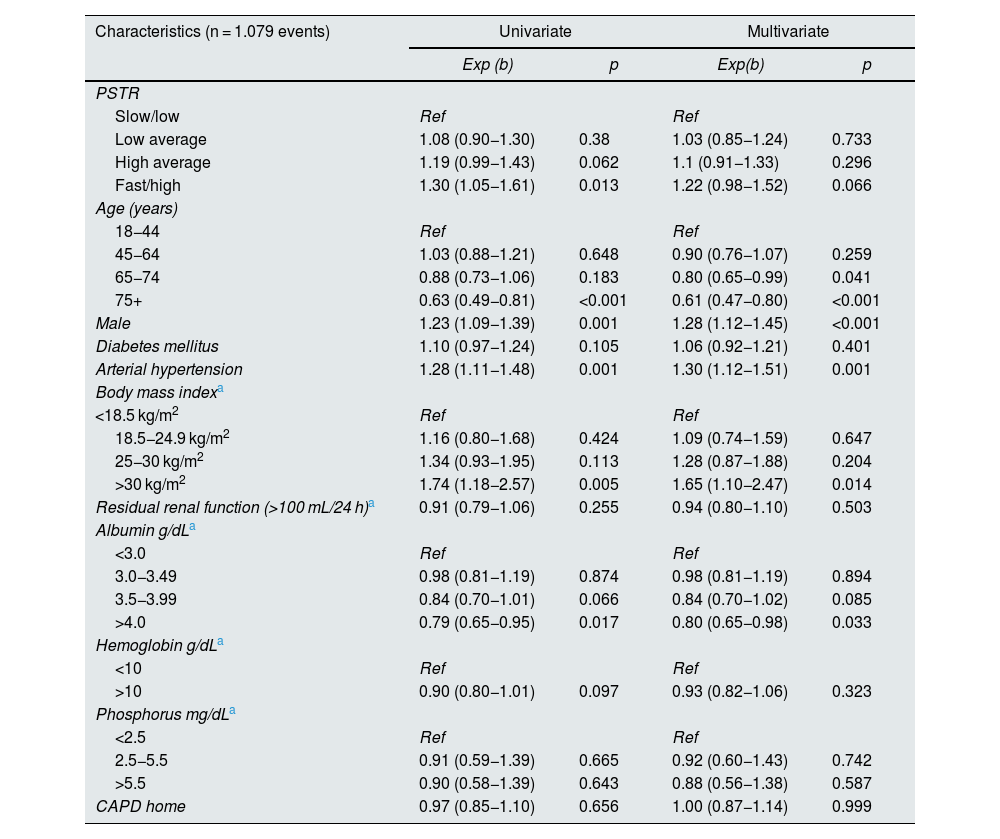
We found for technique survival a HRce for high/rapid PSTR of 1.22 (95% CI 0.98−1.52), p = 0.66, compared to low/slow, adjusted for age, sex, DM, HT, BMI, residual renal function, albumin, phosphorus, hemoglobin and starting therapy. For high average a HRce of 1.10, (95% CI 0.91−1.33), p = 0.296, for low average HRce of 1.03 (95% CI 0.85−1.24), p = 0.73 (Table 8).
Cause-specific proportional hazards model, flexible parametric survival model with competing risks. Type of peritoneal membrane transfer according to PET and technique survival. Incident patients in peritoneal dialysis RTS Colombia 2007-2017.
| Characteristics (n = 1.079 events) | Univariate | Multivariate | ||
|---|---|---|---|---|
| Exp (b) | p | Exp(b) | p | |
| PSTR | ||||
| Slow/low | Ref | Ref | ||
| Low average | 1.08 (0.90−1.30) | 0.38 | 1.03 (0.85−1.24) | 0.733 |
| High average | 1.19 (0.99−1.43) | 0.062 | 1.1 (0.91−1.33) | 0.296 |
| Fast/high | 1.30 (1.05−1.61) | 0.013 | 1.22 (0.98−1.52) | 0.066 |
| Age (years) | ||||
| 18−44 | Ref | Ref | ||
| 45−64 | 1.03 (0.88−1.21) | 0.648 | 0.90 (0.76−1.07) | 0.259 |
| 65−74 | 0.88 (0.73−1.06) | 0.183 | 0.80 (0.65−0.99) | 0.041 |
| 75+ | 0.63 (0.49−0.81) | <0.001 | 0.61 (0.47−0.80) | <0.001 |
| Male | 1.23 (1.09−1.39) | 0.001 | 1.28 (1.12−1.45) | <0.001 |
| Diabetes mellitus | 1.10 (0.97−1.24) | 0.105 | 1.06 (0.92−1.21) | 0.401 |
| Arterial hypertension | 1.28 (1.11−1.48) | 0.001 | 1.30 (1.12−1.51) | 0.001 |
| Body mass indexa | ||||
| <18.5 kg/m2 | Ref | Ref | ||
| 18.5−24.9 kg/m2 | 1.16 (0.80−1.68) | 0.424 | 1.09 (0.74−1.59) | 0.647 |
| 25−30 kg/m2 | 1.34 (0.93−1.95) | 0.113 | 1.28 (0.87−1.88) | 0.204 |
| >30 kg/m2 | 1.74 (1.18−2.57) | 0.005 | 1.65 (1.10−2.47) | 0.014 |
| Residual renal function (>100 mL/24 h)a | 0.91 (0.79−1.06) | 0.255 | 0.94 (0.80−1.10) | 0.503 |
| Albumin g/dLa | ||||
| <3.0 | Ref | Ref | ||
| 3.0−3.49 | 0.98 (0.81−1.19) | 0.874 | 0.98 (0.81−1.19) | 0.894 |
| 3.5−3.99 | 0.84 (0.70−1.01) | 0.066 | 0.84 (0.70−1.02) | 0.085 |
| >4.0 | 0.79 (0.65−0.95) | 0.017 | 0.80 (0.65−0.98) | 0.033 |
| Hemoglobin g/dLa | ||||
| <10 | Ref | Ref | ||
| >10 | 0.90 (0.80−1.01) | 0.097 | 0.93 (0.82−1.06) | 0.323 |
| Phosphorus mg/dLa | ||||
| <2.5 | Ref | Ref | ||
| 2.5−5.5 | 0.91 (0.59−1.39) | 0.665 | 0.92 (0.60−1.43) | 0.742 |
| >5.5 | 0.90 (0.58−1.39) | 0.643 | 0.88 (0.56−1.38) | 0.587 |
| CAPD home | 0.97 (0.85−1.10) | 0.656 | 1.00 (0.87−1.14) | 0.999 |
PET: peritoneal equilibration test; PSTR: peritoneal small solute transfer; PD: peritoneal dialysis; CAPD: continuous ambulatory peritoneal dialysis.
Some 51.84% of patients started therapy with phosphorus greater than 4.5 mg/dL; 43.79% started therapy with Hb less than 10 g/dL, 40% had albumin less than 3.5 g/dL, 30% had a BMI greater than 30 kg/m2, 27.98% reported diuresis greater than 100 mL in 24 h. We found differences in albumin and hemoglobin levels at the start of therapy according to the different types of PSTR (p < 0.05) (Table 3) with lower albumin levels in patients with high transfer compared to the other groups. There was no difference in serum phosphorus levels according to the different peritoneal membrane transfer groups (p = 0.48).
DiscussionIn our analysis using a flexible parametric competing risks model, we found in the patient survival analysis that the adjusted HRce for the high group was 1.13 (95% CI 0.98−1.30) with a p = 0.078, which is not significant when compared to patients with low/slow PSTR. Likewise, the HRce for patients with high mean was 1.08 (95% CI 0.96−1.22), p = 0.19, also not significant. We found that age, presence of DM, low albumin at the start of therapy were associated with higher mortality in the adjusted models independent of the type of transport (Table 7). There were no differences in mortality correlated to levels of phosphorus, hemoglobin, initial residual renal function, body mass index at the start of peritoneal dialysis therapy and neither with the initial therapy, either APD or continuous ambulatory peritoneal dialysis (CAPD).
For technique survival and its relation to peritoneal membrane transfer type, we found that patients in the high/fast group had an adjusted HRce of 1.22 (95% CI 0.98−1.52) p = 0.06 compared to patients with low/slow transport type; the HRce for high average was 1.10 (95% CI 0.91−1.33), p = 0.29; for low average the HRce was 1.03 (95% CI 0.85−1.24) p = 0.73, also not significant, finding no etiological relationship between technique survival and type of transfer. Patients older than 75 years had better technique survival with a HRce of 0.61 (95% CI 0.47−0.80), p < 0.001, male patients had lower technique survival, HRce 1.28 (95% CI 1.12−1.45), p < 0.001. There was no difference in diabetic patients. Patients with BMI above 30 kg/m2, were associated with worse technique survival, HRce 1.30 (95% CI 1.12−1.51), p = 0.01. Albumin greater than 4 g/dL at the start of therapy was associated with better technique survival (HRce 0.80, 95% CI 0.65−0.98, p = 0.03) (Table 8).
High/rapid PSTR at initiation of therapy has been associated with increased risk of mortality, probably associated with a systemic inflammatory state, fluid overload and increased cardiovascular mortality. A study of the ANZDATA registry with a large patient population (3702) found a high risk (HR 1.34; 95% CI 1.05–1.79, p = 0.02) of mortality in the high PSTR population compared to those with low average, similarly in technique survival also found significant differences between those with high transports and the reference group (low average).4 They suggest that the possible causes of the increased risk would be associated with volume overload due to low UF. However, the subgroup of patients on APD therapy did not have a higher risk of all-cause mortality or lower survival of the technique, which further reinforces that it is not the association between PSTR but comorbidities and management of volemia and UF that would increase the risk of mortality and decreased survival of the technique.
Brimble et al.5 published a meta-analysis in 2006 of 19 articles between 1987 and 2006, finding that the relative risk (RR) of mortality was 1.15 (95% CI 1.07–1.23; p < 0.001) for each increase in creatinine d/p at hour 4 of PET of 0.1 unit. The meta-analysis failed to find significant differences due to the type of transfer for technique failure.
Mehrotra et al.28 in a review of 10,142 patients found that creatinine d/p at hour 4 PET was associated with increased risk of mortality (HR 1.05; 95% CI 1.03–1.06) for every 0.1 unit increase in PET. It is important to note that most of the patients were on APD therapy, yet found increased mortality risk; the reasons for this increased mortality are similar to those of the other studies, relating high PSTR to increased inflammation, comorbidities and inadequate UF.
Contrary to these reports, other authors maintain that the type of high PSTR is not an important risk factor for mortality in these patients, especially with the more liberal use of APD and icodextrin, and even show a decrease in mortality in this group according to the time of initiation of therapy, being better in those who started therapy after 1998.11–16,29
Among the reports found in the literature, analyses are made of overall patient and technique survival using Kaplan-Meier models and the Cox proportional hazards model, all with risk estimation without considering competing risks, which makes it difficult to compare our results with those of the other groups, given that we want to evaluate the causal relationship rather than risk. However, we did not find a causal relationship between RRP and patient survival and peritoneal dialysis technique, which reaffirms the findings of Davies and Chung et al.,29,30 where the type of RRP of the patient is not critical and is considered a risk factor rather than a causal relationship, given that when these patients are managed with icodextrin or with adequate management of dwell time and UF, mortality improves and it matches the rest of the transfer groups. This indicates that the management given to these patients changes mortality more than does the type of peritoneal membrane transfer.
In our report, given the conditions in Colombia, access to icodextrin is restricted, with only a few patients, which eliminates the bias that this treatment could have.
In our cohort the presence of DM was clearly associated with higher mortality, with a HRce of 1.49 (95% CI 1.37−1.2), p < 0.001, in agreement with previous reports. Likewise, the HRce also increased with age groups in the cohort. Albumin was also correlated with better patient survival. Patients who started with albumin greater than 4 g/dL had a HRce of 0.61 (95% CI 0.54−0.68), p > 0.001, compared to those patients who started with albumin less than 3 g/dL, probably reflecting a better nutritional status, less inflammatory component or comorbidities, independent of the type of peritoneal membrane transfer. We did not find differences with respect to phosphorus on admission to therapy in these analyses. In the survival of the technique there were no differences in the diabetic population, we found better survival in the older group, female sex, and in those with higher albumin and lower survival in those patients who started with BMI over 30 kg/m2, HRce of 1.65 (95% CI 1.10–2.46), p = 0.014. We found no differences according to the modality of peritoneal dialysis at therapy entry.
Among the strengths of the study is the large population study size, since patients from all renal units of the national STR network were included, which gives it greater power and external validity. All patients were managed with the same peritoneal dialysis solutions (Dianeal®) and only few patients with icodextrin, which favors our study, since it avoids that confounding factor. Among the weaknesses, it is important to note that this is a retrospective study and although we have significant clinical and laboratory data on patient admission, we do not know the degree of morbidity. Not reporting PET before discharge can also be considered a weakness of the study; however, the question is more about the etiological relationship at the start of dialysis and survival. Although the protocol for performing PET is the same for all renal units, we cannot guarantee that all of them were performed correctly. We considered PET data from days 28 and 180, since the variations are not so marked in terms of the change in creatinine d/p at hour 4 of PET, although in the analyses we found that the PET of more than 120 days tended to have higher creatinine d/p at hour 4 of PET. We also performed additional survival analyses which yielded similar results. There is also a significant population of patients who did not have PET data at any time that could alter the results, however, the sample size calculation indicates that the number of patients is sufficient for the analyses. Another weakness is the low frequency of residual diuresis at the start of therapy (28%): there may be a bias in the quality of the data and that is not adequately reported.
ConclusionsWe did not find an etiological relationship between peritoneal membrane solute transfer characteristics, assessed at the start of peritoneal dialysis therapy, and patient and technique survival using a competing risks model, adjusted for the different variables at the start of peritoneal dialysis therapy.
There are other factors related to overall mortality such as age at admission to therapy, presence of DM, initial albumin and female sex. We did not find differences in the type of peritoneal dialysis therapy at the beginning.
In technique survival, male sex and body mass index greater than 30 kg/m2 were associated with poorer survival in the adjusted models. In contrast, older age and albumin greater than 4 g/dL at baseline were associated with better survival.
FinancingThis work has not received any type of funding.
Conflict of interestThe authors have no conflicts of interest to declare.


