Introducción: en los últimos años se ha intentado homogeneizar la actividad clínica y facilitar la toma de decisiones. En el campo de la Nefrología, la SEN ha elaborado diferentes guías de práctica clínica que han conseguido una mejora de la monitorización de los pacientes. Por ello, se ha creado un grupo de trabajo sobre Gestión de la Calidad en Nefrología cuyo ámbito fundamental ha sido la hemodiálisis, aunque su colaboración con un grupo de expertos de Diálisis Peritoneal (DP) ha permitido la elaboración del Plan de Calidad Científico-técnica y de Mejora Continua de Calidad en DP. El objetivo de nuestro trabajo fue evaluar la situación de la Unidad de DP de nuestro centro respecto a dicho plan de calidad valorando cada uno de los indicadores propuestos y compararlos con los estándares recomendados. Material y métodos: revisamos las historias clínicas de todos los pacientes que realizaron DP durante el año 2008 en nuestra Unidad, valorando todos los indicadores de calidad descritos en el Plan de Calidad Científico-técnica y de Mejora Continua de Calidad en DP. Resultados: durante el año 2008, 41 pacientes realizaron DP en nuestro centro; el 43,9% eran mujeres, con una incidencia de 14 (51,8%), y el 21,4% eran diabéticos. Ningún paciente procedía de trasplante y 2 de HD (7,1%). La edad media de la población incidente fue de 60 ± 13 años, y la de la prevalente fue de 53,9 ± 14,4 años, con tiempo medio en DP de 25,9 ± 19,9 meses. La mediana del índice de comorbilidad de Charlson modificado en incidentes fue 6 y en prevalentes 5. El 70,7% estaba incluido en programa de trasplante y se trasplantaron 3 (10,3%). Hubo 19 ingresos (0,46 por paciente/año en riesgo), con estancia media de 7,3 días (3,4 días por paciente/año en riesgo). A lo largo del año abandonaron el tratamiento 6 pacientes (2 transferencias a HD, 3 trasplantes y 1 exitus). Hubo 16 peritonitis (1 episodio cada 24 meses-paciente) y 23 infecciones del OS (1 episodio cada 18 meses-paciente). El Kt/V medio fue de 2,4 ± 0,06, con el 92,7% dentro del objetivo. El 100% de los pacientes no anúricos tenían medida FRR; sólo 1 paciente no alcanzaba el objetivo de eliminación de líquido >1.000 ml/día; en ningún caso se utilizaban bolsas de 3,86-4,25%. Se alcanzaron los estándares de los indicadores analíticos en lo que respecta a índice de resistencia a eritropoyetina, LDL-colesterol, fósforo, producto calcio-fósforo y PTH intacta. Conclusiones: la aplicación del Plan de Calidad Científico-técnica y de Mejora Continua de Calidad en Diálisis Peritoneal nos ha permitido conocer la situación actual de nuestra Unidad y plantearnos aquellas cuestiones en las que es preciso incidir para conseguir una mejor calidad en la asistencia que prestamos.
Introduction: In last time it was tried to homogenize the clinical activity and to make the decisions easier. In the field of Nephrology, the Spanish Society of Nephrology has developed different guidelines that have managed an improvement in patient´s monitoring. That is the reason why the Quality Working Group in Nephrology was created, whose basic working field was haemodialysis, although its collaboration with an expert group in peritoneal dialysis (PD) has allowed the developement of a Scientific Technical Quality Programme and Constant Quality Improvement in PD. Material and methods:We checked the clinical histories of all the patients in PD in the course of 2008 in the Peritoneal Dialysis Unit at our institution and we evaluated all the quality indicators that were described in the Scientific Technical Quality Programme and of Constant Quality Improvement in PD. Results: During 2008 a total of 41 patients were treated in the Peritoneal Dialysis Unit at our institution, 43.9% women. Incidence was 14 (51.8%) and 21.4% were diabetics. No patients cames from transplant unit and 2 came from haemodilalysis unit (7.1%). Mean age in incident population was 60 ± 13 years and in prevalent population was 53.9 ± 14.4 years. Mean follow-up in PD was 25.9 ± 19.9 months. Modified Charlson comorbility index average in incident patients was 6 and in prevalent patients was 5. 70.7% were included in transplant programme and 3 were transplanted in the year´s course (10.3%). There were 19 hospital admissions (rate: 0.46 admission per patient/year in risk) with a mean stay of 7.3 days (rate: 3.4 days per patient/year in risk). During 2008 6 patients leaved PD (2 transfers to haemodialysis, 3 transplants and 1 death). 16 infective peritonitis (overall rate:1 episode every 24 months) and 23 exit side infections were reported (rate: 1 episode every 18 months). Mean Kt/V was 2,4 ± 0.06 (92.7% of patients achieved the stablished standards). All non-anuric patients had measured residual renal function and only 1 patient did not achieve the goal of fluid output > 1000 ml/day. No patient used 3.86-4.25% bags. Stablished standards were achieve by analitic indicators with regard to epoetin resistence index, LDL- cholesterol, phosphate, calcium-phosphate product and PTH.Conclusions: The application of the Scientific Technical Quality Programme and of Constant Quality Improvement in PD has made possible to know the current situation of our unit and to raise some matters when it is necessary to insist to get a better quality in our assistance.
INTRODUCTION
The incidence and prevalence of Advanced Chronic Kidney Disease (ACKD) are increasing, and the result is the significant consumption of resources, for which reason maximum efficiency must be ensured. At present, there is no relevant, global information regarding Renal Replacement Therapy (RRT) and it is essential to possess global standards, adjusted for their results, in order to make decisions, create improvement plans, and lastly, improve processes and results.1
The implementation of evaluation and quality improvement techniques is recent in the health sector. To this end, we have developed different models similar to ISO’s (the International Organization for Standardization) standard 9001-2000 or the European Foundation for Quality Management’s (EFQM) excellence model, both of which are borrowed from the industrial production sector. They have been applied to the health sector in the last decade,2,3 and their objective is to satisfy the needs and expectations of patients, workers, cooperative organisations and the general society by decreasing the variability of clinical practice.4
In the last few years, steps have been taken to homogenise clinical activity and facilitate decision-making. To accomplish these purposes, the SEN (Spanish Society of Nephrology) compiled different clinical practice guides5 that have improved patient monitoring. Furthermore, to produce improved results, it is necessary to define criteria in order to then measure them using quality indicators and standards.6
All of these reasons explain why a work group for Quality Management in Nephrology2 was created in 2003 with a fundamental focus on HD. Its cooperation with a group of Peritoneal Dialysis (PD) experts has led to the elaboration of the Technical-Scientific Quality Plan and Continuous Quality Improvement for Peritoneal Dialysis, which was presented in the SEN’s 37th National Congress held in Cadiz. The plan is currently posted on the webpage.2
The objective of our study was to evaluate the PD Unit in our centre with respect to that quality plan, and evaluate each of the proposed indicators, comparing them with the recommended standards.
MATERIAL AND METHODS
Study design
The project is a descriptive population study of the results for quality indicators for the Technical-Scientific Quality Plan and Continuous Quality Improvement for Peritoneal Dialysis in our unit.
Patients
All patients who received PD in our unit throughout 2008 were included. There were no exclusion criteria.
Quality indicators
We evaluated all of the quality indicators listed in the Technical-Scientific Quality Plan and Continuous Quality Improvement for Peritoneal Dialysis Plan. Some did not have defined standards and were merely descriptive, while for others the standards were concretely expressed and allowed us to evaluate their fulfilment:
- Global indicators: Incidence, prevalence, average age of the incident population, average age of the prevalent population, percentage of patients with Diabetes Mellitus (DM) in the incident population, percentage of patients who had not received previous treatment in the incident population, percentage of patients referred from HD in the incident population, percentage of patients referred following transplant in the incident population, male/female patient ration in the prevalent population, percentage of patients granting informed consent upon beginning PD, percentage of prevalent patients on Automated Peritoneal Dialysis (APD).
- Co-morbidity indicators: Median of the modified Charlson co-morbidity index in incident patients on PD, Median of the modified Charlson co-morbidity index in prevalent patients on PD.
- Result indicators:
- Hospitalisation: number of times admitted to hospital, mean stay after admission to hospital.
- Going off of PD: Number of patients who stop treatment for any reason, due to referral to HD or to exitus.
- Transplant: Kidney transplant programme’s inclusion rate, time before inclusion, number of patients receiving transplants, time on dialysis prior to the transplant, time before the peritoneal catheter is removed following the kidney transplant.
- Infection indicators: Total peritonitis ratio (patients per month), peritonitis rate on APD and continuous ambulatory peritoneal dialysis (CAPD), including the percentage of culture-negative peritonitis, the percentage of gram-positive peritonitis, the percentage of gramnegative peritonitis, the percentage of fungal peritonitis, the percentage of catheter-dependent peritonitis, the infection ratio of the exit orifice, and the percentage of patients providing nasal samples to determine if they are carriers of Staphylococcus aureus.
- Membrane sufficiency and function indicators: Percentage of patients with urea Kt/V measured weekly, percentage of patients with weekly urea Kt/V > 1.7, percentage of prevalent patients with Residual Renal Function (RRF) among non-anuric patients, percentage of patients with total liquid elimination > 1,000ml/day, percentage of patients using one or more bags of 3.86- 4.25% glucose, percentage of patients undergoing a Peritoneal Equilibrium Test (PET) during the first three months on PD, percentage of patients who undergo a yearly PET, percentage of patients with high peritoneal transport.
- Analytical indicators: Percentage of patients with target haemoglobin (11-13g/dl), percentage of patients with an erythropoietin resistance index < 9IU/kg/g haemoglobin, percentage of patients with a darbepoetin resistance index < 0.045μg/kg/g haemoglobin, percentage of patients with LDL cholesterol < 100mg/dl, percentage of patients with albumin > 3.5g/dl, percentage of patients with p < 5.5mg/dl, percentage of patients with Ca 8.4-9.5mg/dl, percentage of patients with Ca x P < 55mg2/dl2, percentage of patients with I-PTH < 300pg/ml.
Global indicators of co-morbidity, results (hospitalisation, going off PD, transplants and infections are evaluated yearly, and the membrane suitability/function and analytical indicators are evaluated biannually; the latter include the mean of the calculations corresponding to the previous six months. For those patients who left the PD programme for different reasons, we used biannual data collected previous to their leaving treatment.
Statistics
The statistical analysis was carried out using percentages, means, the standard deviation and medians according to the recommendations for each of the indicators.
RESULTS
On 1 January 2008, 27 patients were in the PD programme in our unit. 14 began treatment and 6 left treatment during that year, meaning that our Unit saw 41 patients undergoing PD in 2008.
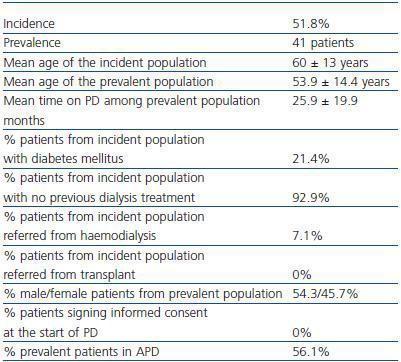
The CRD was due to glomerular pathology in 21 cases (51.2%), 6 to DM (14.6%), 4 to renal polycystosis (9.8%), 4 to chronic pyelonephritis (9.8%), 3 to vascular disease (7.3%) and 3 were unknown (7.3%). Global indicators are shown in table 1.
Regarding co-morbidity indicators, the median of the modified Charlson co-morbidity index was 6 in incident patients and 5 in prevalent patients.
Regarding the indicators for hospitalisation results, in 2008 there were 19 hospital admissions for 13 patients (0.46 admissions/patient per year at risk) with a mean stay of 7.3 days (3.4 days/patient/ year at risk).Visits to the hospital for learning the technique were not counted as hospital admissions, given that in most cases, it was performed on an outpatient basis. The most frequent cause of admission was peritonitis (in 9 cases, 47.4%).
Throughout the year, a total of six patients stopped treatment (14.6%); of these, two were referred to HD (4.9%), three received a kidney transplant (7.3%) and one died (2.4%).
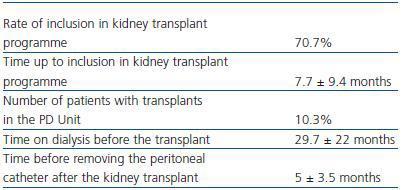
Table 2 describes transplant indicators.
Regarding indicators of peritonitis, there were 16 episodes (1 episode each 24 patient-months); of these, eight were on APD (one episode every 31 patient-months) and eight on CAPD (one episode every 19 patient-months). Peritonitis was catheter-dependent in only one case, and progressed to a relapse; on two occasions, it was necessary to remove the peritoneal catheter and withdrawal from the PD programme (once due to gram-negative peritonitis and once due to culture-negative peritonitis); the other 13 episodes were resolved. Hospital admission was necessary in nine cases, with a mean stay of 3.9 days. There were 21 exit orifice infections (1 episode every 18 patient-months). Nasal swabs were taken from 39 patients 95.1%, and six of them were carriers of Staphylococcus aureus (15.4%). Table 3 describes the infection indicators.
Regarding the membrane suitability and function indicators, our unit determines the RRF every four months and the Kt/V and creatinine clearance tests (CCr) on a weekly basis. Therefore, 100% of patients underwent these measurements.
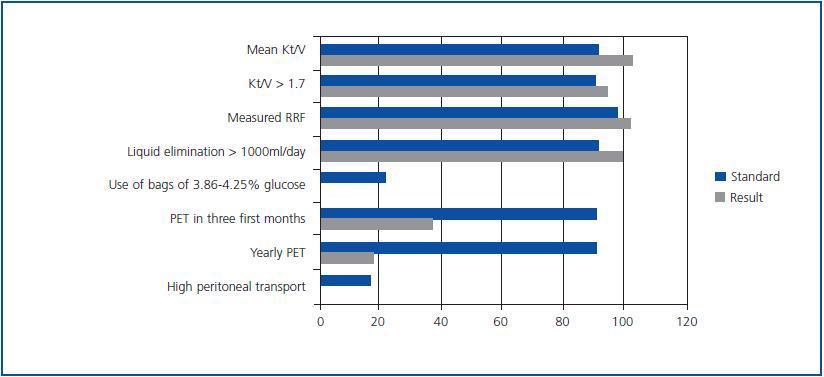
Mean Kt/V was 2.4 ± 0.06 (2.34 ± 0.1 on APD and 2.46 ± 0.06 on CAPD). Six patients are anuric; in the rest, mean diuresis is 1,270 ± 713ml, with a mean RRF (determined by the urea and creatinine clearance test) of 5.03 ± 1.8ml/min. None of the patient used bags of 3.86-4.25% glucose. A total of 15 patients underwent PET in their first three months of treatment (36.6%) and only seven patients underwent PET throughout the year; none of them presented high peritoneal transport. Figure 1 shows the percentages of fulfilment for the membrane suitability and function indicators, and their comparison with recommended standards.
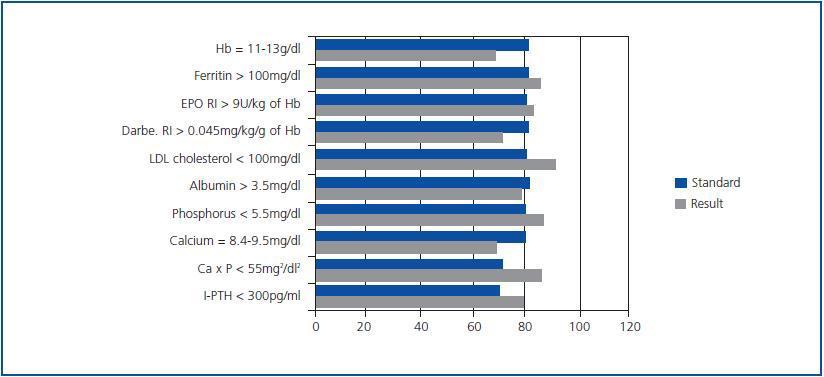
Table 4 presents the means ± SD of the analytical findings corresponding to the last six months. The percentage of fulfilment for the analytical indicators compared with the recommended standards are shown in figure 2.
DISCUSSION
This study shows the results of the quality indicators from the Technical-Scientific Quality Plan and Continuous Quality Improvement for Peritoneal Dialysis for that unit in San Pedro de Alcántara Hospital in Caceres, the leading hospital in the province, which provides service to a population of 411,431 inhabitants. In this province, HD is the first RRT option for incident and prevalent patients, with figures for 2006 at 87.07% and 52.55% respectively.7 Although 2008 statistics have not been published yet, in that year HD was also the first option for incident patients at 78%, compared with 22% referred to PD; the tendency among prevalent patients is similar. On 31 December 2008, 368 patients in our province were undergoing RRT; of these, 181 were on HD (49.2%) 35 on PD (9.5%) and 152 had a functional kidney transplant (41.3%). According to the 2007 preliminary report on dialysis and transplants, issued by the Spanish Registry of Renal Patients, available on the SEN webpage,8 PD was used in 6.15% of prevalent patients and 12.4% of incident patients during that year.
Global indicators show a high incidence on PD. The median age of the incident and prevalent population was lower than that described in the SEN’s recently published multi-centre HD quality study9 and similar to that described by the peritoneal dialysis centre group (GCDP).10 The percentage of males is less than that shown in the SEN’s 2007 log8 and in the multi-centre HD log.9 Mortality has been very low (2.4%), taking into account the SEN log’s data8 (7.8% on PD), which is probably due to the population’s mean age and low co-morbidity index, although the rate of DM is similar to that listed nationally8 and by the GCDP.10
The modified Charlson co-morbidity index was 5 in prevalent patients and 6 in incident patients, which is lower than that for HD9 (which is higher than 7) and is similar to the figure listed by the GCDP (5.15).10 This demonstrates the low comorbidity in our population, given that this score corresponds in many cases to renal disease itself, age and DM.
There were 19 admissions, 0.46 admissions/patient/year at risk, lasting 3.4 days/patient/year at risk, compared with 0.8 admissions and 7.4 days/patient/year at risk mentioned for HD9 and 0.65 admissions/year at risk described by the GCDP.10 The percentage of patients on a waiting list for a kidney transplant is very high (70.7%) compared with the quality study for HD, which shows 21%. However, only three transplants (10.3% of those on the waiting list) were performed, and with a very long wait time (29.7 ± 22 months).
The analysis of infection indicators shows an acceptable overall rate of peritonitis, with variable results according to the technique employed. Although there was no fungal peritonitis and the percentage of gram-negative cases is acceptable, the rate of culture-negative cases was high (43.75%), which could be explained by a low number of gram-positive cases (43.75%) and by improper processing of the samples; on many urgent occasions, samples are processed by personnel not pertaining to the Unit. The number of exit orifice infections was very high, but with little repercussion, as only one catheter-dependant case of peritonitis arose; it was caused by Staphylococcus aureus. Nasal swabs were taken from 39 of the 41 patients, and 15.4% were nasal carriers of Staphylococcus aureus.
Membrane suitability and function indicators were acceptable, although the rate of study of peritoneal function was very low, which leads us to reflect on the need for incorporating this test in the protocol for our Unit.
The review of analytical indicators shows that overall, all of the means fall within the suggested margins. Only 68.3% of patients presented an Hb level between 11 and 13g/dl. We must take into account that four patients do not receive any erythropoiesis stimulating agent (ESA), as three presented a level of more than 13g/dl, which therefore is not a modifiable figure according to the treatment. Data from the GCDP show Hb results in the target range in 56.8% of patients at the start of PD and in 58.4% after one year; 25.6% maintained figures within the range throughout the year.10
The marked difference between the resistance indices for erythropoietin and darbepoetin was worthy of note; the standards were met for the first, but not for the second. This could be related to the type of patients who receive one drug or another, since when high ESA doses are required, and in order to avoid multiple doses, patients receive darbepoetin, which could lead to a higher tolerance of darbepoetin than of erythropoietin.
Regarding mineral metabolism, we did reach recommended standards for I-PTH, phosphorus and the calcium-phosphorus product, but not for calcium; only 68.3% of patients maintained levels between 8.4-9.5mg/dl once the figure was adjusted for albumin. Given that the albumin values were also lower than recommended values in 22% of the cases, and considering that these figures are not normally corrected in daily clinical practice except in cases of marked hypoalbuminaemia, this could have led us to underestimate the presence of hypercalcaemia, since only two cases (4.9%) presented lower values than those recommended, while 11 patients (26.8%) had higher values than those recommended. This observation leads us to pay special attention to obtaining a means of adequately measuring calcium, given its involvement in vascular calcifications and morbidity and mortality in CKD patients.
CONCLUSIONS
The application of the Technical-Scientific Quality Plan and Continuous Quality Improvement for Peritoneal Dialysis in our Unit has given us knowledge about the current situation within the Unit and allowed us to ask the questions that are necessary if we are to achieve greater quality in the assistance that we provide. However, the absence of data published by other units on a national level makes it difficult to know if our situation reflects the national situation or if it is an isolated phenomenon. For that reason, we need multi-centre analyses that include more wide-ranging populations that allow us to compare the situation in each Unit with that of other similar populations, contributing to improving results and reducing variability between populations.
Table 1. Overall indicators
Table 2. Transplant indicators
Table 3. Infection indicators
Table 4. Arithmetic mean of the results of analytic indicators
Figure 1.
Figure 2.


