

Current diagnostic methods are not very sensitive to detect the initial stages diabetic nephropathy of type 2. In this work, a review of metabolomic approximation studies for the identification of biomarkers of this disease with potential to differentiate between early stages, evaluate and direct treatment and help slow kidney damage.
MethodsUsing public (Pubmed, and Google Scholar) and private (Scopus and Web of Knowledge) databases, a systematic search of the information published related to metabolomics of diabetic nephropathy in different biospecimens (urine, serum, plasma and blood) was made. Later, the MetaboAnalyst 4.0 software was used to identify the metabolic pathways associated with these metabolites.
ResultsGroups of potential metabolites were identified for monitoring diabetic nephropathy with the available literature data. In the urine, oxide-3-hydroxyisovalerate, TMAO, aconite and citrate and hydroxypropionate derivatives are highlighted; meanwhile, in the serum: citrate, creatinine, arginine and its derivatives; and in the plasma: amino acids such as histidine, methionine and arginine has a potential contribution. Using MetaboAnalyst 4.0 the metabolic pathways related to these metabolites were related.
ConclusionsThe search for biomarkers to measure the progression of diabetic nephropathy, together with analytical strategies for their detection and quantification, are the starting point for designing new methods of clinical chemistry analysis. The association between the metabolic pathway dysfunction could be useful for the overall assessment of the treatment and clinical follow-up of this disease.
Los métodos de diagnóstico actuales son poco sensibles para detectar las etapas iniciales de la nefropatía diabética tipo 2. En este trabajo se hace una revisión de estudios de aproximación metabolómica para la identificación de biomarcadores de esta enfermedad con potencialidad para diferenciar entre etapas tempranas, evaluar y direccionar el tratamiento y coadyuvar a ralentizar el daño renal.
MétodosUtilizando bases de datos públicas (Pubmed,y Google Scholar) y privadas (Scopus y Web of Knowledge), se realizó una búsqueda sistemática de la información que se ha publicado de metabolómica de la nefropatía diabética en distintos bioespecímenes (orina, suero, plasma y sangre). Posteriormente, se utilizó el programa MetaboAnalyst 4.0 para evidenciar las vías metabólicas que están asociadas con estos metabolitos.
ResultadosCon los datos de la literatura se identificaron grupos de metabolitos potenciales para el monitoreo de la nefropatía diabética. Destacan en la orina: el óxido-3-hidroxiisovalerato, TMAO, aconitato y citrato y derivados del hidroxipropionato; en el suero: el citrato, la creatinina, la arginina y sus derivados; y en el plasma: aminoácidos como histidina, metionina y arginina. Utilizando el programa MetaboAnalyst 4.0 se detectaron las rutas metabólicas que están relacionadas con estos metabolitos.
ConclusionesLa búsqueda de biomarcadores relacionados con la progresión de la nefropatía diabética junto con estrategias analíticas para su detección y cuantificación son el punto de partida para el diseño de nuevos métodos de análisis químico-clínico. La correlación con la disfunción de vías metabólicas podría ser utilizada para la evaluación integral del tratamiento y seguimiento clínico de este padecimiento.
Chronic kidney disease (CKD) is a pathophysiological condition that involves the gradual loss of kidney function, a silent disease that does not produce symptoms until it has progressed to advanced stages.1 Type 2 diabetes mellitus (DM2) is one of the main causes of CKD and in the long term it is frequently associated with increased cardiovascular mortality.2 The treatment depends on the degree of progression, in advanced stages patients require hemodialysis and kidney transplantation procedures that entail a reduction in the life expectancy and implies a strong financial investment at the personal level and by the health services.3
The Latin American Society of Nephrology and Hypertension (SLANH) has registered the cases of kidney transplantation during the last 25 years in the countries of this region. The SLANH data reveal a clear increase in the prevalence of end-stage renal disease (ESRD), from 119 patients per million inhabitants in 1991 to 709 patients per million inhabitants in 2014.4 In Mexico, CKD statistics are alarming5; considering that 25% of Mexicans between the ages of 25 and 40 have DM2, the short and medium-term increase in CKD cases is anticipated.6 It is for these reasons that it is urgent to design comprehensive prevention plans to contribute to the well-being of the patient and to avoid complications of the disease.
International organizations such as the Kidney Disease Improving Global Outcomes (KDIGO) have proposed a series of guidelines for the detection of CKD.7 Albuminuria and glomerular filtration rate are measured to diagnose and stratify CKD.
Albuminuria is considered a highly specific marker to diagnose kidney disease since it reveals kidney damage even when glomerular filtration has not decreased.8 Periodic monitoring of the albuminuria level allows to evaluate the nephroprotective response of some therapies or to determine the progression of kidney disease due to a progressive increase in proteinuria. Furthermore, the clinical importance of albuminuria lies in the capacity to predict the prognosis of kidney disease. Higher albuminuria predicts an increase in cardiovascular and all-cause mortality.9 The measurement of urine albumin levels is referred to the urine creatinine concentration through the urinary albumin/creatinine ratio, which establishes a criterion for differentiating the amount of albumin: values between 30 and 300mg/g (previously known as microalbuminuria) and values greater than 300mg/g. In clinical practice, it should be taken into account that, under normal conditions, a minimal amount of plasma protein (less than 30mg, mainly albumin) goes through the glomerular barrier and that some type of disorders such as urinary tract infections or lithiasis may cause this small proteinuria temporarily; in these cases there is also leukocytes in the urinary sediment, which together rule out the progression of CKD.
The glomerular filtration rate (GFR) inform about renal function and alterations in GFR are present if kidney disease occurs, however, the GFR cannot be measured directly. The most accurate method of determining GFR is by administering radioactive compounds to the patient and subsequently monitoring their clearance. Unfortunately, the high cost of this procedure precludes it as a routine method. The inulin clearance is the most accepted exogenous method to estimate GFR, inulin is an ideal marker of filtration with exclusive elimination through glomerular filtration, without tubular secretion or non-renal excretion.10 However, inulin clearance is not performed regularly since it involves intravenous infusions and multiple blood and urine samples, which make it a complicated method for the laboratory. In clinical practice GFR is usually determined by two methods: a) measuring the concentration of serum concentration and its elimination through the urine over a period of time. (eg, creatinine clearance) which indicates the GFR (mGFR); and b) based on the measurement of markers such as creatinine or cystatin C. In this second option, the concentrations of these metabolites are entered as variables in an equation that includes reference values obtained from multiple individuals from a database, considering other parameters such as age, gender, body mass index and ethnic group that allow the calculation of an estimated GFR (eTFG). This is the case of the CKD-EPI or Cockcroft-Gault equations. By including the concentration of creatinine and cystatin C, greater accuracy is obtained in the estimation of GFR (although it is important to note that this is not the case in people with amputations or severe malnutrition). Tthe decrease in GFR indicate the loss of nephrons, however, in very early stages, when the renal damage leads to renal hypertrophy, the loss of nephrons is compensated by renal hyperfiltration, so when the reduction in GFR becomes noticeable, the kidney damage has increased extensively. This is why some years ago, the KDIGO proposed that the determination of eGFR should be done in combination with the measurement of the concentration of protein in the urine (proteinuria) as a way to assess the potential risk of progression.11
Biomarkers of chronic kidney diseaseUnfortunately, elevated levels of both urine albumin and serum creatinine are late markers of CKD that are affected by muscle mass and age. Additionally, the assessment of eGFR values greater than 60mL/min/1.73m2 could be uncertain because it is modified by the medication and the patient's diet, among other factors.12 There are even reports such as that of Lima et al. showing that in diseases such as diabetic nephropathy, the eGFR obtained by formulas based on creatinine and or cystatin C fail to evaluate renal function properly so they suggest considering the use of additional markers such as iohexol.13
In this complex context, the diagnosis and the appropriate classification of CKD in the early stages is a challenge in clinical chemistry. To improve predictive accuracy, various research groups have proposed additional markers for the early detection of CKD. The identification of these new biomarkers has been achieved by using tools based on methods that include modifications in gene expression,14 variations in transcription15 and protein expression,16 as well as changes of metabolites and biomarkers that are related with prevalence or progression of CKD17,18 and even able to anticipate end stage renal disease.19
Among the most recent and relevant contributions is the work on proteomic profiling by Niewczas et al. in which the levels of 194 inflammatory proteins and eGFR were evaluated in diabetic patients with CKD divided into 3 cohorts (discovery, n=219; validation, n=144; and replication, n=162). These authors found a set of 17 proteins that represent a of kidney risk inflammatory signature (KRIS) associated to the development of ESRD after 10 years of diabetic nephropathy. A 35% of these markers belong to the super family of receptors for tumor necrosis factor (TNF), as well as to receptors for proteins involved in the immune response, mainly interleukins. The relevance of these findings is based in the potential application as a clinical test to predict the risk of the progression of diabetic nephropathy to ESRD and, as a follow-up test to evaluate the effectiveness of the applied therapies.20
Metabolomic analysisThe identification of biomarkers associated with a pathological process is one of the central lines of applied metabolomic studies in clinical chemistry. To achieve the description of the metabolomic profile, it is necessary to perform the simultaneous analysis of a large number of metabolites, and consequently, it is essential to use various analytical techniques to differentiate between the enormous diversity of organic compounds that are present in body fluids (urine, blood, saliva, feces, etc.). The analytical techniques commonly used to carry out metabolomic approximation studies applied to clinical practice are gas chromatography (GC), liquid chromatography (LC),21 mass spectrometry (MS)22 and nuclear magnetic resonance (NMR).23
Once the data have been obtained (in the form of chromatograms, mass spectrum or NMR), it is essential to access public databases such as Human Metabolomic Data Base (HMDB) or METLIN Metabolomics Database (METLIN) or private and commercial libraries of NMR and MS data to identify the metabolites present in the sample.24 Finally, the chromatographic, spectrometric and spectroscopic data generated by the techniques of GC, LC, MS and NMR, respectively, must undergo statistical analysis in order to discriminate between similarities or establish differences between a state of health (healthy or control) and the pathology under study. Regardless of the technique applied, it is necessary to perform the identification of differential metabolites.25 Processing such a vast amount obtained from the different analytical procedures, requires the use multivariate analysis test. Some of the most widely used for their accessibility are Principal Component Analysis (PCA) and Partial Least Squares Analysis (PLS-DA), use on specialized computer programs.26
Metabolomics in the study of chronic kidney diseaseThe usefulness of metabolomics to study CKD has been highlighted in recent years.27 Various review articles have shown the correlations between the progression of CKD and the presence of specific metabolites in patients with different stages of CKD.28,29 Altered concentrations of various metabolites have been found to be associated with the incidence and complications of kidney disease. For example, the metabolomic analysis of serum and plasma samples from patients affected with CKD has allowed the identification of differential metabolites such as uric acid, 4-hydroxymandelate, 3-methyladipate, cytosine, homogentisate, threonine, methionine, phenylalanine, arginine, sulfoxide of methionine, symmetric and asymmetric dimethylarginines, glucose, citrate, lactate, valine alanine, glutamate, glycine, myoinositol, taurine, glycerylphosphorylcholine and trimethylamine N-oxide (TMAO).30 In particular, it has also been reported that patients with advanced stages of CKD present variations in metabolites such as 3-methylhistidine, myoinositol, p-cresol sulfate, hippuric acid and arginine-derived compounds. Additionally, other studies have evaluated the predictive potential of early diagnostic biomarkers of CKD such as C-mannosyltryptophan, pseudouridine, N-acetylalanine, erythronate, myoinositol, N-acetylcarnosine, spermidine, and the kinurenine/tryptophan ratio as they are strongly associated with the eGFR.31 To date, through analysis strategies based on metabolomic approximation studies, the different stages of CKD have been described, most often the intermediate and advanced stages. The results obtained in the urinalysis have allowed the identification of metabolites such as 5-oxoproline, guanidinoacetate, glutamate, homoarginine, α-phenyl-acetylglutamine, taurine, citrate, threonine and trimethylamine N-oxide, which could be used to monitor progression and to develop an analytical method for early detection of the disease.17 Specifically, levels of trimethylamine N-oxide have been shown to be strongly associated with the degree of impaired kidney function in CKD patients.32 Regarding the progression to end stage renal diasease (ESRD), investigations have been carried out to find associations between the metabolomic profile obtained from GC-MS analysis and the mortality at this stage. Titan et al. recently reported that in a group of patients with an average eGFR of 38.4±14.6mL/min/1.73m2 and a 57% diabetics, there were identified plasma metabolites linked with the progression to ESRD such as lactose, 2-O-glycerol-alpha-d-galactopyranoside, d-threitol, d-mannitol and myo-inositol. Additionally, the plasma metabolites that correlated with the death of the patient were malic acid, acetohydroxamic acid, butanoic acid and docosahexaenoic acid, ribose, l-glutamine, transaconitic acid and lactose.33 In patients with type 1 diabetes mellitus (DM1) and stage 3 CKD, Niewczas et al. examined the serum metabolomic profiles of 158 individuals for an average of 11 years to establish a correlation with progression to ESRD. As a result of this work, more than a hundred serum metabolites were identified, however, only 7 of them, C-glycosyltryptophan, pseudouridine, O-sulfotyrosine, N-acetyl threonine, N-acetylserine, N6-carbamoylthreonyladenosine and N6-acetyl-lysine, were associated with loss of kidney function due to tubular damage and progression to ERT, so these metabolites could potentially be useful as biomarkers of progression to ERT in patients with DM.34 Metabolomics reports showing a correlation between metabolomics and the evolution and development of ESRD in diabetic nephropathy are still scarce. Such studies are essential to know at the molecular level what are the consequences of the physiological alterations produced by this disease and establish whether there are differences between ESRD associated with DM1 and DM2.
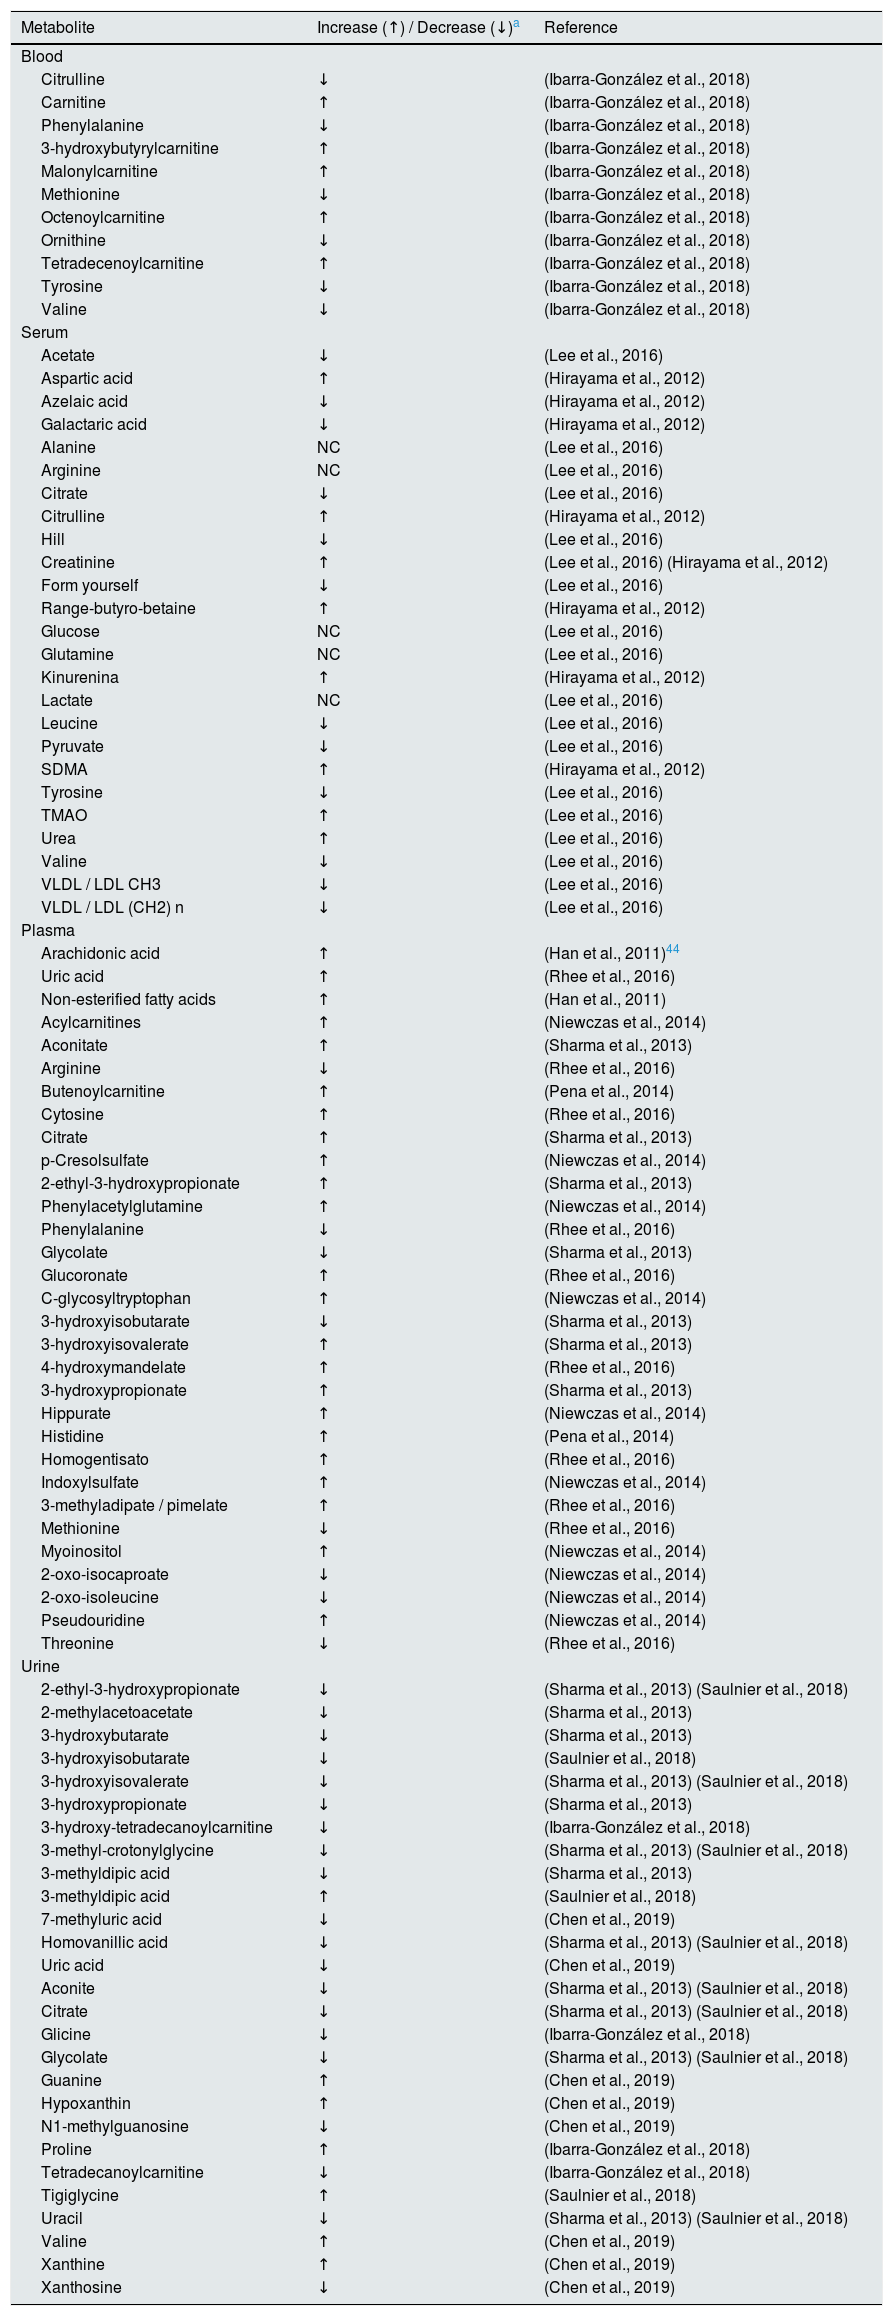
Metabolomics applied to the study of diabetic nephropathySustained hyperglycemia is strongly related to the progressive deterioration of renal function to end-stage renal failure. That is why various authors have made an approach based on metabolomic studies to find associations between the progression of kidney damage and the reduction of eGFR in the diabetic population.35 Next, we review the data obtained from metabolomic studies in blood, serum, plasma and urine from patients with DM2 nephropathy. As a summary, Table 1 shows the list of compounds identified in different metabolomic studies in individuals with diabetic nephropathy, considering the 4 biospecimens that were included in this review: blood, serum, plasma and urine.
Compounds identified in metabolomics studies of blood, serum, plasma, and urine of diabetic patients with chronic kidney disease.
| Metabolite | Increase (↑) / Decrease (↓)a | Reference |
|---|---|---|
| Blood | ||
| Citrulline | ↓ | (Ibarra-González et al., 2018) |
| Carnitine | ↑ | (Ibarra-González et al., 2018) |
| Phenylalanine | ↓ | (Ibarra-González et al., 2018) |
| 3-hydroxybutyrylcarnitine | ↑ | (Ibarra-González et al., 2018) |
| Malonylcarnitine | ↑ | (Ibarra-González et al., 2018) |
| Methionine | ↓ | (Ibarra-González et al., 2018) |
| Octenoylcarnitine | ↑ | (Ibarra-González et al., 2018) |
| Ornithine | ↓ | (Ibarra-González et al., 2018) |
| Tetradecenoylcarnitine | ↑ | (Ibarra-González et al., 2018) |
| Tyrosine | ↓ | (Ibarra-González et al., 2018) |
| Valine | ↓ | (Ibarra-González et al., 2018) |
| Serum | ||
| Acetate | ↓ | (Lee et al., 2016) |
| Aspartic acid | ↑ | (Hirayama et al., 2012) |
| Azelaic acid | ↓ | (Hirayama et al., 2012) |
| Galactaric acid | ↓ | (Hirayama et al., 2012) |
| Alanine | NC | (Lee et al., 2016) |
| Arginine | NC | (Lee et al., 2016) |
| Citrate | ↓ | (Lee et al., 2016) |
| Citrulline | ↑ | (Hirayama et al., 2012) |
| Hill | ↓ | (Lee et al., 2016) |
| Creatinine | ↑ | (Lee et al., 2016) (Hirayama et al., 2012) |
| Form yourself | ↓ | (Lee et al., 2016) |
| Range-butyro-betaine | ↑ | (Hirayama et al., 2012) |
| Glucose | NC | (Lee et al., 2016) |
| Glutamine | NC | (Lee et al., 2016) |
| Kinurenina | ↑ | (Hirayama et al., 2012) |
| Lactate | NC | (Lee et al., 2016) |
| Leucine | ↓ | (Lee et al., 2016) |
| Pyruvate | ↓ | (Lee et al., 2016) |
| SDMA | ↑ | (Hirayama et al., 2012) |
| Tyrosine | ↓ | (Lee et al., 2016) |
| TMAO | ↑ | (Lee et al., 2016) |
| Urea | ↑ | (Lee et al., 2016) |
| Valine | ↓ | (Lee et al., 2016) |
| VLDL / LDL CH3 | ↓ | (Lee et al., 2016) |
| VLDL / LDL (CH2) n | ↓ | (Lee et al., 2016) |
| Plasma | ||
| Arachidonic acid | ↑ | (Han et al., 2011)44 |
| Uric acid | ↑ | (Rhee et al., 2016) |
| Non-esterified fatty acids | ↑ | (Han et al., 2011) |
| Acylcarnitines | ↑ | (Niewczas et al., 2014) |
| Aconitate | ↑ | (Sharma et al., 2013) |
| Arginine | ↓ | (Rhee et al., 2016) |
| Butenoylcarnitine | ↑ | (Pena et al., 2014) |
| Cytosine | ↑ | (Rhee et al., 2016) |
| Citrate | ↑ | (Sharma et al., 2013) |
| p-Cresolsulfate | ↑ | (Niewczas et al., 2014) |
| 2-ethyl-3-hydroxypropionate | ↑ | (Sharma et al., 2013) |
| Phenylacetylglutamine | ↑ | (Niewczas et al., 2014) |
| Phenylalanine | ↓ | (Rhee et al., 2016) |
| Glycolate | ↓ | (Sharma et al., 2013) |
| Glucoronate | ↑ | (Rhee et al., 2016) |
| C-glycosyltryptophan | ↑ | (Niewczas et al., 2014) |
| 3-hydroxyisobutarate | ↓ | (Sharma et al., 2013) |
| 3-hydroxyisovalerate | ↑ | (Sharma et al., 2013) |
| 4-hydroxymandelate | ↑ | (Rhee et al., 2016) |
| 3-hydroxypropionate | ↑ | (Sharma et al., 2013) |
| Hippurate | ↑ | (Niewczas et al., 2014) |
| Histidine | ↑ | (Pena et al., 2014) |
| Homogentisato | ↑ | (Rhee et al., 2016) |
| Indoxylsulfate | ↑ | (Niewczas et al., 2014) |
| 3-methyladipate / pimelate | ↑ | (Rhee et al., 2016) |
| Methionine | ↓ | (Rhee et al., 2016) |
| Myoinositol | ↑ | (Niewczas et al., 2014) |
| 2-oxo-isocaproate | ↓ | (Niewczas et al., 2014) |
| 2-oxo-isoleucine | ↓ | (Niewczas et al., 2014) |
| Pseudouridine | ↑ | (Niewczas et al., 2014) |
| Threonine | ↓ | (Rhee et al., 2016) |
| Urine | ||
| 2-ethyl-3-hydroxypropionate | ↓ | (Sharma et al., 2013) (Saulnier et al., 2018) |
| 2-methylacetoacetate | ↓ | (Sharma et al., 2013) |
| 3-hydroxybutarate | ↓ | (Sharma et al., 2013) |
| 3-hydroxyisobutarate | ↓ | (Saulnier et al., 2018) |
| 3-hydroxyisovalerate | ↓ | (Sharma et al., 2013) (Saulnier et al., 2018) |
| 3-hydroxypropionate | ↓ | (Sharma et al., 2013) |
| 3-hydroxy-tetradecanoylcarnitine | ↓ | (Ibarra-González et al., 2018) |
| 3-methyl-crotonylglycine | ↓ | (Sharma et al., 2013) (Saulnier et al., 2018) |
| 3-methyldipic acid | ↓ | (Sharma et al., 2013) |
| 3-methyldipic acid | ↑ | (Saulnier et al., 2018) |
| 7-methyluric acid | ↓ | (Chen et al., 2019) |
| Homovanillic acid | ↓ | (Sharma et al., 2013) (Saulnier et al., 2018) |
| Uric acid | ↓ | (Chen et al., 2019) |
| Aconite | ↓ | (Sharma et al., 2013) (Saulnier et al., 2018) |
| Citrate | ↓ | (Sharma et al., 2013) (Saulnier et al., 2018) |
| Glicine | ↓ | (Ibarra-González et al., 2018) |
| Glycolate | ↓ | (Sharma et al., 2013) (Saulnier et al., 2018) |
| Guanine | ↑ | (Chen et al., 2019) |
| Hypoxanthin | ↑ | (Chen et al., 2019) |
| N1-methylguanosine | ↓ | (Chen et al., 2019) |
| Proline | ↑ | (Ibarra-González et al., 2018) |
| Tetradecanoylcarnitine | ↓ | (Ibarra-González et al., 2018) |
| Tigiglycine | ↑ | (Saulnier et al., 2018) |
| Uracil | ↓ | (Sharma et al., 2013) (Saulnier et al., 2018) |
| Valine | ↑ | (Chen et al., 2019) |
| Xanthine | ↑ | (Chen et al., 2019) |
| Xanthosine | ↓ | (Chen et al., 2019) |
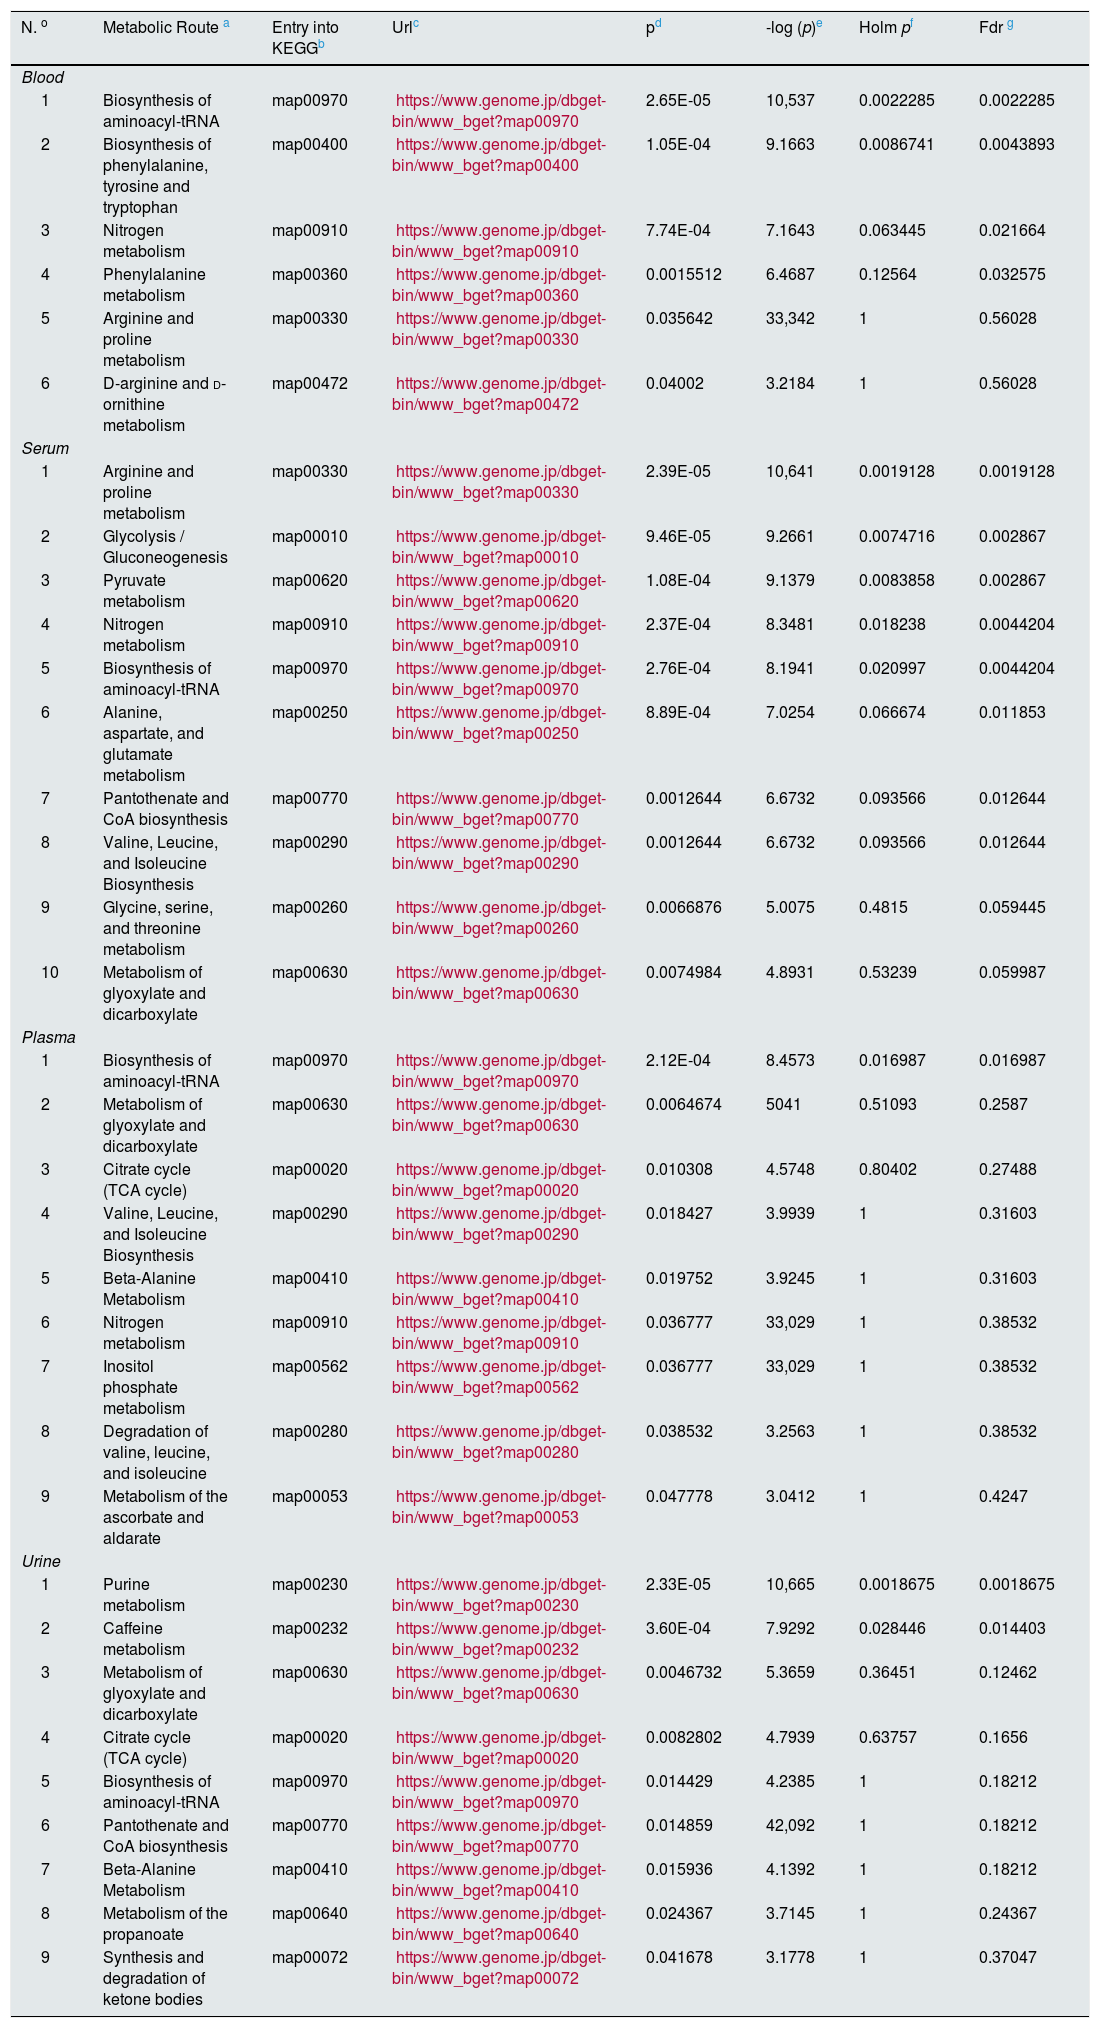
Finally, to extract information of the “metabolomic flow” that is being affected by the development of diabetic nephropathy and direct the identification of metabolites towards the global interpretation of biochemical changes, it was utilized the MetaboAnalyst 4.0 program through the Pathway Analysis tool.36 This program uses the information deposited in databases such as KEGG (http://www.genome.jp/kegg/), PubChem (https://pubchem.ncbi.nlm.nih.gov/) and the database of the human metabolome (Human Metabolome Database, http://www.hmdb.ca) to generate graphs of correlation with of the metabolic pathway that is affected providing the P-value. The impact value of the pathway is established through a topology analysis based on the importance of the metabolite within the route, that is, a metabolite that acts as a key point in a route causes a greater impact if the concentration has been modified. In addition, significance is established from an enrichment analysis of the pathway and the weight calculated for each metabolite within a data set. Greater significance and a high P-value correlate with a greater impact on metabolic flow.37 Therefore, the correlation graph of significance in the affectation of metabolic pathway vs. -log (p) both the size and the color of the circles are related to different levels of significance (the color gradient from white to yellow and then to red indicates an increase in the affectation), as it is observed in the different graphs of the Fig. 1. Table 2 provides additional statistical data of the metabolic pathways that had a greater significance.
![Graphs of correlation of significance affectation of the metabolic pathway [Impact in the path vs. -log (p)] obtained with the Pathway Analysis module of the MetaboAnalyst 4.0 program, of the metabolites that have been identified in different specimens in patients with diabetic nephropathy: A. Blood: (1) Aminoacyl-tRNA biosynthesis; (2) Biosynthesis of phenylalanine, tyrosine and tryptophan; (3) Nitrogen metabolism; (4) Metabolism of phenylalanine; (5) Arginine and proline metabolism; (6) Arginine and ornithine metabolism. B. Serum: (1) Arginine. and proline metabolism; (2) Glycogenesis or gluconeogenesis; (3) Metabolism of pyruvate; (4) Nitrogen metabolism; (5) Biosynthesis of aminoacyl-tRNA; (6) Metabolism of alanine, aspartate and glutamate; (7) Biosynthesis of pantothenate and CoA; (8) Biosynthesis of valine, leucine and isoleucine; (9) Glycine, serine, and threonine metabolism; (10) Metabolism of glyoxylate and dicarboxylate.C. Plasma: (1) Aminoacyl-tRNA biosynthesis; (2) Glyoxalate and dicarboxylate metabolism; (3) Citric acid cycle; (4) Biosynthesis of valine, leucine and isoleucine; (5) Metabolism of beta-alanine; (6) Nitrogen metabolism; (7) Inositol phosphate metabolism; (8) Degradation of valine, leucine and isoleucine; (9) Ascorbate and aldarate metabolism.D. Urine: (1) Purine metabolism; (2) Caffeine metabolism; (3) Glyoxylate and dicarboxylate metabolism; (4) Citric acid cycle; (5) Biosynthesis of aminoacyl-tRNA; (6) Biosynthesis of pantothenate and CoA; (7) Beta-alanine metabolism; (8) Metabolism of the propanoate; (9) Synthesis and degradation of ketone bodies. The color of the circles: from white (less) to red (more) and the size (from small to large) represent the different levels of significance. A high -log (p) value means a greater impact on metabolic flow. The routes with the greatest significance were selected from the impact values of the route or P-value (P<.05).](https://static.elsevier.es/multimedia/20132514/0000004000000006/v1_202012250708/S2013251420301462/v1_202012250708/en/main.assets/gr1.jpeg?xkr=ue/ImdikoIMrsJoerZ+w92lL8PRnKGMnsiVXV6EVJ5QRkjJZIKj2umwUyY+cL6K8cyMCoG0zLrx/ORKa7YTjKZZ/7892wCSeqkfByHYuW7gUjUtuOECMw1CfuVNp6SldXFWyBIxIgN4fyN7k91XIjRACOCiozZJUtYPf6OGrZgEzY4e+LU4KOVDcu/G1aYX1fcdvyuU1XpErgYK4neEW71uMiNxdQoXDWxeR/RKoNxH2QUoWP0385BgBHhMOSUmSElJeTyI7JqXbldD7GapINguN2Mfmhvn3Uqc235nFHyArGt+zphF+FEnHGdJdeTyH "Graphs of correlation of significance affectation of the metabolic pathway [Impact in the path vs. -log (p)] obtained with the Pathway Analysis module of the MetaboAnalyst 4.0 program, of the metabolites that have been identified in different specimens in patients with diabetic nephropathy: A. Blood: (1) Aminoacyl-tRNA biosynthesis; (2) Biosynthesis of phenylalanine, tyrosine and tryptophan; (3) Nitrogen metabolism; (4) Metabolism of phenylalanine; (5) Arginine and proline metabolism; (6) Arginine and ornithine metabolism. B. Serum: (1) Arginine. and proline metabolism; (2) Glycogenesis or gluconeogenesis; (3) Metabolism of pyruvate; (4) Nitrogen metabolism; (5) Biosynthesis of aminoacyl-tRNA; (6) Metabolism of alanine, aspartate and glutamate; (7) Biosynthesis of pantothenate and CoA; (8) Biosynthesis of valine, leucine and isoleucine; (9) Glycine, serine, and threonine metabolism; (10) Metabolism of glyoxylate and dicarboxylate.C. Plasma: (1) Aminoacyl-tRNA biosynthesis; (2) Glyoxalate and dicarboxylate metabolism; (3) Citric acid cycle; (4) Biosynthesis of valine, leucine and isoleucine; (5) Metabolism of beta-alanine; (6) Nitrogen metabolism; (7) Inositol phosphate metabolism; (8) Degradation of valine, leucine and isoleucine; (9) Ascorbate and aldarate metabolism.D. Urine: (1) Purine metabolism; (2) Caffeine metabolism; (3) Glyoxylate and dicarboxylate metabolism; (4) Citric acid cycle; (5) Biosynthesis of aminoacyl-tRNA; (6) Biosynthesis of pantothenate and CoA; (7) Beta-alanine metabolism; (8) Metabolism of the propanoate; (9) Synthesis and degradation of ketone bodies. The color of the circles: from white (less) to red (more) and the size (from small to large) represent the different levels of significance. A high -log (p) value means a greater impact on metabolic flow. The routes with the greatest significance were selected from the impact values of the route or P-value (P<.05).")
Graphs of correlation of significance affectation of the metabolic pathway [Impact in the path vs. -log (p)] obtained with the Pathway Analysis module of the MetaboAnalyst 4.0 program, of the metabolites that have been identified in different specimens in patients with diabetic nephropathy: A. Blood: (1) Aminoacyl-tRNA biosynthesis; (2) Biosynthesis of phenylalanine, tyrosine and tryptophan; (3) Nitrogen metabolism; (4) Metabolism of phenylalanine; (5) Arginine and proline metabolism; (6) Arginine and ornithine metabolism. B. Serum: (1) Arginine. and proline metabolism; (2) Glycogenesis or gluconeogenesis; (3) Metabolism of pyruvate; (4) Nitrogen metabolism; (5) Biosynthesis of aminoacyl-tRNA; (6) Metabolism of alanine, aspartate and glutamate; (7) Biosynthesis of pantothenate and CoA; (8) Biosynthesis of valine, leucine and isoleucine; (9) Glycine, serine, and threonine metabolism; (10) Metabolism of glyoxylate and dicarboxylate.C. Plasma: (1) Aminoacyl-tRNA biosynthesis; (2) Glyoxalate and dicarboxylate metabolism; (3) Citric acid cycle; (4) Biosynthesis of valine, leucine and isoleucine; (5) Metabolism of beta-alanine; (6) Nitrogen metabolism; (7) Inositol phosphate metabolism; (8) Degradation of valine, leucine and isoleucine; (9) Ascorbate and aldarate metabolism.D. Urine: (1) Purine metabolism; (2) Caffeine metabolism; (3) Glyoxylate and dicarboxylate metabolism; (4) Citric acid cycle; (5) Biosynthesis of aminoacyl-tRNA; (6) Biosynthesis of pantothenate and CoA; (7) Beta-alanine metabolism; (8) Metabolism of the propanoate; (9) Synthesis and degradation of ketone bodies. The color of the circles: from white (less) to red (more) and the size (from small to large) represent the different levels of significance. A high -log (p) value means a greater impact on metabolic flow. The routes with the greatest significance were selected from the impact values of the route or P-value (P<.05).
Metabolic pathways affected in diabetic nephropathy from the data of the differential metabolites of each biospecimen using the "Pathway analysis" module of the MetaboAnalyst 4.0 programa.
| N. o | Metabolic Route a | Entry into KEGGb | Urlc | pd | -log (p)e | Holm pf | Fdr g |
|---|---|---|---|---|---|---|---|
| Blood | |||||||
| 1 | Biosynthesis of aminoacyl-tRNA | map00970 | https://www.genome.jp/dbget-bin/www_bget?map00970 | 2.65E-05 | 10,537 | 0.0022285 | 0.0022285 |
| 2 | Biosynthesis of phenylalanine, tyrosine and tryptophan | map00400 | https://www.genome.jp/dbget-bin/www_bget?map00400 | 1.05E-04 | 9.1663 | 0.0086741 | 0.0043893 |
| 3 | Nitrogen metabolism | map00910 | https://www.genome.jp/dbget-bin/www_bget?map00910 | 7.74E-04 | 7.1643 | 0.063445 | 0.021664 |
| 4 | Phenylalanine metabolism | map00360 | https://www.genome.jp/dbget-bin/www_bget?map00360 | 0.0015512 | 6.4687 | 0.12564 | 0.032575 |
| 5 | Arginine and proline metabolism | map00330 | https://www.genome.jp/dbget-bin/www_bget?map00330 | 0.035642 | 33,342 | 1 | 0.56028 |
| 6 | D-arginine and d-ornithine metabolism | map00472 | https://www.genome.jp/dbget-bin/www_bget?map00472 | 0.04002 | 3.2184 | 1 | 0.56028 |
| Serum | |||||||
| 1 | Arginine and proline metabolism | map00330 | https://www.genome.jp/dbget-bin/www_bget?map00330 | 2.39E-05 | 10,641 | 0.0019128 | 0.0019128 |
| 2 | Glycolysis / Gluconeogenesis | map00010 | https://www.genome.jp/dbget-bin/www_bget?map00010 | 9.46E-05 | 9.2661 | 0.0074716 | 0.002867 |
| 3 | Pyruvate metabolism | map00620 | https://www.genome.jp/dbget-bin/www_bget?map00620 | 1.08E-04 | 9.1379 | 0.0083858 | 0.002867 |
| 4 | Nitrogen metabolism | map00910 | https://www.genome.jp/dbget-bin/www_bget?map00910 | 2.37E-04 | 8.3481 | 0.018238 | 0.0044204 |
| 5 | Biosynthesis of aminoacyl-tRNA | map00970 | https://www.genome.jp/dbget-bin/www_bget?map00970 | 2.76E-04 | 8.1941 | 0.020997 | 0.0044204 |
| 6 | Alanine, aspartate, and glutamate metabolism | map00250 | https://www.genome.jp/dbget-bin/www_bget?map00250 | 8.89E-04 | 7.0254 | 0.066674 | 0.011853 |
| 7 | Pantothenate and CoA biosynthesis | map00770 | https://www.genome.jp/dbget-bin/www_bget?map00770 | 0.0012644 | 6.6732 | 0.093566 | 0.012644 |
| 8 | Valine, Leucine, and Isoleucine Biosynthesis | map00290 | https://www.genome.jp/dbget-bin/www_bget?map00290 | 0.0012644 | 6.6732 | 0.093566 | 0.012644 |
| 9 | Glycine, serine, and threonine metabolism | map00260 | https://www.genome.jp/dbget-bin/www_bget?map00260 | 0.0066876 | 5.0075 | 0.4815 | 0.059445 |
| 10 | Metabolism of glyoxylate and dicarboxylate | map00630 | https://www.genome.jp/dbget-bin/www_bget?map00630 | 0.0074984 | 4.8931 | 0.53239 | 0.059987 |
| Plasma | |||||||
| 1 | Biosynthesis of aminoacyl-tRNA | map00970 | https://www.genome.jp/dbget-bin/www_bget?map00970 | 2.12E-04 | 8.4573 | 0.016987 | 0.016987 |
| 2 | Metabolism of glyoxylate and dicarboxylate | map00630 | https://www.genome.jp/dbget-bin/www_bget?map00630 | 0.0064674 | 5041 | 0.51093 | 0.2587 |
| 3 | Citrate cycle (TCA cycle) | map00020 | https://www.genome.jp/dbget-bin/www_bget?map00020 | 0.010308 | 4.5748 | 0.80402 | 0.27488 |
| 4 | Valine, Leucine, and Isoleucine Biosynthesis | map00290 | https://www.genome.jp/dbget-bin/www_bget?map00290 | 0.018427 | 3.9939 | 1 | 0.31603 |
| 5 | Beta-Alanine Metabolism | map00410 | https://www.genome.jp/dbget-bin/www_bget?map00410 | 0.019752 | 3.9245 | 1 | 0.31603 |
| 6 | Nitrogen metabolism | map00910 | https://www.genome.jp/dbget-bin/www_bget?map00910 | 0.036777 | 33,029 | 1 | 0.38532 |
| 7 | Inositol phosphate metabolism | map00562 | https://www.genome.jp/dbget-bin/www_bget?map00562 | 0.036777 | 33,029 | 1 | 0.38532 |
| 8 | Degradation of valine, leucine, and isoleucine | map00280 | https://www.genome.jp/dbget-bin/www_bget?map00280 | 0.038532 | 3.2563 | 1 | 0.38532 |
| 9 | Metabolism of the ascorbate and aldarate | map00053 | https://www.genome.jp/dbget-bin/www_bget?map00053 | 0.047778 | 3.0412 | 1 | 0.4247 |
| Urine | |||||||
| 1 | Purine metabolism | map00230 | https://www.genome.jp/dbget-bin/www_bget?map00230 | 2.33E-05 | 10,665 | 0.0018675 | 0.0018675 |
| 2 | Caffeine metabolism | map00232 | https://www.genome.jp/dbget-bin/www_bget?map00232 | 3.60E-04 | 7.9292 | 0.028446 | 0.014403 |
| 3 | Metabolism of glyoxylate and dicarboxylate | map00630 | https://www.genome.jp/dbget-bin/www_bget?map00630 | 0.0046732 | 5.3659 | 0.36451 | 0.12462 |
| 4 | Citrate cycle (TCA cycle) | map00020 | https://www.genome.jp/dbget-bin/www_bget?map00020 | 0.0082802 | 4.7939 | 0.63757 | 0.1656 |
| 5 | Biosynthesis of aminoacyl-tRNA | map00970 | https://www.genome.jp/dbget-bin/www_bget?map00970 | 0.014429 | 4.2385 | 1 | 0.18212 |
| 6 | Pantothenate and CoA biosynthesis | map00770 | https://www.genome.jp/dbget-bin/www_bget?map00770 | 0.014859 | 42,092 | 1 | 0.18212 |
| 7 | Beta-Alanine Metabolism | map00410 | https://www.genome.jp/dbget-bin/www_bget?map00410 | 0.015936 | 4.1392 | 1 | 0.18212 |
| 8 | Metabolism of the propanoate | map00640 | https://www.genome.jp/dbget-bin/www_bget?map00640 | 0.024367 | 3.7145 | 1 | 0.24367 |
| 9 | Synthesis and degradation of ketone bodies | map00072 | https://www.genome.jp/dbget-bin/www_bget?map00072 | 0.041678 | 3.1778 | 1 | 0.37047 |
For each metabolic pathway, the registration code is indicated in the KEGG database together with the corresponding URL.
For each metabolic pathway, the registration code is indicated in the KEGG database together with the corresponding URL.
The P-value calculated to analyze the metabolic pathway reflects the probability of obtaining a difference equal to or greater than that observed when the null hypothesis is true.
Holm p is the value of significance dependent on the number of comparisons adjusted to the P-value using the Holm Bonferroni method; this statistical test is used in multiple comparisons to control for type I errors associated with the alpha level.
FDR (False Discovery Rate) is the probability that a null hypothesis is true having been rejected by the statistical test; It is used as a statistical tool in multiple correlations to identify type I errors. In the global analysis of the data, increased values (close to 1) of both Holm p and FDR could indicate a false positive.
Recent studies have focused on the evaluation of the metabolomic strategies for the development of models that could improve the prediction of kidney damage in diabetic nephropathy, through the analysis of blood samples. Ibarra-González et al. conducted a study with blood as a biological matrix, and applying an EM directed metabolomics procedure and evaluated 11 amino acids and 30 acylcarnitines. The metabolites that showed a correlation with albuminuria and eGFR were citrulline, carnitine, glutaryl + 3-hydroxyhexanoyl carnitine, hexanoylcarnitine, octanoylcarnitine, octenoylcarnitine, tetradecenoylcarnitine, hexadecenoylcarnitine, hexadecenoylcarnitine, 3-hydrocarnitine-3-hydrocarnitine-3-hydrocarnitanoyldecanoxycarnitine-3-hydrocarnitine-3-hydrocarnitine-3-hydrocarnitine-decananoyl – carnitine.38 In Fig. 1 a scatter plot shows the metabolic pathways in which these metabolites are involved, except those associated with lipoproteins. For details of each route and statistical data of the affectation, see Table 2.
SerumIn a study based on the use of capillary electrophoresis coupled to a mass spectrometer, a panel of candidate markers was identified to distinguish the stages of kidney damage in diabetic patients as a potential tool for the diagnosis of diabetic nephropathy. These metabolites were: aspartic acid, azelaic acid, mucic acid, creatinine, citrulline, gamma-butyrocreatinine, kynurenine and symmetric dimethylarginine (SDMA).39 Reports of the serum metabolomic fingerprint of CKD associated to DM2T have identified by NMR spectroscopy altered levels of uremic toxins (creatinine, TMAO and urea), amino acids such as leucine, arginine, glutamine, valine, tyrosine, and others metabolites such as citrate, pyruvate, formate, choline, as well as the ratio of very low-density lipoproteins (VLDL) to low-density (LDL-CH3).40 In the scatter plot shown Fig. 1B represents the dispersion of metabolic pathways in which these metabolites are involved. In this graph the size and color of the circles are related to the degree of significance. For details of each route and statistical data of the affectation, see Table 2.
PlasmaA metabolomic study by GC coupled to MS of the plasma levels of metabolites in patients with diabetes and CKD compared to a control group of healthy individuals showed significant differences in 3-hydroxyisovalerate, aconitate, citrate, 2-ethyl-3-hydroxypropionate, glycolate, 3-hydroxyisobutarate and 3-hydroxypropionate.41
An additional study of plasma also by GC-MS but directed at the profiles of esterified and non-esterified fatty acids showed that these metabolites could be useful to monitor the progression of kidney damage in patients with DM.42
Aiming to achieve methods of prevention and monitoring of the treatment in patients with DM2 and risk of albuminuria, Pena et al. conducted a metabolomic study based on high-resolution MS methods to evaluate the profile of plasma metabolites and the development of microalbuminuria to albuminuria. They found that in plasma, histidine and butenoylcarnitine levels were different in cases vs controls, therefore they were considered potential biomarkers to predict progression.43
In another study carried out with a cohort of patients in which 55% of them had diabetes, plasma samples were taken and analyzed by LC coupled to MS. It was found that the threonine, methionine, phenylalanine, arginine, uric acid, glucuronate, 4-hydroxymandelate, 3-methyladipate, homogentisate and cytosine were associated to rapid progression of CKD.44
The scatter plot shown in Fig. 1C represent the metabolic pathways in which these metabolites are nvolved. The size and color of the circles are related to the significance value. For details of each route and statistical data of the affectation, see Table 2.
UrineMetabolomic analysis of urine using GC coupled to MS in which 94 urinary metabolites were quantified in cohorts of patients diagnosed with DM with and without CKD, show that 13 of these metabolites: 3-hydroxyisovalerate, aconitate, citrate, 2-ethyl-3-hydroxypropionate, glycolate, homovanillic acid, 3-hydroxyisobutarate, 2-methylacetoacetate, 3-methyl dipic acid, 3-methylcrotonylglycine, 3-hydroxypropionate, tiglycine and uracil, were statistically different between these two study groups. It should be noted that 12 of these metabolites are involved in mitochondrial metabolism, which is why the authors suggest that these results reveal that renal organic ion transport and mitochondrial function are deregulated in diabetic nephropathy.41
Additionally, the correlation between urinary metabolites and renal structure in patients with DM2 indicated that glycolic and aconitic acids are related to GFR.45 In the study of metabolomics by MS carried out by Ibarra-González et al. previously mentioned in the "Blood" section, urine samples were also analyzed. These authors found that glycine, proline, tetradecanoylcarnitine and 3-hydroxy-tetradecanoylcartine showed a correlation with the level of albuminuria and eGFR.38
Fig. 1D shows the scatter plot of the metabolic pathways in which these metabolites are involved. The size and color of the circles are related to the significance value. For details of each route and statistical data of the affectation, see Table 2.
ConclusionsDM2 is the leading cause of ESRD worldwide and in Mexico it is estimated that it generates 55% of cases. In diabetic patients, ESRD is the consequence of the progressive loss of kidney function caused mainly by hyperglycemia, obesity and cardiovascular diseases. The increasing incidence of DM2, the high cost of treatments mainly at the final stages of diabetic nephropathy, and the poor quality of life of patients, justify the need to identify the initiation of the disease. A minimally invasive innovative strategy to identify biomarkers associated with progression is provided by metabolomics, since this type of analysis is able to inform about individual´s health condition by analyzing mainly serum, plasma and urine samples. Based on the information currently available from metabolomics analysis in serum, plasma and urine there have been identified potential groups of metabolites useful for the monitoring and follow-up of progression of renal damage in diabetics. These include derivatives of short chain hydroxycarboxylates, TMAO, aconitate and citrate in urine; citrate, arginine and their derivatives in serum; and amino acids such as histidine, methionine, and arginine in plasma. The repeated identification of dysfunction in metabolic pathways related to the synthesis and degradation of amino acids, as well as to the citric acid cycle, are the evidence of the imbalance of the cellular processes that occur in this disease.
AuthorshipAll authors participated in (1) the conception and design of the study, the analysis and interpretation of the data, (2) the draft of the article or the critical review of the intellectual content, and (3) the final approval of the version, that is presented.
Conflicts of interestThe authors declare that there is no conflict of interest related to this work.
ThanksThis work was supported with resources from the CONACYT-MEXICO Project for Attention to National Problems Number 2017-01-5652.
Please cite this article as: Cordero-Pérez P, Sánchez-Martínez C, García-Hernández PA, Saucedo AL. Metabolómica de la nefropatía diabética: tras la huella de indicadores de desarrollo y progresión. Nefrologia. 2020;40:585–596.


