

The scientific Registries (RE) in renal transplantation (Tx) are very useful since they allow us to identify risk factors in this population and facilitate contrasting the information with other national and international registries, contributing to establishing strategies which improve outcomes in terms of survival. They constitute an organized and planned system that uses observational methods and standardized systematic processes, including adjusted risk models, to essentially evaluate survival outcomes. The scientific RE are complemented with clinical trials providing scientific evidence, but inexcusably need adequate statistical analysis to generate reliable clinical data that contribute to optimizing the prognosis of the transplant population. In addition, scientific RE provide valuable information on the performance of Tx programs and help generate prognostic indexes, which could contribute to improving survival. Under these prerequisites, this review will assess the following aspects related to the scientific RE in the Tx: (1) the concept and importance of implementing RE in Tx; (2) the measures that are needed for the correct execution of the scientific RE; (3) the benefits, quality and limitations of RE; (4) the statistical tools for the adequate analysis of survival; and (5) utility of RE in the evaluation of performance, quality and surveillance of transplant programs and the generation of comorbidity indices.
Los registros (RE) científicos en trasplante (Tx) renal son muy útiles dado que nos permiten identificar factores de riesgo en esta población y facilitan contrastar la información con otros registros nacionales e internacionales, pudiendo contribuir a establecer estrategias que mejoren los resultados en términos de supervivencia. Constituyen un sistema organizado y planificado que utiliza métodos observacionales y procesos sistemáticos estandarizados, incluyendo modelos ajustados de riesgo, para evaluar esencialmente resultados de supervivencia. Los RE científicos se complementan con los ensayos clínicos aportando evidencia científica, pero necesitan inexcusablemente análisis estadísticos adecuados para generar datos clínicos fehacientes que contribuyan a optimizar el pronóstico de la población trasplantada. Asimismo, los RE científicos proporcionan información valiosa sobre el rendimiento de los programas de Tx y ayudan a generar índices pronósticos, que redundarán en la mejoría de la supervivencia. Con estas premisas, esta revisión profundizará en los siguientes aspectos relacionados con los RE científicos en el Tx: 1) el concepto y la importancia de implementar los RE en Tx; 2) las medidas que se necesitan para la correcta ejecución de los RE científicos; 3) los beneficios, la calidad y las limitaciones de los RE; 4) las herramientas estadísticas para el adecuado análisis de la supervivencia, y 5) la utilidad de los RE en la evaluación de la calidad, el rendimiento y las expectativas de los programas de Tx y la generación de índices de comorbilidad.
During the last years we have observed the proliferation of a huge amount of registries (RE) and population studies in different areas of Medicine, including the field of organ transplants (Tx). This has been done for basically organizational, epidemiological or welfare purposes. But do they provide evidence?; are they really useful?, or do they only represent mere inaccessible and unintelligible databases with a limited interest to the scientific community?
As part of the observational studies (OS), the ERs provide essential clinical and epidemiological data to learn about the health status of the population and the quality and cost of medical services; information that guides health managers to establish specific priorities and strategies in Health planning of different clinical entities, including Tx.1–7 Undoubtedly, this can improve results in terms of survival. Along these lines, many countries around us, including Spain, have relied on scientific REs to increase knowledge and improve results in different clinical entities such as Tx.
Since the early days, The Spanish Society of Nephrology has promoted the development of the RE of renal TX patients in renal replacement therapy treatment rep (available at www.senefro.org). In fact, this RE has been operational in Spain since 1979 and has always been closely related to the Registry of the European Dialysis and Transplantation Association (ERA-EDTA) and the National Transplant Organization (ONT).7,8
Although Tx is the treatment of choice for patients with advanced chronic kidney disease, after Tx a loss of grafts is still observed, even with the best starting conditions such as Tx from living donor; this is mainly due to the death of the patient and to the graft dysfunction.9,10 Undoubtedly, this entails an important consumption of health and economic resources, which requires a detailed analysis through the RE to know and improve our medical practice in the field of Tx. To achieve this goal, scientific REs need adequate statistical analyzes to generate solid and reliable clinical data.
With these premises, in this review we will deepen in the following aspects: (1) the concept and the importance of implementing the RE in Tx; (2) the requirements for the correct execution of the RE; (3) the benefits, quality and limitations of RE; (4) statistical tools for the adequate analysis of survival, and (5) the usefulness of RE: performance of Tx programs and generation of comorbidity indexes (CI).
Concept and importance of kidney transplant registryConceptually, REs constitute an organized and planned system that uses observational methods to collect clinical and epidemiological data with the intention of evaluating results in a defined population, especially survival, for scientific, clinical or administrative purposes.11 In fact, REs allow to know the health status of the population, provide essential clinical and epidemiological data to analyze and compare results with other national and international REs, and help to deepen in quality and health indicators that guide health managers to identify priorities and establish specific strategies. Additionally, they can increase the level of evidence by complementing the clinical trials (CT), which sometimes have important limitations derived from the nature of the population (small sample size, very selected population, short follow-up period, etc.) which helps to provide strong conclusions. As an example, from the American Scientific Registry of Transplant Receptors (SRTR) and the risk factors of such a community (obesity, tobacco, physical inactivity, poverty, etc.) (available at http://www.countyhealthrankings.org), which have a negative impact on survival, it can be detected who is at risk of death in the waiting list of patients for Tx.12 Likewise, it has been observed that Tx recipients with a greater number of community risk factors have a significant decrease in survival.13
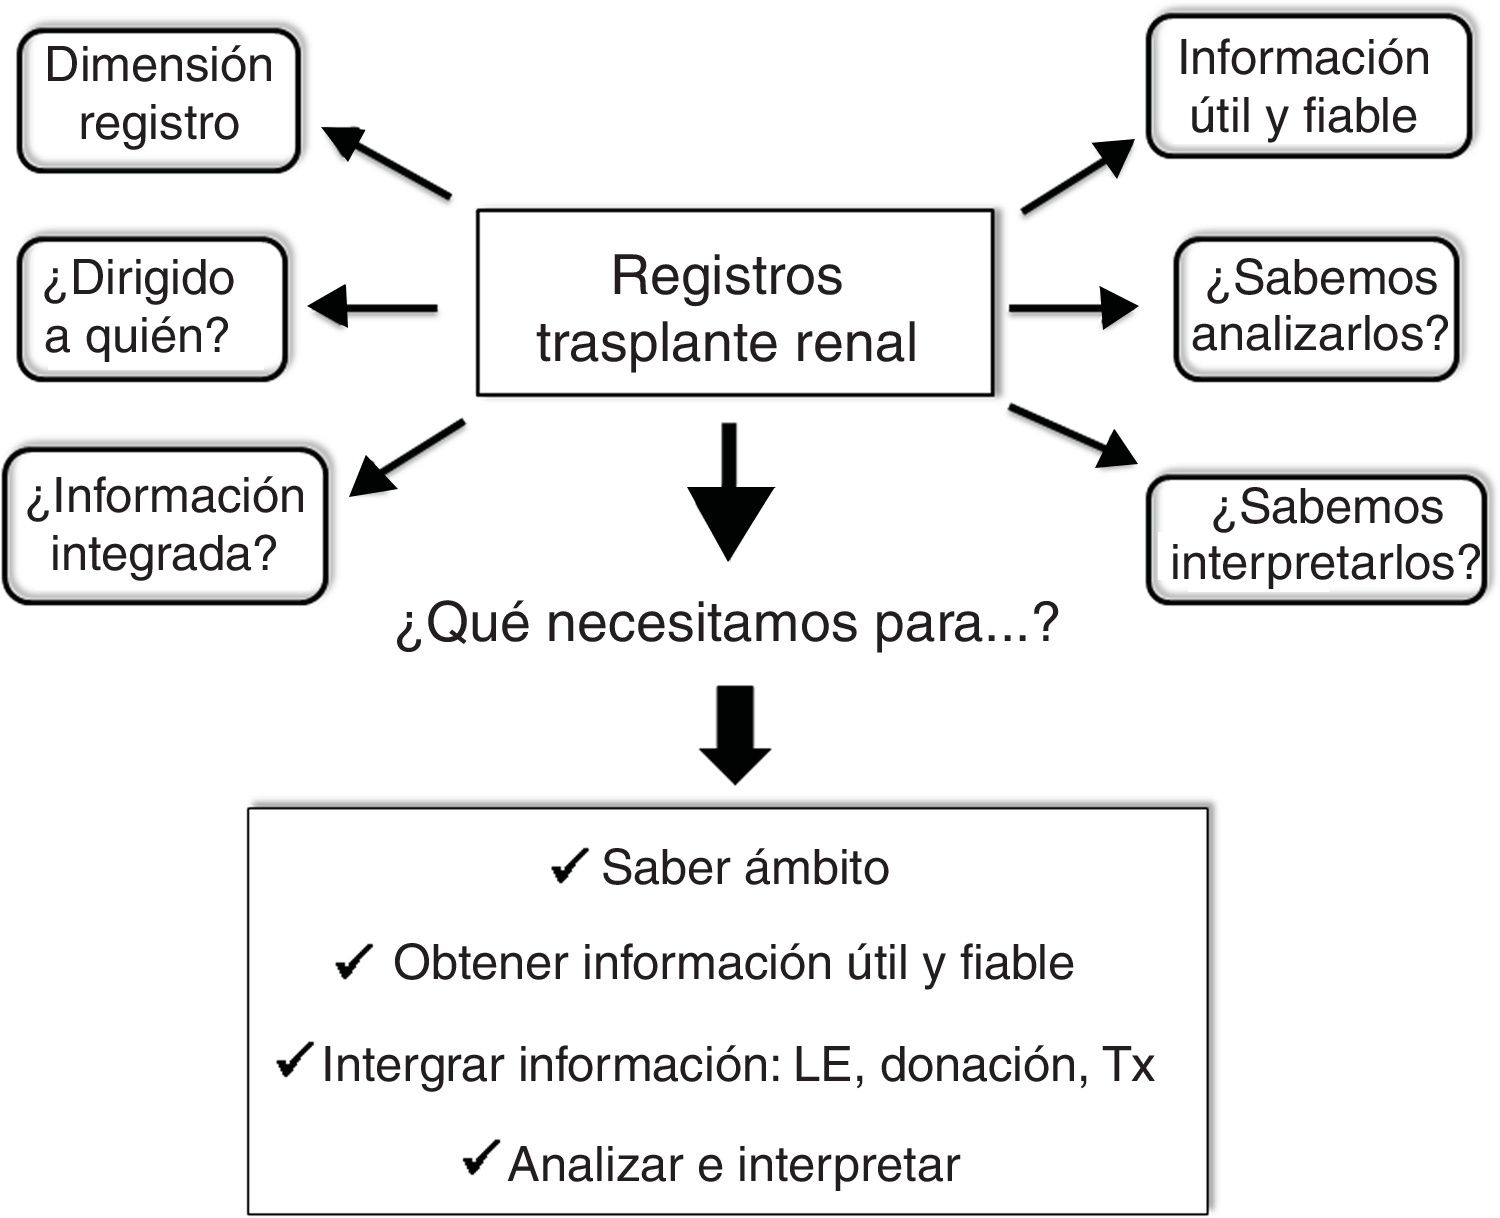
Although in the hierarchical scale of the evidence the RE holds inferior positions (Fig. 1), they provide very valuable clinical and epidemiological data for their implementation in clinical practice, especially when they are complemented with CT.6,14,15 In order to achieve this objective it is inexcusably necessary to know and to answer the following questions: (1) the dimension of the RE with clear and precise objectives; (2) to whom is directed; (3) know how to extract useful and reliable information from the RE; (4) obtain integrated information from the RE (donation, waiting list and Tx), and (5) analyze and interpret the information correctly. An appropriate response to these questions and requirements will undoubtedly help the RE not to be a mere inaccessible and unintelligible databases, but an important tool to generate information of general interest in the field of Tx. In other words, the application of a standardized procedure will make the RE in Tx reliable data that will help us modify and improve our clinical practice (Fig. 2).
Execution of records. Standardized systematic procedure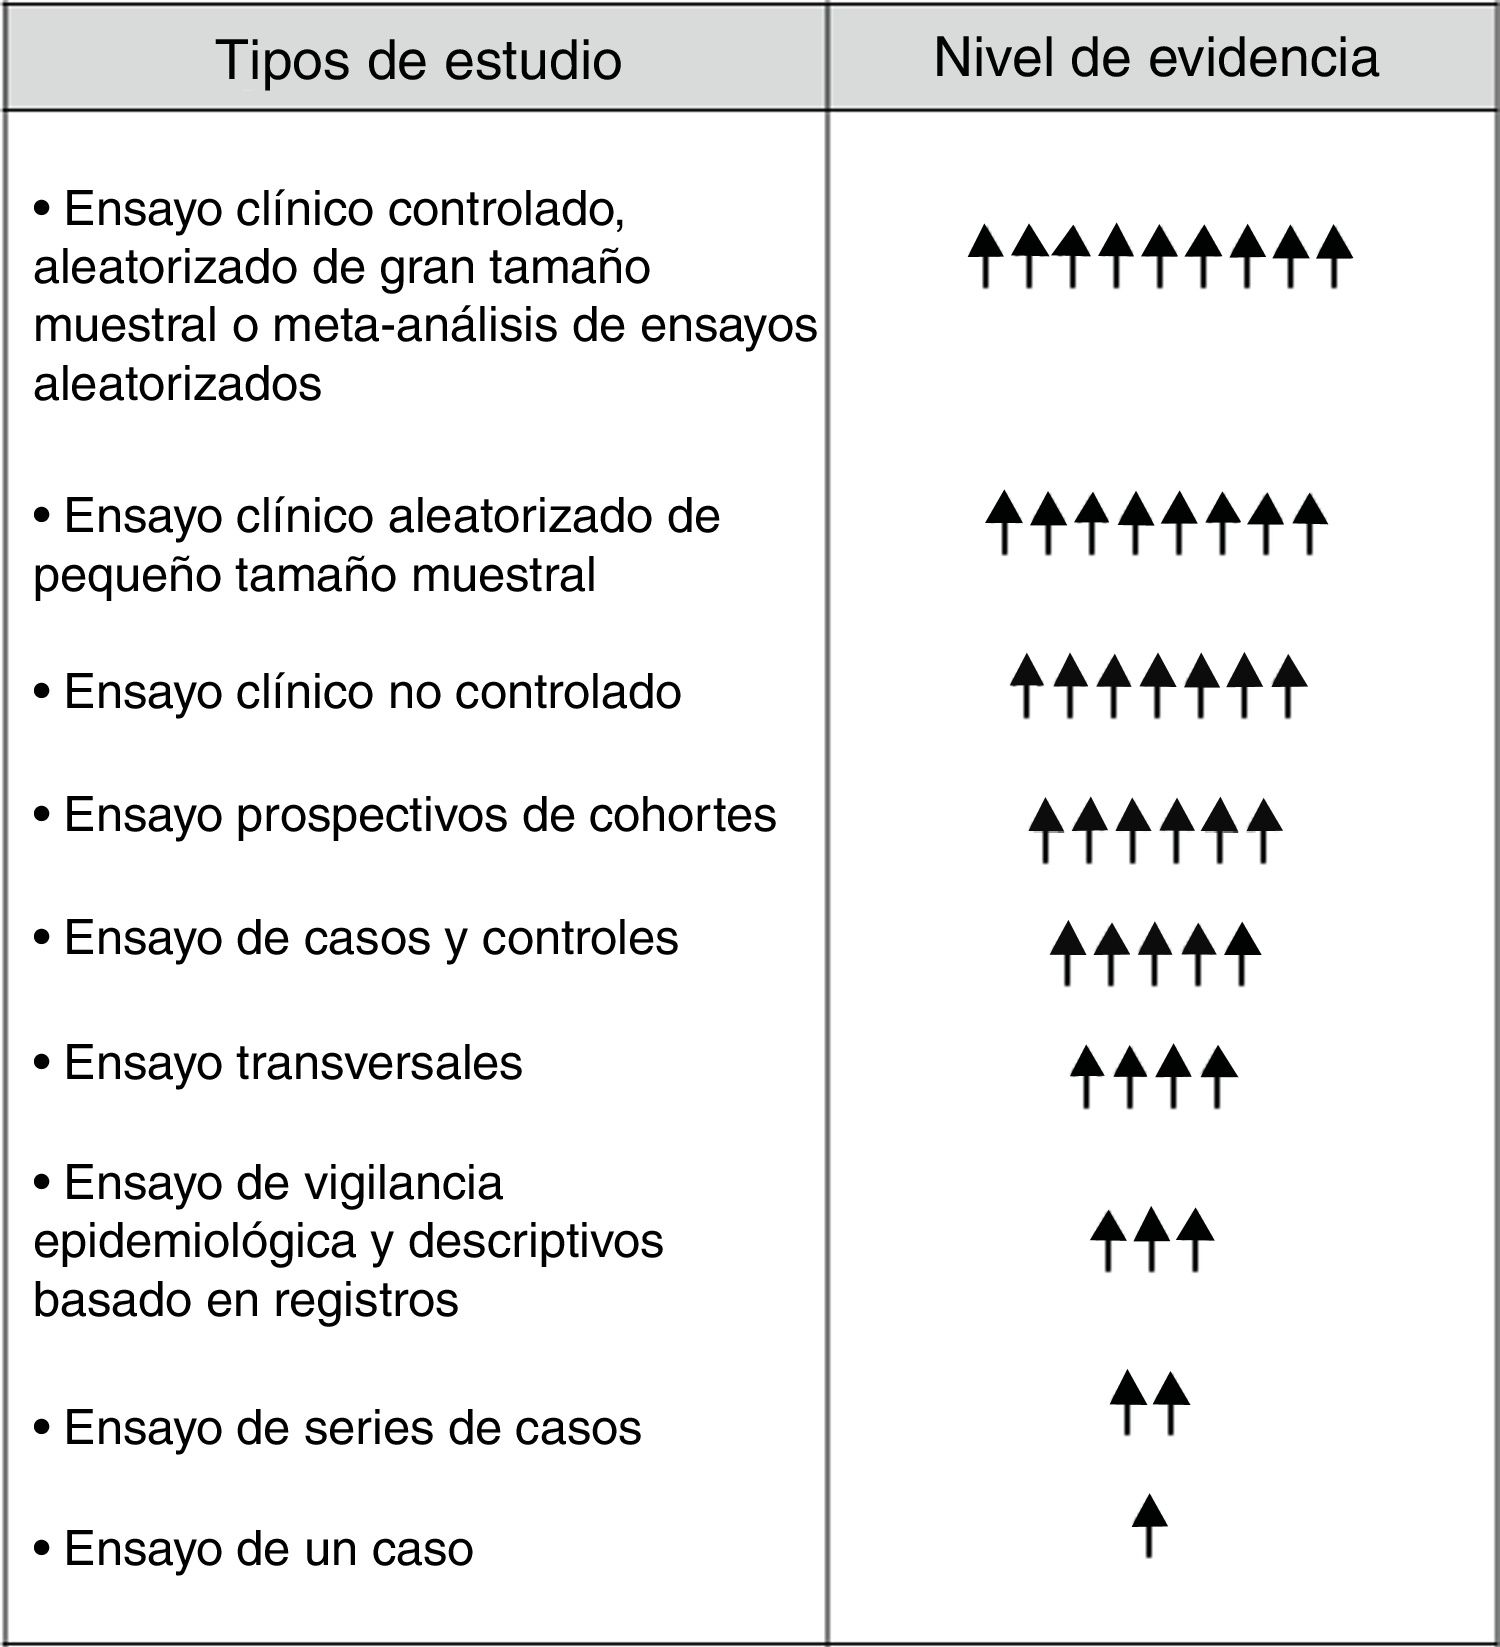
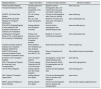
There are international and national REs of solid organ Tx (SOT) in several countries of the world that provide very useful information about the number of patients on the waiting list, donor characteristics or the volume of Tx performed. However few REs provide detailed information on the results of the Tx in terms of survival or on the performance of the Tx programs. These RE have in common that they have been developed as standardized systematic processes (SSP), which include adjusted survival models, as well as analysis of the expectations of Tx programs to achieve such objectives.5,16–18 As an example, the American SRTR currently maintains 43 risk adjustment models to assess survival in different SOT (available at http://www.srtr.org/csr/current/modtabs.aspx), which are renewed every 6th month. The generation and dissemination of SSP throughout the world for the creation of risk models could help other countries to develop or improve their national RE, facilitating international comparisons to increase the quality of care and the results of Tx.19Table 1 shows general information on some of the Tx REs with the greatest socio-health impact.
Some of the transplant registries with great socio-sanitary impact.
| Registry/database | Organ information | Content and data collection | Electronic address |
|---|---|---|---|
| UNOS Scientific Registry Transplant Database (USA) | Donation data and solid organ transplants in the USA. UU. | Baseline clinical-demographic data, at 6 months and every year until death or graft loss | www.unos.org |
| USRDS, US Renal Data System | EE. UU. kidney patients | Clinical and demographic data. Every six months | www.usrds.org |
| SRTR/OPTN (Scientific Registry of Transplant Recipients) | EE. UU. solid organ transplants | Baseline, 6 months and every year until death or graft loss | www.ustransplant.org |
| ERA-EDTA RegistryRegistry of renal patients of the European Association of Dialysis and Transplants | Kidney patients from European countries | Annual clinical, demographic and epidemiological data | www.era-edta-reg.org |
| Collaborative Transplant Study (CTS). Coordinated by the University of Heidelberg | Kidney, liver, pancreas, heart and lung from European patients | Baseline, 3, 6 and 12 months post-transplant. | www.ctstransplant.org |
| Australia and New Zealand Dialysis and Transplant Registry (ANZDATA) | Renal patients from Australia and New Zealand | Basal and every 6 months | www.anzdata.org |
| NAPRTCSThe North American Pediatric Renal Transplant Cooperative Study | Kidney patients from the EE. UU. | Data on transplant and growth | http://spitfire.emmes.com/study/pe |
| European Liver Transplant Registry | Liver. European patients | Demographic, clinical and epidemiological data | www.eltr.org |
| ISHLT International Registry for Heart and Lung Transplantation | Thoracic organs. Patients from EE UU and Europe | Share data with UNOS, Europtransplant and UK Registry | www.ishlt.org/regist.htm |
| The UK Renal Registry | Kidney patients from the United Kingdom | Clinical and demographic data | www.renalreg.com |
| ONT, National Transplant Organization | Kidney patients from Spain | Clinical and demographic data on donation and transplant | www.ont.es |
| REER, Spanish Registry of Renal Patients | Kidney patients from Spain | Clinical and demographic data on dialysis and transplantation | www.senefro.orgwww.registrorenal.es |
With these premises, the SSPs must initially contemplate a master plan that includes clear and precise objectives, a well-identified target population, an adequate definition of the variables and an appropriate knowledge of the scope of the RE. An RE must reflect the reality of what happens in a certain medical field, taking into account that as the dimension of the RE increases, its viability and sustainability decrease.
SSPs need a minimum of requirements to allow scientific REs to provide reliable and credible information to the scientific community and to the general population5,6,17,18,20: (1) adequate choice of the cohort (e.g., Tx living donor vs. deceased donor, adult vs. pediatric, single vs. multiple Tx, etc.); (2) an adequate number of events for each risk factor analyzed (generally 10 for each risk factor); (3) appropriate choice of the main and secondary variables by experts committee; (4) adequate allocation of missing values; (5) build the best risk model with the least number of variables avoiding over-adjustment (parsimonious model); (6) assess interactions by clinical experts; (7) validate the RE through discrimination and calibration; (8) application of risk models in the study cohort itself and in other similar or more recent cohorts, and (9) guarantee the custody and surveillance of the ER, as well as maintain its sustainability (Table 2). A very useful guide for the creation of RE is available at https://www.ncbi.nlm.nih.gov/pubmed/24945055.
Requirements of standardized systematic processes for the preparation of scientific registries.
| Adequate selection of the cohortMinimum number of events (10 for each risk factor)Decide the data that will be included in the risk modelsAppropriate selection of variables: expert committeeAppropriate allocation of missing valuesConstruction of the best risk model (parsimonious)Evaluation of interactions by expertsValidate it: discrimination and calibrationApplication in a study cohort and in another more recentSurveillance and maintenance |
Therefore, the execution of the RE in Tx needs the participation of a scientific committee that brings together clinical experts in the field of study, epidemiologists and biostatisticians with knowledge and experience in the development of RE. This will facilitate the creation of databases in a “friendly” computing environment to minimize transcription errors, with a well defined endpoints and subordinate measurements. The use of powerful statistical tools will allow sensible, thorough and powerful analyzes to avoid the biases inherent in the RE themselves. This will adequately respond to the questions and objectives defined in the RE. Have a clear idea of what will be recorded and why.
The development of a Tx RT using this strategy will provide data on incidence, prevalence, therapeutic modalities, results on survival and markers of clinical risk, which will allow epidemiological comparisons between different regional communities or with other countries. Undoubtedly, this represents a successful investment of time, provided that they comply with the quality standards established for them and if SSP are used for their development. In this line, a recent publication of the American SRTR showed that a large proportion of users who request information on the Tx process, survival rates and Tx programs, are candidates for Tx, relatives of candidates or those individuals related to live donor tx and healthcare professionals.21
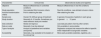
Benefits, limitations and quality of recordsAlthough CTs are an essential instrument to test certain hypotheses that are raised in biomedical research, some compelling reasons justify the need to develop large RE and OS in any medical discipline, including Tx. Table 3 shows some important differences between CTs and OSs that will help us understand their advantages and limitations.6 In fact, CTs also have their own limitations derived from their study conditions and their inability to detect small but notorious differences between the cohorts analyzed. The sample size and duration of CTs are markedly shorter than in OSs, which analyze thousands of patients during a long follow-up (generally>10 years). CTs may lack sufficient statistical power to detect differences in survival rates for certain therapeutic interventions. This becomes more evident in the field of Tx, where intermediate final variables are often used, such as the rate of acute or recurrent rejections, avoiding as a primary objective the survival of the patient or graft. Likewise, CTs are performed in very selected patients and in very rigorous conditions, which could move us away from the reality of usual clinical practice and lead us to a misleading generalization of their results. In fact, in circumstances other than the CT itself, the effectiveness of a given treatment could be weakened. On the contrary, RE based on observational methods analyze the effectiveness under normal conditions of daily life. Retrospective OSs may confirm whether the effects previously tested in the CT are applicable to other populations and in other circumstances. However, biomedical research in the field of Tx relies mostly on OS. From these arguments it follows that the OS and the CT must complement each other and combine their conclusions to augment the level of evidence and achieve maximum performance in the application of their results in patients with Tx.
Most relevant differences between clinical trials and observational studies and registries.
| Characteristic | Clinical trials | Observational studies and registries |
|---|---|---|
| Objective | Measure effectiveness in controlled conditions | Measure effectiveness in real life conditions |
| Study population | Very selected Strict inclusion criteria | Real life conditions. Less stricted inclusion criteria |
| Inclusion/randomization criteria | Prior to obtaining the data | After obtaining the data |
| Sample size | Overall, 50–200 per group of treatment | In general, thousands of patients in each group |
| Study duration | Generally 6–12 months. Sometimes you need extension study are needed | In general≥10 years |
| Data collection | Global and rigorous | Less data per patient. Sent by other centers |
| Data on costs | Generally it can be obtained | Only available in some studies |
| Type of analysis | Analysis of predefined end variables (end-points) | Regression analysis that measure the effect at specific times independent of prognostic variables |
| Accessibility | Generally, only available to the leaders of the clinical trial | More easily available (websites, registries, etc.) |
However, there are numerous limitations of the RE and OS that should be known. Some findings that were based on OS were not subsequently confirmed by rigorous CTs, which indicates that OSs and REs are very vulnerable to confounding factors, mainly due to the retrospective view inherent in the RE itself. Indeed, REs and OSs have important limitations derived from large biases in their analyzes, especially survival analysis These biases include the inadequate definition of end-point or the choice of inappropriate subordinate measures (surrogate measures), the inaccurate collection of information, the analysis of very heterogeneous populations, the lack of randomization of the study groups or the presence of confounding variables.3,18,22–24 Fortunately, there are powerful statistical tools, such as regression analyzes, that minimize this situation and upgrade EOs and large ERs to higher levels of evidence. A consensus document on the quality and surveillance of Tx REs provided a series of recommendations on the statistical models to be used and the appropriate adjustments to be made to avoid over-adjustment and inaccuracies in the survival analyzes of patients in waiting list and post-Tx.25
Despite these measures, it is expected that mistakes will still be made. Therefore, large REs with significant health impact need quality controls or external audits to confirm the truthfulness and accuracy of the data collected. But how can the quality of REs be ensured? In general, the quality of RE depends on the inclusion of a representative group of patients and on the accuracy of the data collected. This implies that the data has to be complete, accurate and reliable.26,27 Independently that a good RE design needs an adequate selection of variables and a correct collection of information, there are basically 2-methods to ensure the quality of the data. The first is to analyze the quality of the data within the same database (internal validity). This initially detect the missing values (missing values) and the incongruents values, the later are more worrisome than the first ones since they can affect the results of an epidemiological study more than the lost values. The second method to guarantee and validate the quality of the data is to reproduce exactly the data collection of a part of the initial sample and compare it with the original sample (external validity). The degree of agreement or concordance between the categorical variables of the 2-sample will be determined by the kappa index. A kappa index that approaches the unit will indicate a great similarity between the samples and will therefore guarantee the quality of the data. Since these methods do not completely prevent the generation of errors, sometimes external audits are used to verify the veracity of the RE, comparing the data contained in the databases with the patients’ medical records. A previous study on the quality control of the European hepatic Tx RE, in which the databases of 21 centers in 12 European countries were randomly audited, found that the data were mostly reliable (1.5% of incongruent data and 5% of missing values), as well as the scientific results obtained.28 These findings points to the reliability of this RE, which could serve as a model to guarantee the quality of other SRs, including those of the national territory.
Apart from these technical considerations, the integration of Tx REs in a scientific community of a country with different REs could also increase their quality and veracity. In other words, questions of a socio-sanitary or administrative nature that entail the fragmentation of the scientific REs of a country could weaken their validity and strength. The use of different or incompatible systems in the collection of information with a huge consumption of time and resources do not guarantee the accuracy or completion of the data. XXXCurrently, in our field we have very valuable REs, such as the Donation and Transplant RE from the ONT, the scientific REs of Tx from different scientific societies and the regional RE of dialysis and Tx. Ideally, it would be more reasonable and operational for all Tx REs in Spain to be integrated into a single scientific RE that combined all available information from the ONT registry, autonomous REs and REs of scientific societies (including the Spanish Society of Nephrology), to be shared by all in a transparent manner. This could increase the accuracy of the data and the level of knowledge in this population. As an example, the recent comparison of cancer data between transplanted patients of the American Tx RE (SRTR/Organ Procurement and Transplantation Network [OPTN]) and the individual RE of different types of cancers, showed that only 36% of the cancers were in both REs, indicating that incomplete or inaccurate data may limit the usefulness of the RE for care and research purposes.29 Similarly, a mismatch has been reported in the incidence of post-Tx lymphomas by OPTN data and American Medicare RE data.30
Currently, there is a plethora of examples of major scientific publications worldwide derived from RE, especially from the American SRTR RE, which identify health problems and risk factors for survival of graft and patients with Tx.3,24,31–35 In our environment, the use of the Andalusian RE of dialysis and Tx with more than 22,000 patients included in from 1984 to the present has allowed the analysis of survival in patients on the waiting list for Tx and the risk factors of mortality in this population. This analysis which could improve the care of our candidates of Tx.36–39
Statistical tools for survival analysis in transplant recordsThe choice of appropriate statistical models is another crucial step in the analysis of RE and the study of Tx survival. The OSs and REs are very vulnerable to confounding factors; they lack the random assignment that occurs in CTs, which avoids bias of selection or susceptibility. Basically, there are 3-methods to control this bias in the RE and OS studies: stratification-standardization, regression models and propensity index. However, these tools are only controlled the confusion induced by the characteristics observed, this is the opposed to randomization, which controls characteristic observed and not observed. In any case, these measures minimize the effect of the confounding variables in the interpretation of the results of the RE and OS.6,17,18
A first step in the analysis of the RE of Tx is survival analysis. These analyzes represent a set of techniques designed to evaluate a variable known as “time to an event” (death, graft failure, rejection, etc.) and the associations between this variable and potential explanatory variables.
The variable “time to the event” is determined by 2 probabilities that are related to each other: the survival function, which indicates the probability of survival on an individual in a time≥t, and the risk function (hazard), which represents the instantaneous probability (per unit of t) that a patient has the event at a time t.18,40 Therefore, survival analyzes have three objectives: estimation and interpretation of survival curves, comparison of curves (e.g., 2 treatments) or estimating the relation between risk factors and survival. The probability of survival can be estimated with non-parametric methods from the observed survival time, using the Kaplan–Meier analysis. However, these analyzes may have critical aspects in the estimation of the variable “time to event”, causing inaccuracies in their determination. These critical issues are: (1) assumption that censorship (loss of follow-up, completion of the study without events and appearance of competitive events) does not provide prognostic information; in the case of competitive events, competitive risk models should be used18,41–43; (2) inaccuracy in the calculation of the median follow-up time when there have not been enough events; this can be translated into fictitious estimates of survival after the assumption of other models,43,44 and (3) not providing the accuracy of the estimates of the effect through the 95% confidence interval or the table of individuals at risk. Abraira et al. showed that less than 50% of the published survival analyzes of different areas of knowledge showed the description of censorship or the median follow-up time.45 Likewise, only 50% of them showed data on the accuracy of the estimates of the effects,45 which opens an area of improvement in the quality of these analyzes.
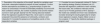
The Kaplan–Meier analysis aims to know the individual influence of a variable in survival, but ignores the impact of other factors. Therefore, they are vulnerable to confounding factors and do not quantify the effect on survival. Therefore, Kaplan–Meier analyzes must be followed by estimating the level of uncertainty through the regression models, which allow quantifying the effect (hazard ratio) and knowing the independent contribution of several risk factors on survival. Table 4 shows the types of regression analysis most frequently used in SOT and their most important characteristics. These regression models also allow to compare curves, testing interactions and generating predictive models. The Cox model is the most used and provides the relative risk of the prediction in question (dependent variables), depending on possible explanatory or confounding factors (independent variables), assuming that, as time passes, the risk of 2 groups is constant.
Regression analysis more frequently used in clinical research on solid organ transplants.
| Type of analysis | Type of response Dependent variable (end-point) | Predictor or independent variables (surrogate end-point) | Clinical examples | Prediction equationa |
|---|---|---|---|---|
| Multiple regression | Continuos | Continuous and dichotomous (0,1) | Serum creatinine, donor age | Y=β0+β1X1+β2X2+…βiXi+residual error |
| Logistic regression | Dichotomous (present/absent) | Continuous and dichotomous | Rejection (yes/no)Diabetes (yes/no) | Ln(P/1–P)=β0+β1X1+β2X2…+βiXi |
| Cox regression analysis (proportional risks) | Time to the event (survival models) | Continuous and dichotomous | Time to deathTime to graft failure | h(t)=h0(t) exp(β1X1+β2X2…+βiXi) |
Where β0 is the theoretical value of Y when Xi is equal to zero (intercept) and β1, β2…and βi are the regression coefficients. Logistic regression, the value of p is the probability of response and Xi are the predictor variables and βi are the regression coefficients. Cox regression analysis, where the risk function h(t) is dependent or determined by the covariates (X1, X2…Xi), whose impact is estimated by the size of the regression coefficients (β1, β2…βi). The term h0 is the baseline risk function and is the value of the risk if all Xi are equal zero.
The next step to develop a regression model is to establish an appropriate modeling strategy in line with the objective of the study, taking into account that there must be at least 10 events for each risk factor we want to analyze.17,18,40,46 Basically, these strategies are: (1) backward strategy (recommended in predictive studies), introducing the maximum number of variables that to be analyzed and removing one variable at a time depending on the lower degree of statistical significance (higher p-value) or depending on whether or not they are “confunding” (estimated objective); (2) forward strategy: starting from a single variable (the one with the lowest value of p), and all other variables are introduced until the final model is achieved; (3) stepwise or “step-by-step” strategy is a modification of the previous one to prevent the “forward” strategy from remaining with non-significant variables, and (4) automatic selection of variables using the Least Absolute Shrinkage and Selection Operator (LASSO) method. It is useful for highly related variables that have very high regression coefficients.47
Likewise, “confusion” and “interaction” between variables must be tested to avoid inaccuracies in the estimates provided that the objective of the model is estimations. Confusion exist if the relationship between the variable under study and the prognosis differs (the hazard ratio changes>10%) when another variable is introduced. Interaction exists when the relationship between the variable under study and the prognosis (death or graft failure) varies according to the different levels of another variable (e.g., diabetic vs. non-diabetic). However, regression models have critical points that lead to errors and inaccuracies in their results. Briefly, these critical points are: (1) assumption of the proportionality of the model over time, which must be examined visually or looking for the interaction of the variable under study over time; (2) collinearity between closely related variables (e.g., blood glucose and HbA1c), which could overestimate the model; (3) analysis and search for time-dependent variables (variables that vary with time or with different effects over time); (4) competitive risks to events that compete with the event of interest (e.g., Tx in the study of waiting list mortality)36,39,42; (5) verify the goodness of fit; (6) proper handling of missing values; (7) existence of confusing variables by indication that would allow a greater likelihood of exposure (e.g., being diabetic and receiving angiotensin converting enzyme inhibitors) in RE and OS; in this case, it would be applied the propensity analysis48–50; (8) analysis of the validation of the model by means of calibration (concordance between the estimated and observed) and discrimination (ability to distinguish between high and low risk patients), and (9) application of “frequentist” methods based on calculations of observed and expected results, against Bayesian methods which employ probabilities based on previous assumptions when evaluating the trajectory of Tx programs.17,18,51,52Table 5 shows the checklist of points that should be tested to avoid errors in the development of the regression models and in the assessment of survival from the OS and RE.
Assessment of critical points (checklist) to perform regression analyzes and survival assessment.
| 1. Description of the objective of the study2. Identify the variables used and show a descriptive statistical analysis of these variables3. Confirm that the assumptions are fulfilled (e.g., proportionality)4. Explain the reason for censorship5. Provide the estimated probability of survival with their confidence intervals, the number of patients at risk and the median survival in each group6. Specify how the missing data was treated7. Show the regression equation8. Report the α level used in univariate analyzes9. Document the presence of collinearity, confusion and interaction10. Consider the presence of competitive events or time-dependent variables | 11. Consider the use of propensity indices12. Define the modeling strategy (forward, backward, etc.)13. Describe the regression coefficient of each variable, the hazard ratio, the confidence intervals and the value of p14. Provide goodness of fit15. Specify if the model was validated and how it was validated16. Consider showing the results graphically for simple linear regression analysis, Kaplan–Meier curves or Cox analysis.17. Specify the statistical package or program used |
In general, scientific and epidemiological REs have the commitment to provide information on the trajectory of Tx programs and survival data, avoiding controversies arising from specific publications of some programs.25 With these premises, Tx RE reports can be used with guarantees and credibility by regulatory agencies, Tx centers, insurance companies, patient associations and health institutions. All Tx centers should use tools that facilitate the assessment of the quality of their own Tx programs and the improvement in their performance. Recently, the American SRTR has incorporated “Bayesian” methods based on the probability of events instead of the “frequentist” methods to estimate the expectations, quality and evolution of the Tx programs.25 Along these lines, REs can be very useful in identifying whether Tx programs that accept poor quality grafts (e.g., Kidney Donor Profile Index [KDPI]>80%) have worse survival outcomes than those that only accept grafts of good quality. An interesting study showed that the use of donors with a high KDPI did not increase the risk of death or graft loss when appropriate adjusted models based on Bayesian methods are used.53
On the other hand, the application of quality procedures for RE, based on a concept known in economics as benchmarking, can also help to identify the best hospitals in processes of donation by using, as described by Matesanz et al.54 indicators or variables of the process itself. In essence, the benchmarking represents a process of continuous and systematic evaluation to analyze and compare processes of an organization with other considered leaders, obtaining the information needed to improve a practice or activity. The idea is to establish a structured research methodology to identify best practices based on the RE. Obviously, this method of work entails the need to describe the process in which this methodology is to be applied, build indicators of the result of the process, identify the units of study with better indicators (references or benchmarks) and investigate and describe the practices that can justify results of excellence, to favor their adapted implementation. Given the good experience in the application of benchmarking in the process of donation in brain death in Spain, this methodology can be very useful to boost other activities in TOS, such as Tx from living donor.
Presently, the American SRTR also uses the tool of cumulative sum (CUSUM) to assess the performance and quality of Tx programs.55 A detailed statistical description of this method is beyond the scope of this review, but in essence it is a statistical process that accumulates data over time as the process develops, using adjusted Cox proportional risk models and observed and expected rates. This method can identify fluctuations in the event rates of a Tx program throughout time. This confirms the potential variability of the Tx programs.55
The Tx is associated with an increase in morbidity and mortality with respect to the general population of similar age and sex.56 Therefore, predicting mortality and morbidity may be crucial to establish the most appropriate therapeutic measures and prolong the survival of these patients. In patients with Tx, it is necessary the application of comorbidities index (CI) that includes comorbid risk factors and subordinate measures of survival so survival can be estimated accurately and therefore make the most appropriate therapeutic decisions.18,24 With these premises, it is inferred that the OSs and the large REs represent the pillars of the different CIs. Basically, this is achieved by the significant number of patients included during a long period of follow-up.
In general, the predictive performance of the CIs that rely on REs or large databases depends on several factors: (1) the clinical conditions included in the CI and their relative statistical weights; (2) the distribution of comorbid conditions in the study population; (3) the primary final variable (end-point) of the study, and (4) the accuracy of the data collected.57 The application of CI used in the general population (e.g., Framingham score) underestimates the risk in patients with Tx58,59 and the classic risk factors do not satisfactorily explain the high mortality in the Txs population; therefore an appropriate elaboration of a CI in these patients should include traditional and non-traditional cardiovascular risk factors, factors related to Tx, and community health indicators.18 In recent years, different prognostic indexes of mortality and comorbidity have been developed in patients with Tx.60.61 Likewise, different electronic resources have been developed to predict the risk in these patients derived from these CI62 (e.g., www.transplantscore.com, www.transplantmodels.com, www.renalmed.co.uk/risk-calculator). Some of these indices are based on risk scores applied to the general population,63–66 while others also include pre-Tx and post-Tx61 risk variables. In general, all these CIs accurately predict the risk of death or the appearance of comorbidities. Most have been validated internally using mainly RE data and others have been externally validated in prospective studies. In this sense, the creation of SSP for the development of risk models, using national RE data, could help Tx teams and facilitate international comparisons to improve results in Tx.17 However, very few models have exclusively evaluated survival in elderly patients.65,67–74 As a consequence, there is currently no consensus on the prediction of mortality in elderly Tx recipients. Meanwhile, Tx doctors should implement the most useful risk model according to their own Tx center or patient characteristics.
Key concepts- •
The scientific REs of Tx are very useful because they allow the identification of risk factors in this population and make it possible to compare the information with other national and international REs. This contributes to create strategies that improve results of survival.
- •
Scientific REs are complemented by CTs increasing the level of scientific evidence which improve the results of clinical decisions.
- •
The scientific REs in Tx constitute an organized and planned system that uses observational and SSP methods, including adjusted risk models, with the intention of assessing survival outcomes.
- •
Scientific REs in Tx inexcusably need adequate and powerful statistical analyzes to generate reliable clinical data useful to optimize the prognosis of the transplanted population.
- •
The scientific RE in Tx are useful to estimate the quality and trajectory of the Tx programs and makes possible the generation of CI which may contribute to optimize the results of the Tx.
This study was supported in part by the Ministry of Economy, Industry and Competitiveness of Spain of the Carlos III Health Institute (FIS ICI14/00016 and FIS PI17/02043), co-financed by the European Regional Development Fund-ERDF, RETICS (REDINREN, RD16/0009, RD16/0009/0006, RD16/0009/0021).
Conflict of interestThe authors declare not to have conflicts of interest related to the contents of this article.
Please cite this article as: Hernández D, Sánchez E, Armas-Padrón AM. Registros en trasplante renal: ¿cómo optimizar su utilidad? Nefrología. 2019;39:581–591.