


Diabetic kidney disease is the main cause of chronic kidney disease (CKD) worldwide. Both CKD and diabetes mellitus (DMT2) are important risk factors for mortality. However, it is still unknown if the risk of death is modified by the simultaneous presence of these diseases.
ObjectiveTo evaluate the presence of an interaction between DMT2 and CKD for mortality in a representative population of a Latin American country.
MethodsIt is an analytical cohort study of patients with CKD, who were followed for 4 years (between 2004 and 2009). We calculated the incidence rate, progression, survival (using Kaplan–Meier curves), interaction (on the additive and multiplicative scales) and impact of the different stages of CKD in patients with and without DMT2 (using a cox proportional hazards model).
ResultsIn this population of 5663 individuals, both DMT2 and CKD are risk factors for mortality (p<0.001). We found a statistically significant difference in mortality between individuals with and without DMT2, who also had CKD stages 3–4 –5 (Log-rank p=0.0076). Additionally, we found a statistically significant interaction for mortality in both the additive and multiplicative scales between DMT2 and CKD (p=0.005). DMT2 was found to be a risk factor for mortality (Hazard Ratio 1.61 p<0.001), but in individuals with DMT2, the only risks significantly associated with mortality, were age, dyslipidemia and nephroprotective drugs.
ConclusiónThe interaction between CKD and DMT2 negatively modifies the risk of death of both diseases. This means that when the two diseases are present, the risk of mortality is lower than expected.
La enfermedad renal diabética es la principal causa de enfermedad renal crónica (ERC) en el mundo y tanto la diabetes mellitus (DMT2) como la ERC son importantes factores de riesgo para mortalidad. Sin embargo, se desconoce si la presencia simultánea de ambas enfermedades modifica el riesgo de muerte.
ObjetivoEvaluar la presencia de interacción entre DMT2 y estadio ERC respecto a la mortalidad en una población representativa de un país latinoamericano.
MétodosEstudio analítico en dos cohortes de pacientes con diagnóstico de ERC con cuatro años de seguimiento entre 2004 y 2008. Se calculó la tasa de incidencia, progresión, supervivencia (Kaplan-Meier), interacción (aditiva y multiplicativa) e impacto de la presencia de los diferentes estadios de ERC en pacientes con y sin DMT2 mediante un análisis de riesgos proporcionales de Cox.
ResultadosEn esta población de estudio de 5.663 pacientes, tanto la DMT2 como el estadio de ERC son factores de riesgo para mortalidad (p<0,001). La diferencia en la supervivencia entre diabéticos y no diabéticos en estadios 3 – 4 – 5 fue estadísticamente significativa (Log-rank p=0,0076). Se encontró una interacción estadísticamente significativa en las escalas aditiva y multiplicativa entre la presencia de DMT2 y el estadio de ERC, con respecto a la mortalidad (p=0,005). Se confirmó el impacto de la diabetes como factor de riesgo de mortalidad (Hazard Ratio 1,61 p<0,001), pero en los pacientes con DMT2 solamente la edad, la dislipidemia y los nefroprotectores estuvieron asociados significativamente con la mortalidad.
ConclusiónLa interacción entre ERC y DMT2 modifica de forma negativa el riesgo de muerte de ambas enfermedades. Es decir que el efecto conjunto observado es menor al esperado.
Both chronic kidney disease (CKD) and diabetes mellitus are problems taffecting the public health and diabetes is the main cause of CKD in the world.1 Both conditions are mortality risk factors.1–3 Globally, CKD occurs in 25%–40% of patients with type 2 diabetes mellitus (T2DM)4,5 and in 7%–12% of the general population.1 In countries such as Singapore, Malaysia and the Jalisco region in Mexico, the incidence of diabetic kidney disease is greater than 50%,6 while in the US the prevalence of T2DM is 12%–14%.7
Despite the high prevalence of both diseases, to date it has not been accurately determined in populations of Latin American countries whether the association of each disease with mortality is modified by the presence or absence of the other, in other words, is there an interaction between the two of them to affect mortality. To our knowledge, most of the studies are prerformed in patients population with or without T2DM in developed countries; and without adequately exploring the differences between both groups according to renal involvement.8–10 A meta-analysis evaluated the interaction between CKD and T2DM and reported an increase in mortality associated to a decreased in glomerular filtration rate (GFR), but without significant differences or interaction in diabetics versus non-diabetics.8 However, only one of the 30 studies included in the systematic review had minimal representation of South American countries, and it corresponded to a clinical trial carried out almost 20 years ago to estimate the efficacy of angiotensin II receptor antagonists. The objective of the present study is to determine, in a representative population of a Latin American country, whether the risk of mortality associated to each CKD stage is modified by the presence or absence of T2DM.
MethodologyStudy designThis is an analytical study was carried out with two cohorts of patients diagnosed with CKD and four years of follow-up, evaluated in a previous study11 to determine the effectiveness of a renal protection program (RPP).
Scenario and participantsThe population evaluated in the study belongs to two health service provider companies (EPS) in the department of Antioquia in Colombia, specifically in the city of Medellín and its metropolitan area and municipalities in eastern Antioquia. Data collection was carried out from both EPS between January 2007 and June 2009. The data recorded in the electronic clinical record from April 2004 (the beginning of the RPP) to June 2007 were retrospectively analyzed and prospective analysis continued until April 30, 2008, for a total of four years of follow-up.
Each EPS, from which the data for the study was taken, cared for their patients with a renal protection program (RPP) or with conventional treatment (TC). The PPR is an interdisciplinary and specialized program for the management of patients –with a preventive approach since the initial stages–; the TC consists of first level of management which is less preventive and more therapeutically oriented.
The patient inclusion criteria were: being affiliated to the EPS during the four years in which the study was conducted and meeting the CKD diagnostic criteria established by the National Kidney Foundation in the Kidney Disease Outcomes Quality Initiative.9,12 Patients under 15 years of age and those registered at both institutions at any time during the study were excluded. Follow-up began when they were diagnosed with CKD or included in the PPR. This study was approved by the ethics committee of the institutions involved and all the patients in the prospective phase signed the informed consent for participation in the study.
VariablesDiagnostic criteria of CKD: a GFR<60mL/min/1.73m2 (calculated using the Cockroft–Gault formula), renal abnormality on ultrasound, proteinuria >150mg/day, abnormal urinary sediment, and if diabetics a microalbuminuria >30mg/g or 30mg/24h.
Exposure variables: diagnosis of T2DM by clinical history and stages of chronic kidney disease defined according to the 2012 KDIGO guideline13 (Table 1).There ara five stages defined, one is the most moderate and five the most serious.
Chronic kidney disease stages according to the 2012 KDIGO guide.13
| Stages | GFR (mL/min/1.73m2) |
|---|---|
| Stage 1 | >90 |
| Stage 2 | 60–89 |
| Stadium 3a | 45–59 |
| Stadium 3b | 30–44 |
| Stage 4 | 15–29 |
| Stage 5 | <15 |
GFR: glomerular filtration rate.
Dependent variables: all-cause mortality, CKD stage progression.
Descriptive variables: values of blood pressure at diagnosis, fasting glycemia, glycated hemoglobin, serum creatinine, 24-h proteinuria, HDL and LDL cholesterol, hemoglobin, electrolytes (potassium, calcium, phosphate), albumin, and parathyroid hormone.
Confounding variables: according to the reviewed publications,1,14 the following variables were assumed as potential confounding variables: age, sex, CKD stage at the time of diagnosis, arterial hypertension (AHT), dyslipidemia, EPS, nephrotoxic, nephroprotective, and Cardiovascular disease (defined as a history of acute myocardial infarction, coronary heart disease, or cerebrovascular accident).
Source of data and measurementsThe information was taken manually from the databases of each EPS and from the medical records, obtaining the information progressively during the study period.
BiasesTo avoid measurement bias, the team dedicated to data collection was trained, the process for applying the tools was standardized, and a pilot test was carried out. In addition, each clinical history was entered into the database by two different professionals. During the study, an effort was made to reduce the risk of patient loss. With this purpose, the new telephone numbers of the patients were searched in the records and in other documents of the EPS. Likewise, telephone numbers of friends and relatives of the patients were sought by the team in charge of the programs. All patients were contacted by telephone to verify their health status after completing the study. Information could be obtained from 80% of them, without any difference between both EPS. Censored cases were those patients in which death was not reported as an outcome, the lost to follow-up, and patients who withdrew from the study. The censoring time was defined as the last date reporting that the patient was alive.
Sample sizeThe number of participants was defined after counting the number of patients that met the CKD criteria according to KDOQI and had an electronic medical record in the provider companies. No formal sample size calculation was made in the original study, since the entire population that met the inclusion criteria was included.
Quantitative variablesThe GFR was taken into account as a variable of progression in each stage. For the statistical analysis, stages 1 and 2 were assumed as the control group and stages 3a, 3b, 4 and 5 as the exposure group. Age was divided into two groups: under 65 years and over 65 years. This cut-off point was defined based on the fact that it was the mean of the total population studied and the threshold declared by the World Health Organization (WHO) to differentiate the old from the adult population.
Statistic analysisFor descriptive statistics it was used the mean, median or frequency distributions with their corresponding measure of dispersion, depending on the type of data. For the bivariate analysis, the X2test was used to assess the risk of mortality in stages 3 (a and b), 4, 5 of CKD and in diabetic patients, as well as the association between T2DM and CKD progression. The Kaplan–Meier survival curve analysis, was used to assess the probability of death in CKD stages 3, 4 and 5 in diabetic patients vs. not diabetics. Subsequently, stages 3a–3b and 4–5 subgroups were analyzed separately in the presence or absence of T2DM. Cox proportional hazards models were performed in patients with and without T2DM, adjusting for covariates. The ratio of incidence rate was estimated with a 95% confidence interval.
To detect the presence of the interaction, a stratified analysis of mortality in CKD stages was first performed using the Mantel–Haenszel technique, and confirmed with the Breslow–Day test. The interaction was evaluated as additive and as multiplicativel. The additive scale assesses whether the combined effect of both variables is different from the algebraic sum of the individual absolute risks, while the multiplicative scale assesses whether the effect is different from the product of the individual effects.15 The additive scale has proven to be important in public health analyzes and in the evaluation of biological interaction, but the general recommendation is to evaluate always both scales.16 Subsequently, two Cox proportional hazards models were performed to assess the risk of mortality in patients with CKD, adjusting for covariates and the CKD–DMT2 stage interaction. Both models were evaluated using the likelihood ratio test to determine the difference between the complete and nested models. The SPSS version 22 and STATA version 14 were used for the statistical analysis.
ResultsParticipantsA total of 9887 medical records were reviewed, 56% from the PPR program and 44% from the TC program; as many as 5663 met the inclusion criteria and 3832 had at least two years of follow-up of, 8.9% withdrew and 5.5% died.
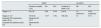
The mean age was 67 years, with no significant differences in the distribution by sex. A 35.3% of the patients (n=1998) had a diagnosis of T2DM. More than 50% of the patients with T2DM and CKD stages 3, 4, and 5 were 65 years of age or older. A 57.6% of the population had stage 3 CKD (a or b) and 1.8% had stage 5 CKD (Table 2 and Appendix B Supplementary Table 1).
Characteristics of the population of two cohorts of patients in renal care (Medellín, Colombia, 2004–2009).
| DMT2 | p | |||
|---|---|---|---|---|
| Yes, n (%) | No, n (%) | |||
| Sex | Male | 1032 (51.7) | 1980 (54.0) | 0.087 |
| Female | 966 (48.3) | 1685 (46.0) | ||
| E.R.C. stadium | 1 | 167 (8.4) | 406 (11.1) | 0.00 |
| 2 | 365 (18.3) | 606 (16.5) | ||
| 3a | 539 (27.0) | 1048 (28.6) | ||
| 3b | 605 (30.3) | 1059 (28.9) | ||
| 4 | 287 (14.4) | 481 (13.1) | ||
| 5 | 35 (1.8) | 65 (1.8) | ||
| Age | Under 65 | 755 (37.8) | 1702 (69.3) | <0.001 |
| 65 and over | 1243 (62.2) | 1963 (53.6) | ||
| HTN | 1936 (96.9) | 3284 (89.6) | <0.001 | |
| Dyslipidemia | 1401 (70.1) | 2070 (56.5) | <0.001 | |
| Cardiovascular diseasea | 581 (29.1) | 762 (20.8) | <0.001 | |
| Obesity | 398 (19.9) | 381 (10.4) | <0.001 | |
| EPS | PPR | 1521 (76.1) | 2681 (73.2) | 0.014 |
| CT | 477 (23.9) | 984 (26.8) | ||
| Nephrotoxic | 126 (6.3) | 343 (9.4) | <0.001 | |
| Nephroprotectors | 1553 (77.7) | 2561 (69.9) | <0.001 | |
DMT2: diabetes mellitus type 2; CKD: chronic kidney disease; HTN: arterial hypertension; PPR: renal protection program; CT: conventional treatment.
The median weight in the T2DM group was 68kg and in the group without T2DM it was 60kg (p<0.001). The median 24-h proteinuria was 265mg/day and 190mg/day in the T2DM and non-DMT2 groups respectively (p<0.001). Regarding the lipid profile, the median value of triglycerides and HDL was 170mg/dL and 41mg/dL in the patients with T2DM and 154mg/dL and 43.3mg/dL in the control group respectively (p<0.005) (Appendix B, Supplementary Table 2).
In the group of patients with CKD stages 3, 4 and 5, there was a higher prevalence of comorbidities such as hypertension, dyslipidemia and cardiovascular disease, as well as more frequent use of nephroprotectors, all with significant differences (p<0.01). No significant differences were found regarding the prevalence of T2DM in both groups (Appendix B Supplementary Table 1).
Mortality risk according to CKD stage and the presence of T2DMThe analysis found that both the stage of CKD (RR of CKD stages 3, 4, 5 vs. 1, 2=3.6; 95% CI=2.6–4.8) and diabetes (RR=1, 7; 95% CI=1.35– 2.14) behave as significant risk factors for mortality.
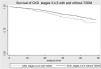
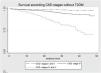
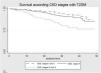
Survival modelsIn the Kaplan–Meier curves, comparing T2DM patients vs. those without T2DM, all in CKD stages 3–4–5, it is observed that the probability of survival is higher in the group without T2DM showing statistically significant differences (Log-rank p=0.0076) (Fig. 1). A subgroup analysis of patients with and without diabetes, no significant differences were observed between CKD stages 3 or 4–5 (Log-Rank test p=0.70 and p=0.95, Figs. 2 and 3, respectively).


The association of T2DM with mortality between the different CKD stage strata was evaluated using the Mantel–Haenszel technique, statistically significant differences were found in stages 3–4–5: OR 1.49 (95% CI: 1.17; 1. 91) and in stages 1–2: OR 5.47 (95% CI: 2.42; 12.39). The Breslow–Day statistical criterion shows a p value of 0.002, confirming that the stage behaves as an interaction variable in the association of T2DM with mortality.
Analysis of the interaction in the additive and multiplicative scales showed that it was significant in both scales: the joint effect observed is less than expected, which accounts for a negative or antagonistic interaction. Heterogeneity is also observed in the strata of both scales, which indicates that it is a quantitative interaction, that is, the association with the outcome of death is in the same direction, although with different magnitude (Table 3).
Evaluation of the CKD stage–DMT2 interaction in two cohorts of patients in renal care (Medellín, Colombia, 2004–2009).
| DMT2 | No DMT2 | |||||
|---|---|---|---|---|---|---|
| Incidence of death n (%) | OR* | RD** | Incidence of death n (%) | OR* | RD** | |
| Stages 1–2 | 22 (4.2) | 5.29 | 3.4% | 8 (0.8) | 1.0 (reference) | 0.0% (reference) |
| Stages 3–4–5 | 126 (8.5) | 10.77 | 7.8% | 156 (5.9) | 7.4 | 5.1% |
| Expected OR (mulplicative scale): 39.14 | Observed OR: 10.77 | |||||
| Expected RD (additive scale): 8.5 | Observed RD: 7.8 | |||||
In the multivariable analysis, the T2DM–CKD stage interaction was also evaluated by means of an additional term, adjusting for covariates, finding that it was statistically significant (p=0.005). This was confirmed by the difference in the likelihood ratio test between the complete and nested models (p=0.0028) (Supplementary Tables 3 and 4).
Final adjusted analysis by T2DM subgroupsIn the multivariable analysis, it was found that the CKD stage and the covariates age, hypertension, dyslipidemia, and EPS are associated with mortality in patients without T2DM (Table 4). By contrast, in patients with T2DM, only age, dyslipidemia, and the use of nephroprotectors were found to be significantly associated with mortality (Table 5).
Cox proportional hazards model for death in patients with CKD without T2DM (n=3665).
| Variable | Hazard ratio (95% CI) | p |
|---|---|---|
| EPS (TC vs. PPR) | 1.62 (1.14–2.30) | 0.007 |
| ERC stage (3, 4, 5 vs. 1, 2) | 3.23 (1.52–6.87) | 0.002 |
| Age (>65 vs. <65 years) | 5.09 (3.04–8.50) | <0.001 |
| Sex (male vs. female) | 1.05 (0.77–1.45) | 0.742 |
| HTN | 0.56 (0.32–0.98) | 0.044 |
| Dyslipidemia | 0.34 (0.24–0.47) | <0.001 |
| Nephrotoxic | 1.16 (0.67–2.01) | 0.601 |
| Nephroprotectors | 0.80 (0.56–1.14) | 0.224 |
| Cardiovascular disease | 1.38 (0.99–1.94) | 0.057 |
EPS: health service provider company; CKD: chronic kidney disease; HTN: arterial hypertension; PPR: renal protection program; CT: conventional treatment.
Cox proportional hazards model for death in CKD patients with T2DM (n=1998).
| Variable | Hazard ratio (95% CI) | p |
|---|---|---|
| EPS (TC vs. PPR) | 1.22 (0.82–1.82) | 0.330 |
| ERC stadium (3, 4, 5 vs. 1, 2) | 1.51 (0.94–2.42) | 0.090 |
| Age (>65 vs. <65 years) | 1.80 (1.20–2.70) | 0.005 |
| Sex (man vs. woman) | 0.92 (0.66–1.27) | 0.616 |
| HTN | 0.45 (0.20–1.04) | 0.061 |
| Dyslipidemia | 0.40 (0.29–0.56) | <0.001 |
| Nephrotoxic | 0.70 (0.31–1.59) | 0.394 |
| Nephroprotectors | 0.60 (0.39–0.91) | 0.016 |
| Cardiovascular disease | 1.35 (0.95–1.91) | 0.090 |
EPS: health service provider company; CKD: chronic kidney disease; HTN: arterial hypertension; PPR: renal protection program; CT: conventional treatment.
Our study confirmed the interaction or modification of the effect of CKD stage and the presence of T2DM, with respect to the risk of death, in two cohorts from different care programs of patients with kidney disease.
The association of T2DM and CKD with mortality is explained by the pathophysiology of these conditions and their causal relationship1–3,17–19 has been reported in multiple previous studies.20–25 In 2011, Astor et al. in a cohort with 21,688 patients, found that a reduction in GFR of 15mL/min/1.73m2 below 45mL/min/1.73m2 is associated with an increase in the mortality rate of 47%.10 The results of previous studies regarding the ERC–DMT2 interaction are not uniform; in 2013, a study including 15,046 individuals from the National Health and Nutrition Examination Survey III database found that the additive interaction between T2DM and kidney disease was significant, but not the multiplicative interaction. More than 50% of the patients considered in the renal disease group had a GFR>60mL/min/1.73m2 (stages 1 and 2) and were included in this group because they only had the presence of albuminuria,26 which makes the results not comparable with ours. A meta-analysis published in 2012 that included more than one million patients found that the interaction between T2DM and CKD is not significant with respect to mortality, both in the total range of GFR and in the different stages of CKD.8 However, it did find an increased risk of mortality in patients with both risk factors compared with patients who only have CKD.8 Similar results were presented in 2018 in a preliminary study27 that included 2108 patients. Most of the studies that evaluate mortality in patients with CKD or T2DM do not evaluate risk differences in patients with and without T2DM.10,28–32 The differences observed between the studies may be due to racial differences between the Latino and North American populations and the criteria used to define CKD.
Unlike the previously mentioned studies, the present study found the presence of interaction between the CKD stage and the presence of T2DM on both the additive and multiplicative scales. Furthermore, the type of interaction is negative, that is, although each of the covariates had an independent effect on the increased risk of death, in the presence of both diseases the increase in risk is less than expected. Comparison of mortality between diabetics and non-diabetics in stages 3–4–5 showed that patients with T2DM had significant higher risk of mortality (Fig. 1). However, when dividing the different stages by strata, no significant differences were found regarding mortality between patients with and without a diagnosis of T2DM (Figs. 2 and 3). This could be explained by the low mortality rate in stage 3 and the small sample size in stages 4–5, which does not allow us to detect statistically significant differences.
We also found that in the presence of T2DM and when adjusting for covariates, only age continues to be a significant risk factor for death, while dyslipidemia and the use of nephroprotectors seem to confer some reduction in the risk of death. The finding of dyslipidemia as a protective factor may correspond to the known phenomenon of “reverse epidemiology”.11 That is, although dyslipidemia is known as an independent risk factor for morbidity and mortality, in this case in patients with advanced stages of CKD it represents a protective factor. As an explanation for this, it is proposed that low lipid levels behave as a marker of inflammation and malnutrition in kidney patients, so that high levels of these represent a better prognosis in dialysis patients.11,33
T2DM plays an important role as a risk factor for mortality in patients with CKD and if present, other variables are no longer significant. Tonelli et al, in a 2006 meta-analysis, which included more than one million patients, showed that the risk of mortality in patients with CKD was lower in those studies that performed analyzes adjusted for covariates, compared to those that only presented crude analysis.21 This may represent the impact of comorbidities such as T2DM on mortality risk.
Among the limitations of this study, it stands out the observational design, with data taken from a previous study, which were recalculated and adapted to current guidelines. Some conventional cardiovascular and death risk variables such as smoking, overweight or poor control of chronic diseases (such as T2DM or HTA) were not taken into account due to lack of data. This does not allow adjustment for these variables or subgroup analysis according to the degree of control. The study population is exclusively Colombian, which allows the results to be adapted to other Latin American countries, but makes it difficult to generalize to countries outside the region. The missing data in some individuals could represent an information bias, but since these losses were not different between the living and the dead, it is expected that the observed associations would be of even greater magnitude.
This study suggests that there is evidence adaptable to Latin America on the impact on mortality of the addition of other risk factors such as diabetes to CKD, as well as the possible need for strict control of these comorbidities to reduce the risk of death. It is necessary to perform a study that includes individuals from other Latin American countries and with measurements on the degree of control of DMT2 and other comorbidities.
ConclusionThe risk of mortality in patients with stages 3–4–5 CKD is modified in the presence of T2DM on the additive and multiplicative scale with a negative relationship. The observed increased risk in individuals with both diseases is less than expected.
FinancingThis work was financed by Colciencias, Universidad de Antioquia and EPS Sura.
Conflict of interestsThe authors declare that they have no conflict of interest.
ThanksJohana Ascuntar (BSc).
The following is Supplementary data to this article:


