Objetivo: Comparar in vitro la dinámica de la secreción de hormona paratiroidea (PTH) regulada por calcio y su relación con el ciclo celular en adenomas frente a hiperplasia de paratiroides. Material y métodos: Ocho adenomas de paratiroides y 23 glándulas hiperplásicas procedentes de 8 pacientes con hiperparatiroidismo primario y 7 pacientes con hiperparatiroidismo secundario, respectivamente. Para el estudio de la dinámica de secreción, pequeños fragmentos de tejido paratiroideo se transfirieron secuencialmente a intervalos de una hora a pocillos con concentraciones variables de calcio: 0,4, 0,6, 0,8, 1,0, 1,25, y 1,35 o 1,5 mM. Se determinaron las concentraciones de iPTH en el medio. Células paratiroides se aislaron sin el uso de enzimas y el ciclo celular paratiroideo se analizó por el método de Vindelov. El núcleo se adquirió por citometría de flujo y se analizó usando un software CELLFIT. Resultados: En los tejidos paratiroideos de las glándulas hiperplásicas, el aumento del calcio extracelular produjo una disminución de la secreción de PTH manifestada con valores de calcio de 0,8 mM y una inhibición máxima de secreción de PTH con un calcio de 1,25 mM. Por el contrario, en los tejidos de los adenomas de paratiroides se requirieron concentraciones de Ca de 1,2 mM para provocar una mínima disminución de la secreción de PTH. En los adenomas no hubo correlación entre las fases del ciclo celular y la calcemia o el set point, en las hiperplasias hubo una correlación significativa entre el porcentaje de células en fase G0/G1 con el set point (r = 0,914; p <0,005) y el calcio sérico basal (r = 0,862; p <0,02). Conclusiones: La regulación de la secreción de PTH por el calcio extracelular in vitro es menos sensible en adenomas que en glándulas hiperplásicas paratiroideas. En hiperplasia paratiroidea la proliferación celular parece estar regulada por la concentración de calcio extracelular (a mayor calcemia menor proliferación).
Aim: To compare the dynamics of calcium-regulated PTH secretion in vitro from adenomatous versus hyperplastic glands and to investigate the relationship between the parathyroid cell cycle and the calcium-regulated PTH secretion in these glands. Materials and methods: A total of 31 parathyroid glands (8 adenomatous and 23 hyperplastic) from 8 patients with primary hyperparathyroidism and 7 with secondary hyperparathyroidism respectively were studied. For the evaluation of calcium-regulated PTH secretion, small parathyroid pieces of 1 mm were sequentially transferred to wells with varying Ca concentrations: 0.4, 0.6, 0.8, 1, 1.25 and 1.35 or 1.5 mM. PTH concentrations were determined in the medium. For the parathyroid cell cycle studies, parathyroid cells were isolated without the use of enzymes and cell cycle was analyzed using the method described by Vindelov. The nuclei were acquired by flow cytometer and analyzed using the CELLFIT software. Results: In parathyroid tissues from hyperplastic glands, the increase in extracellular calcium produced a decrease in PTH secretion which was apparent with a calcium level as low as 0.8 mM and the maximal inhibition of PTH secretion was obtained with a calcium of 1.25 mM, by the contrary, adenomatous glands required a calcium of 1.2 mM to produce a minimal decrease in PTH secretion. In hyperplastic parathyroid glands but not in parathyroid adenomas there was a significant correlation between the percentage of cells in G0/G1 phase with the set point (r = 0.914; P <0.005) and the basal serum Ca (r = 0.862; P <0.02). Conclusions: The control of the extracellular calcium-PTH release in vitro is less sensitive in parathyroid adenomas than hyperplasic parathyroid glands. In parathyroid hyperplasia the cell proliferation may be regulated by the extracellular calcium concentration (higher calcemia less proliferation).
INTRODUCTION
It has been known for some time that serum calcium is the main factor responsible for the stimulation and inhibition of parathyroid hormone (PTH) secretion and that there is an inverse sigmoidal relationship between the concentration of calcium and PTH.1
The parathyroid gland is particularly sensitive to changes in serum calcium, and thus, small reductions in the concentration of calcium cause rapid increases in PTH secretions, while small increases in serum calcium decrease PTH secretions.
Some studies in vivo and in vitro have demonstrated that the PTH response to changes in calcium concentrations is abnormal in patients with primary hyperparathyroidism2,3 and in uraemic patients with secondary hyperparathyroidism.4
At present, it is known that calcium exerts its action through the specific calcium-sensing receptor of the parathyroid cell5,6 and it has been suggested that a decrease in its density could be responsible for the decreased response to changes in calcium concentrations in the hypertrophic parathyroid glands and the adenomatous glands.7
So far, the in vitro comparison of the calcium-regulated PTH response of adenomas from patients with primary hyperparathyroidism versus hyperplastic glands from patients with secondary hyperparathyroidism has not been fully studied.8
Additionally, it is known that different concentrations of calcium can stimulate or halt the proliferation of parathyroid cells,9 but the relationship between the cell cycle and the calcium concentration of parathyroid adenomas and glandular hyperplasia has also not been studied thoroughly.
The aim of this study was to compare the dynamic of calcium-regulated PTH secretion in vitro in adenomas versus hyperplastic glands and to assess the relationship between the parathyroid cell cycle and the calcium-regulated PTH secretion in these glands.
MATERIAL AND METHOD
Patients
The study included glands from eight patients with primary hyperparathyroidism and seven from patients with chronic kidney disease with secondary hyperparathyroidism.
Parathyroid tissue
A total of 31 parathyroid glands were included in the study, along with 8 adenomas and 23 glands with diffuse hyperplasia, which were processed in the following manner: immediately after resection, both the adenomatous and the hyperplastic glands were separated in several aliquots and incubated at 4°C in RPMI with calcium concentrations of 1.5mM for 16-18 hours until an in vitro study was carried out.
One of the incubated aliquots of each gland was used to evaluate PTH secretion in vitro and another was used to study the cell cycle.
Evaluation of calcium-regulated parathyroid hormone secretion in vitro
Incubation medium
The parathyroid tissue aliquot was cut into pieces of approximately 1mm3 that were then separated into individual nylon wells, each in 2ml of an incubation medium at 37° C (AOS-0, SBS Instruments S.A., Badalona, Spain). The incubation medium was a buffered solution (pH= 7.4) containing in mM, NaCl 125, KCl 5.9, MgCl2 0.5, NaH2PO4 and Na2HPO4 (1:2) 1, Na-pyruvate 1, glutamine 4, glucose 12, Hepes 25 with quick insulin 0.1 U/ml, 0.1% bovine serum albumin, penicillin G 100 U/ml, streptomycin 100μg/ml and CaCl2 ranging from 0.4 to 1.5.
Calcium-regulated parathyroid hormone secretion
After five hours of incubation, the parathyroid tissue was sequentially transferred in hourly intervals to other wells containing solutions with varying concentrations of calcium: 0.4, 0.6, 0.8, 1.0, 1.25 and 1.35 or 1.5mM. Calcium concentrations were confirmed for each experiment employing the measurement of ionised calcium using a selective electrode (model 634, Ciba Corning, Essex, United Kingdom). The ionised calcium in the medium was kept constant during the incubation period. PTHi concentration in the incubation medium was measured using the human PTHi IRMA assay (Nichols Institute, San Juan Capistrano, CA, USA) with an intra-assay and inter-assay coefficient of variation of 4.3% and 4.7%, respectively. The serum ionised calcium was measured with a calcium-selective electrode (Ciba Corning c-634).
Terminology
The following terms were used: 1) Baseline PTH, the PTH value before induction of hypocalcaemia or hypercalcaemia; 2) Peak PTH, the highest PTH value observed in response to hypocalcaemia and whose value could not be increased by a reduction in serum calcium concentration; 3) Minimum PTH, the lowest PTH level during the supression by hypercalcaemia and whose value could not be lowered by later increases in serum calcium; 4) the set point of PTH secretion was calculated in two ways: one as the serum calcium concentration that reduced the maximum PTH secretion by 50% and the other as the calcium concentration that reduced the PTH secretion by half between the maximum and minimum secretion.10
Parathyroid cell cycle analysis
Parathyroid cells were isolated without the use of enzymes. Small parathyroid tissue fragments were squashed using DuPont forceps under an inverted microscope (x10) followed by gentle pipetting. To maintain a high cellular concentration, all of these manipulations were performed with low volumes of PBS (50μl).
The parathyroid cell cycle was analysed using the method described by Vindelov and Christensen.11 Briefly, the clean cell nuclei were isolated by the combined action of the nonionic detergent Nonidet-P40 and trypsin, followed by treatment with trypsin inhibitor (type II-0) to stop the reaction of trypsin, and with RNase, to prevent the dye from joining with the double-stranded RNA. In the final step, the isolated nuclei were strained with propidium iodide and stabilised with spermine.
The nuclei were acquired by flow cytometry (FACScan, Beckton-Dickinson, CA, USA) and analysed using CELLFIT software (Beckton-Dickinson).
Cell viability was evaluated by flow cytometry. The cells were stained with green fluorodiacetate (15min at 37°C in darkness), which stains living cells, and red propidium iodide (5min at 37°C in darkness), which marks dead cells. Subsequently, the cells were introduced into the flow cytometer and analysed with Lysis II software (Beckton-Dickinson). 12
Reactants
The RPMI was purchased from Biowhittaker, Vervier, Belgium; the PBS from Oxoid, Hampshire, United Kingdom; and all other reagants from Sigma, St. Louis, MO, USA.
Statistical analysis
Values are expressed as mean ± SD. We used ANOVA and Duncan’s test for comparing multiple averages. The unpaired t-test was used to evaluate differences between group averages. The correlation between two variables was evaluated by linear regression analysis.
RESULTS
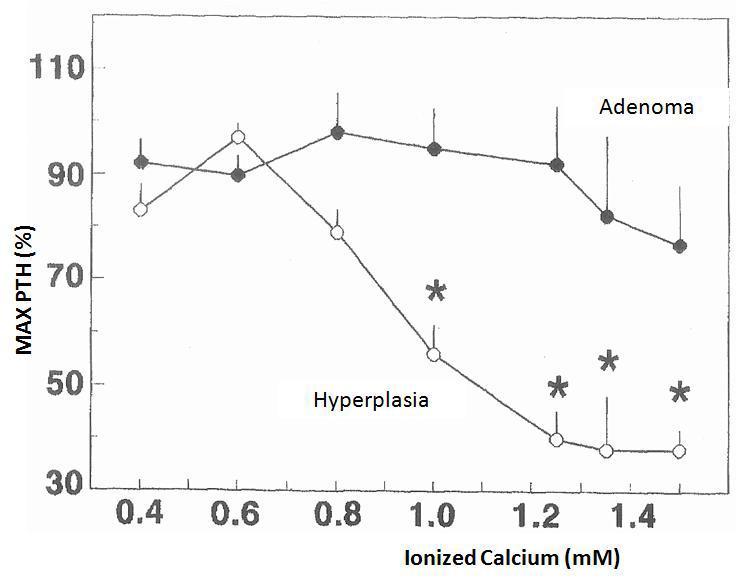
The changes in calcium-regulated PTH secretion in vitro in the 23 hyperplastic parathyroid glands and the 8 adenomas described earlier are shown in Figure 1. The increase in extracellular calcium in the parathyroid tissues of the hyperplastic glands decreased the secretion of PTH manifested in calcium values of 0.8mM and a maximum inhibition of PTH secretion in a calcium value of 1.25mM. In contrast, the parathyroid adenoma tissues required Ca concentrations of 1.2mM to cause a slight decrease in PTH secretion, achieving inhibition of secretion with an increase in Ca concentration.
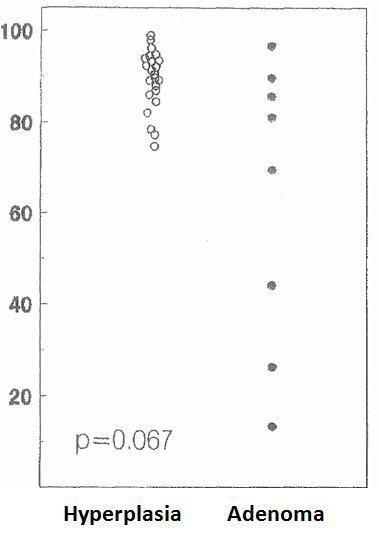
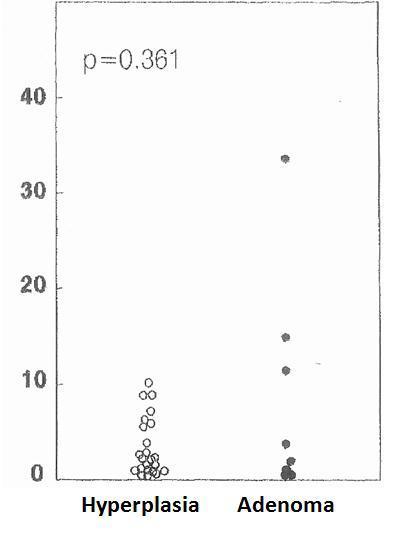
The cell cycle analysis showed that the percentage of G0/G1-phase parathyroid cells in parathyroid adenomas varied from 13% to 97%, with a mean of 64%±12%. These values contrast with those observed in secondary hyperplastic glands, which were always greater than 74% with a mean of 89%±3% (Figure 2). Similarly, the precentage of S-phase cells was less than 10% in hyperplastic parathyroid glands while 3 of the 8 parathyroid adenomas had more than 11% S-phase cells (Figure 3).
There were no significant differences between the values of the mean percentages of G0/G1-phase or S-phase cells of the adenomas with respect to the hyperplastic glands.
To evaluate a possible association between the severity of hyperparathyroidism and the percentage of cells at rest (G0/S1 phase), the minimum and maximum basal PTH values were correlated with the percentage of G0/G1-phase cells.
There was no significant correlation in the adenomas.
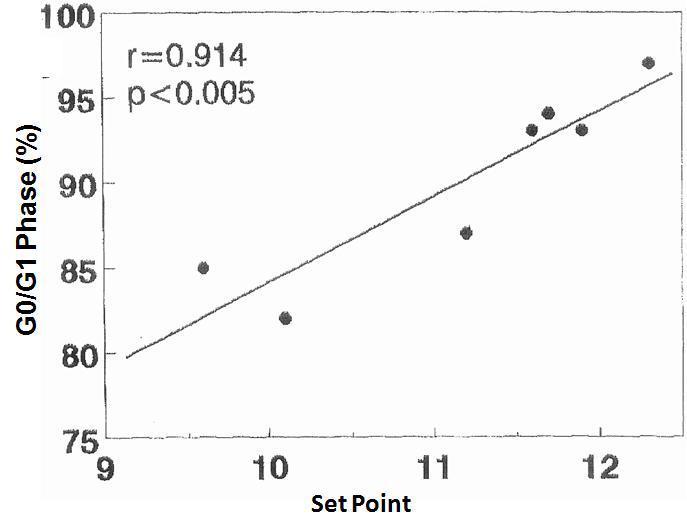
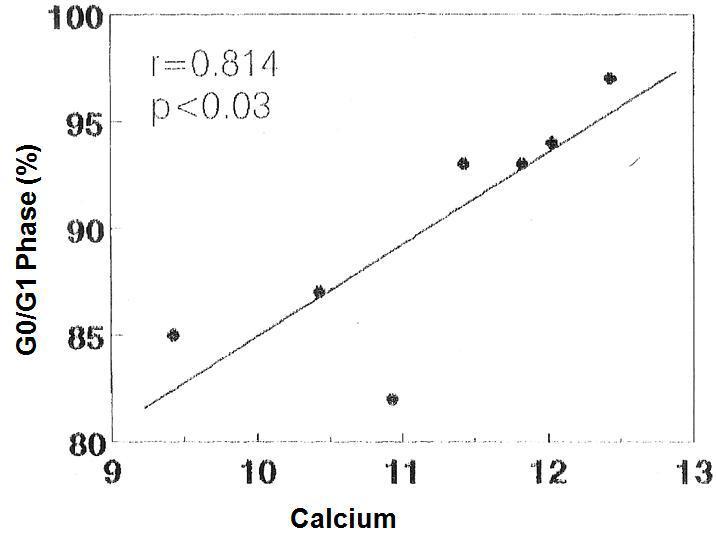
There was no significant correlation in the hyperplastic glands between the minimum and maximum basal PTH concentrations and the percentage of cells in G0/G1 phase (r values = 0.525, 0.0821 and 0.709, respectively). However, there was a significant correlation between the percentage of G0/G1 phase cells with the calcium set point (r= 0.914, p< 0.005) (Figure 4) and the basal serum calcium concentration (r= 0.862; p <0.02) (Figure 5), in other words, the greater the calcium concentration, the lesser the proliferation.
DISCUSSION
Previous studies have shown that the regulation of PTH secretion in vivo in response to changes in calcium concentration is altered both in primary and secondary hyperparathyroidism.6-8,13 Other studies have shown that the set point of Ca, both in vivo and in vitro, and the non-suppresive PTH secretion is greater in patients with hyperparathyroidism than in healthy subjects.14-16
In a recent study10 using hyperplastic tissue, it was observed that although there are differences between the set point of calcium in vivo and in vitro, the maximum degree of PTH inhibition and the dynamic of calcium-regulated PTH secretion are similar in both circumstances, which means we can extrapolate that the results obtained in vitro with intact tissue are similar to those produced in vivo.
In vitro studies using isolated parathyroid cells from adenomatous and hyperplastic glands have shown that the set point of PTH secretion was greater than in normal parathyroid tissue, suggesting abnormal regulation of PTH secretion by calcium.6-8,14
In our study, unlike previous ones, calcium-regulated PTH secretion in vitro was assessed in parathyroid adenomas and in secondary parathyroid hyperplasia using small quantities of intact parathyroid tissue. This study shows that calcium-regulated PTH secretion is clearly different between parathyroid adenomatous and hyperplastic glands, with PTH secretion being minimally inhibited by calcium in adenomas and progressively reduced in hyperplastic glands despite involving patients with significantly higher basal PTH levels than those with adenomas.
The concentration of extracellular calcium required to reduce PTH secretion was significantly greater in adenomas than in hyperplastic glands. These results indicate that the suppressibility of PTH secretion in adenomas is reduced when compared with hyperplastic glands. These findings are similar to others reported in the scientific literature and in those studies that used isolated parathyroid cells.7 In our case, the difference between adenomatous and hyperplastic tissue appears magnified, which could be attributed to the fact that we used intact tissue, which may be more comparable to the in vivo situation. A change in the calcium-sensing receptor in the parathyroid cells could explain this difference. Some studies have shown that the protein and messenger RNA of the calcium-sensing receptor are decreased in both parathyroid adenomas and in hyperplastic glands, although more so in adenomas.17-19 Nevertheles, in a similar study, the calcium-sensing receptor protein determined by immunohistochemistry did not differ between adenomas and hyperplasia.20 Other studies have shown considerable variation in the number of cells with calcium receptor deficit in parathyroids adenomas, but in any case, there is always a significant reduction in the expression of the Ca receptor.21
Regarding parathyroid adenomas, there was a wide range in the percentage of cells in the G0/G1 phase (from 13% to 97%), in contrast to secondary hyperplasia that had more than 74% of cells in the G0/G1 phase. These findings are similar to those reported by other work groups showing that the percentage of cells in G0/G1 phase in parathyroid adenomas was between 10% and 90%, while in secondary hyperplasia all glands had more than 70% of the cells in the G0/G1 phase.22-24 These data suggest a different pathological growth stimulant for parathyroid adenomas with respect to hyperplastic glands. There were no statistical differences between the mean average of cells in the G0/G1 phase in adenomas versus those in secondary hyperplasia, perhaps because of the high dispersion of the values in the group of adenomas.
It is known that cells in the hyperplastic parathyroid glands show moderate proliferative activity. In order to proliferate, a cell must enter the cell cycle phase where DNA synthesis and subsequent mitosis occurs, and follow an organised process.25,26 The progression through the cell cycle ensures that DNA replication is complete before mitosis occurs. During the transition through the cell cycle, a cell can remain at rest at a number of specific checkpoints that prevent the completion of the cell cycle and thereby proliferation.
An interesting observation from our study was the good correlation between the set point of PTH secretion and basal calcium with the percentage of cells in the G0/G1 phase. In fact, the high calcium concentrations were associated with a low percentage of proliferating cells. These results show that in the hyperplastic glands, parathyroid cells are not always in a proliferation phase, as expected.
Additionally, hypocalcaemia is considered an important factor in the generation and development of secondary hyperparathyroidism due to the effect on the stimulation of parathyroid proliferation.22 Our findings indicate that control of parathyroid cell proliferation by calcium is maintained even in advanced stages of secondary hyperparathyrodism.
In conclusion, the regulation of PTH secretion by extracellular calcium in vitro is less sensitive in parathyroid adenomas than in parathyroid hyperplastic glands. Also, cell proliferation in parathyroid hyperplasia by secondary hyperparathyroidism seems to be regulated by the concentration of extracellular calcium; in other words, the higher the calcaemia the lower the proliferation.
From all of this we can deduce that a certain degree of hypercalcaemia, or perhaps more importantly, treatment with calcimimetics, may slow cell proliferation in secondary hyperparathyroidism. With this we could theoretically prevent monoclonal growth and the formation of adenomas, which are much more difficult to control.
Table 1. Clinical characteristics and pathological findings
Figure 1. Changes in calcium-regulated PTH secretion in vitro: adenoma versus parathyroid hyperplasia
Figure 2. Percentage of cells in G0-G1 phase (%)
Figure 3. Percentage of cells in S phase (%)
Figure 4. Correlation between percentage of cells in G0/G1 phase with the set point of calcium
Figure 5. Correlation between percentage of cells in G0/G1 phase with the [Ca]


