


Diabetic nephropathy (DN) which refers to the cases with biopsy proven kidney lesions, is one of the main complications of diabetes all around the world; however, the underlying biological changes causing DN remain to be understood. Studying the alterations in gene expression profiles could give a holistic view of the molecular pathogenicity of DN and aid to discover key molecules as potential therapeutic targets. Here, we performed a meta-analysis study that included microarray gene expression profiles coming from glomerular samples of DN patients in order to acquire a list of consensus Differentially Expressed Genes (meta-DEGs) correlated with DN.
MethodsAfter quality control and normalization steps, five gene expression datasets (GES1009, GSE30528, GSE47183, GSE104948, and GSE93804) were entered into the meta-analysis. The meta-analysis was performed by random effect size method and the meta-DEGs were put through network analysis and different pathway enrichment analyses steps. MiRTarBase and TRRUST databases were utilized to predict the meta-DEGs related miRNAs and transcription factors. A co-regulatory network including DEGs, transcription factors and miRNAs was constructed by Cytoscape, and top molecules were identified based on centrality scores in the network.
ResultsThe identified meta-DEGs were 1364 DEGs including 665 downregulated and 669 upregulated DEGs. The results of pathway enrichment analysis showed, “immune system”, “extracellular matrix organization”, “hemostasis”, “signal transduction”, and “platelet activation” to be the top enriched terms with involvement of the meta-DEGs. After construction of the multilayer regulatory network, several top DEGs (TP53, MYC, BTG2, VEGFA, PTEN, etc.), as well as top miRNAs (miR-335, miR-16, miR-17, miR-20a, and miR-93), and transcription factors (SP1, STAT3, NF-KB1, RELA, E2F1), were introduced as potential therapeutic targets in DN. Among the regulatory molecules, miR-335-5p and SP1 were the most interactive miRNA and transcription factor molecules with the highest degree scores in the constructed network.
ConclusionBy performing a meta-analysis of available DN-related transcriptomics datasets, we reached a consensus list of DEGs for this complicated disorder. Further enrichment and network analyses steps revealed the involved pathways in the DN pathogenesis and marked the most potential therapeutic targets in this disease.
La nefropatía diabética (ND), que se refiere a los casos con lesiones renales comprobadas por biopsia, es una de las principales complicaciones de la diabetes en todo el mundo. Sin embargo, los cambios biológicos subyacentes que causan la ND aún no se han entendido. Aquí realizamos un estudio de metaanálisis que incluyó perfiles de expresión génica de micromatrices provenientes de muestras glomerulares de pacientes con ND para adquirir una lista de genes expresados diferencialmente (meta-DEG) de consenso correlacionados con ND.
MétodosDespués de los pasos de control de calidad y normalización, se ingresaron en el metaanálisis cinco conjuntos de datos de expresión génica (GES1009, GSE30528, GSE47183, GSE104948 y GSE93804). El metaanálisis se realizó mediante el método de tamaño de efecto aleatorio y los meta-DEG se sometieron a análisis de red y a diferentes pasos de análisis de enriquecimiento de ruta. Se utilizaron las bases de datos MiRTarBase y TRRUST para predecir los factores de transcripción y los miARN relacionados con los meta-DEG. Cytoscape construyó una red de corregulación que incluye DEG, factores de transcripción y miARN, y las moléculas principales se identificaron en función de las puntuaciones de centralidad en la red.
ResultadosLos meta-DEG identificados fueron 1.364 DEG, incluidos 665 DEG regulados negativamente y 669 regulados positivamente. Los resultados del análisis de enriquecimiento de vías mostraron que «sistema inmunitario», «organización de la matriz extracelular», «hemostasia», «transducción de señales» y «activación de plaquetas» son los términos más enriquecidos con la participación de los meta-DEG. Después de la construcción de la red reguladora multicapa, varios DEG principales (TP53, MYC, BTG2, VEGFA, PTEN, etc.), así como miARN principales (miR-335, miR-16, miR-17, miR-20a y miR -93) y factores de transcripción (SP1, STAT3, NF-KB1, RELA, E2F1) se introdujeron como posibles dianas terapéuticas en la ND. Entre las moléculas reguladoras, miR-335-5p y SP1 fueron las moléculas de factor de transcripción y miARN más interactivas con las puntuaciones de grado más altas en la red construida.
ConclusiónAl realizar un metaanálisis de los conjuntos de datos transcriptómicos relacionados con ND disponibles, llegamos a una lista de consenso de DEG para este trastorno complicado. Los pasos posteriores de enriquecimiento y análisis de redes revelaron las vías involucradas en la patogénesis de la ND y marcaron los objetivos terapéuticos más potenciales en esta enfermedad.
Diabetic nephropathy (DN) is one of the common complications of diabetes all around the world and refers to the cases with biopsy proven kidney lesions.1 DN is known as the most common microvascular side effect of diabetes and approximately 50% of patients with DN ultimately need dialysis and kidney transplantation.2,3
DN is accompanied by some structural changes in the renal glomeruli which finally can lead to albuminuria.4,5 So far, various genetic and non-genetic factors were discovered to take part in the pathogenicity of DN.6 However, despite a huge number of investigations, the underlying molecular mechanisms of DN and the details of its pathogenicity are not yet fully understood. In addition, most current treatment options for DN are ineffective and include supportive and nonspecific treatments such as blood sugar control, blood pressure control, and dietary restrictions.7 Recently, thanks to the advent of high-throughput strategies, there has been a great opportunity for researchers to catch a big map of little changes in complicated diseases like DN. In this context, transcriptomic studies are good examples that enable researchers to assess a large number of expressional alterations in any disease state. Understanding the disease pathogenicity and discovery of potential therapeutic targets could be two big advantages of these omics-based investigations.8–10 However, transcriptomic studies are facing some well-known challenges. These studies have yielded a list of candidate genes, some of which could be false positives, then the achieved list might lack real-world genes of interest.11 The first consequence of this compromise is exploring unrelated gene ontologies or pathways, which finally give misleading information. To address this issue, one possible approach is to collect all the available and related data and perform a meta-analysis. Using this method could finally give more robust and consensus results.12 Accordingly, meta-analysis can greatly reduce the false positives caused by differences in sampling, homogeneity, and study design in transcriptomics datasets.13
The aim of the present study was to draw together all the publicly available DN-related glomerulus datasets and perform a meta-analysis in order to reach a consensus list of differentially expressed genes (DEGs) in this disease. Briefly, after selecting, quality checking, and normalizing, the related expression profiles were subjected to meta-analysis and the resulted list of candidate genes was considered for functional enrichment analyses. Besides, to identify the top molecules related to the pathogenicity of DN, a protein-protein interaction (PPI) network consisting of the candidate genes, as well as their related microRNAs (miRNAs) and transcription factors (TFs), was constructed and analyzed.
Materials and methodsDataset selection and quality controlAvailable human DN microarray datasets accessible through NCBI Gene Expression Omnibus (GEO) and ArrayExpress, deposited before 20/6/2020 were initially screened. “Diabetic Kidney” and “Diabetic Nephropathy” keywords were used for searching in databases. The inclusion criteria for selecting the datasets included: (a) expression profiles of human DN samples; (b) expression profiles of DN-glomerulus samples; (c) expression profiles comprising of control samples; and (d) expression profiles obtained from microarray chips. The exclusion criteria included: (a) expression profiles of non-human or non-DN cases; (b) expression profiles of non-glomerular biopsies; (c) expression profiles with no control samples; and (d) expression profiles obtained by other methods like real-time PCR or RNA-sequencing.
Principal component analysis (PCA) was used for quality valuation and identification of possible sample outliers in each distinct dataset. Quantile normalization was applied for each dataset to conform sample distribution and remove technical variations.
DEG identification and meta-analysisNetwork Analyst, a web interface for integrative meta-analysis was utilized to perform the meta-analysis and identify common DEGs in the expression profiles.13 The normalized expression profiles were uploaded in the required format, gene IDs were converted to gene symbols and the adjusted p-value cutoff of <0.05 was considered for dataset analysis and DEG identification. The batch effects were removed using ComBat procedure. The random effect size was selected for the meta-analysis based on the results of Cochran's Q-test (estimating statistical heterogeneity).14–16
Gene ontology and pathway analysisThe resulted meta-DEGs were subjected to gene ontology (GO) (molecular function, biological process, and cellular component) and pathway enrichment analysis. Meta-DEGs were uploaded to the EnrichR server and the enriched GO terms and Reactome pathways were extracted. Cytoscape software (version 3.8.2)17 and EnrichmentMap plugin (version 3.3) were applied for visualization of the enrichment results. With grouping the significant gene sets based on their similarity, the EnrichmentMap plugin could simplify the understanding of the huge number of enriched gene sets.
Interactive network construction, hub gene analysis and identificationMiRTarBase (Release 7)18 and TRRUST (Version 2)19 databases were used to predict the upstream regulators (miRNAs and TFs) of the meta-DEGs in the regulatory network. The construction and visualization of the regulatory network were done using Cytoscape software. After analysis of the constructed network, top meta-DEGs, top miRNAs, and top TFs were identified based on their centrality measures using the cytoHubba plugin20 in Cytoscape.
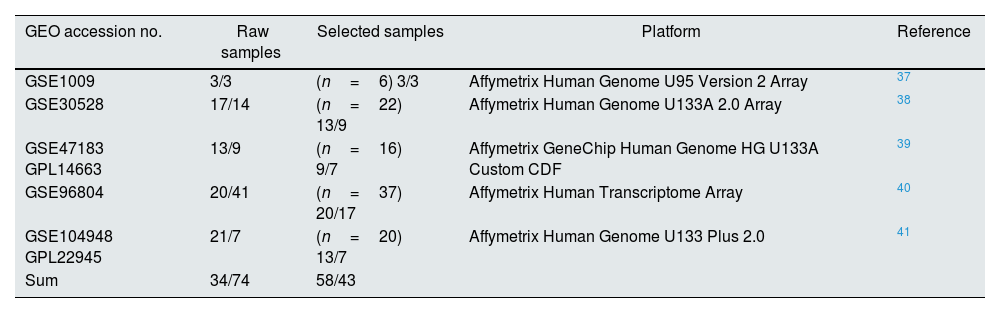
ResultsDataset selection and quality control: five expression profiles were selected for further analysisInitially, 12 microarray expression profiles, including 4 profiles from non-kidney samples, 3 profiles from interventional studies, and 5 profiles coming from glomerular DN and healthy samples were retrieved from GEO and Array Express databases. The 5 profiles containing untreated human glomerular control (no: 74) and DN biopsies (no: 43) were found suitable for further pre-analyses steps. The GEO accessions of the selected expression profiles were GSE30528, GSE47183 (GPL14663), GSE1009, GSE96804, and GSE104948 (GPL22945). Detailed information of the selected datasets is provided in Table 1. Fig. 1 shows the flow diagram of the present study and Fig. 2 shows the flow diagram of microarray data identification, screening and selection.
Detailed information of the selected datasets.
| GEO accession no. | Raw samples | Selected samples | Platform | Reference |
|---|---|---|---|---|
| GSE1009 | 3/3 | (n=6) 3/3 | Affymetrix Human Genome U95 Version 2 Array | 37 |
| GSE30528 | 17/14 | (n=22) 13/9 | Affymetrix Human Genome U133A 2.0 Array | 38 |
| GSE47183 GPL14663 | 13/9 | (n=16) 9/7 | Affymetrix GeneChip Human Genome HG U133A Custom CDF | 39 |
| GSE96804 | 20/41 | (n=37) 20/17 | Affymetrix Human Transcriptome Array | 40 |
| GSE104948 GPL22945 | 21/7 | (n=20) 13/7 | Affymetrix Human Genome U133 Plus 2.0 | 41 |
| Sum | 34/74 | 58/43 |


PCA (principal component analysis) is a well-known method to discover similarities and differences among samples via decreasing data dimensionality. This method is mostly utilized as a tool for assessing dataset quality and detection of outliers.21 After performing PCA, removal of outliers, normalization, and batch effect removal steps, 58 DN and 34 control samples were selected for the meta-analysis (Fig. 3A–D).
: PCA plots before and after batch effect removal depicting the similarities and differences between the case and control samples. (C and D): Density plots against log2 of read counts, before and after batch effect removal showing the relative distribution of different counts in each group. (E): The heatmap of top 50 DEGs according to adjusted p-value.")
Data preprocessing and processing; (A and B): PCA plots before and after batch effect removal depicting the similarities and differences between the case and control samples. (C and D): Density plots against log2 of read counts, before and after batch effect removal showing the relative distribution of different counts in each group. (E): The heatmap of top 50 DEGs according to adjusted p-value.
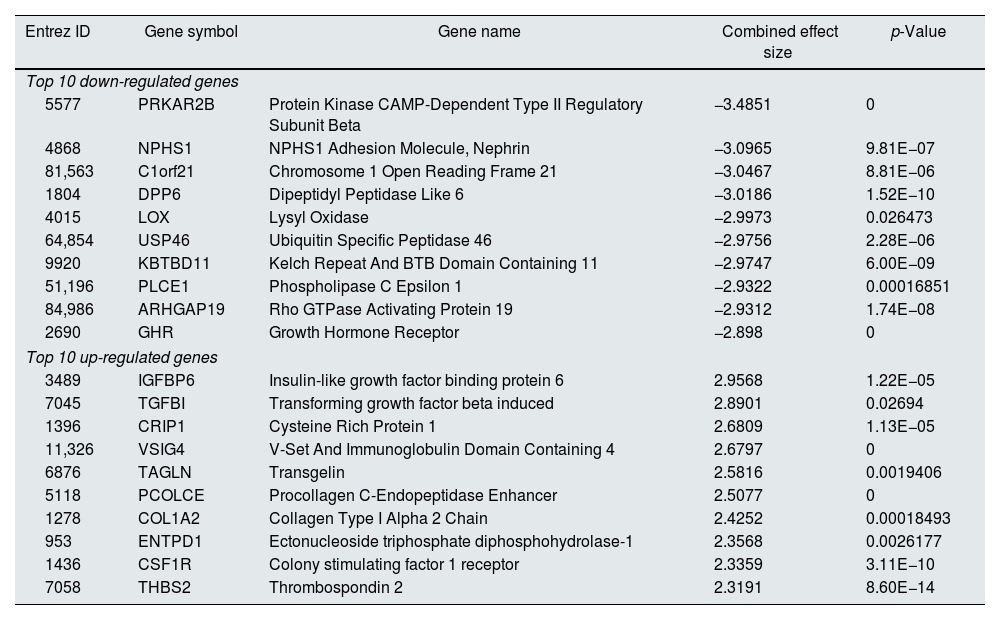
Meta-analysis (random effect size) was successfully performed on the pre-processed matrix files of the expression profiles. The selection of the random effect size as the meta-analysis method was based on the literature review and the result of Cochran's Q-test.16,22 By applying the adjusted p-value of 0.05, 1364 genes including 665 downregulated and 669 upregulated ones were identified as meta-DEGs. The complete list of the identified DEGs is available in supplementary file 1 (S1). Heatmap of top 50 meta-DEGs based on adjusted p-value and list of top 20 meta-DEGs based on their effect sizes (fold changes) are demonstrated in Fig. 3E and Table 2.
Top 20 meta-DEGs based on their effect sizes.
| Entrez ID | Gene symbol | Gene name | Combined effect size | p-Value |
|---|---|---|---|---|
| Top 10 down-regulated genes | ||||
| 5577 | PRKAR2B | Protein Kinase CAMP-Dependent Type II Regulatory Subunit Beta | −3.4851 | 0 |
| 4868 | NPHS1 | NPHS1 Adhesion Molecule, Nephrin | −3.0965 | 9.81E−07 |
| 81,563 | C1orf21 | Chromosome 1 Open Reading Frame 21 | −3.0467 | 8.81E−06 |
| 1804 | DPP6 | Dipeptidyl Peptidase Like 6 | −3.0186 | 1.52E−10 |
| 4015 | LOX | Lysyl Oxidase | −2.9973 | 0.026473 |
| 64,854 | USP46 | Ubiquitin Specific Peptidase 46 | −2.9756 | 2.28E−06 |
| 9920 | KBTBD11 | Kelch Repeat And BTB Domain Containing 11 | −2.9747 | 6.00E−09 |
| 51,196 | PLCE1 | Phospholipase C Epsilon 1 | −2.9322 | 0.00016851 |
| 84,986 | ARHGAP19 | Rho GTPase Activating Protein 19 | −2.9312 | 1.74E−08 |
| 2690 | GHR | Growth Hormone Receptor | −2.898 | 0 |
| Top 10 up-regulated genes | ||||
| 3489 | IGFBP6 | Insulin-like growth factor binding protein 6 | 2.9568 | 1.22E−05 |
| 7045 | TGFBI | Transforming growth factor beta induced | 2.8901 | 0.02694 |
| 1396 | CRIP1 | Cysteine Rich Protein 1 | 2.6809 | 1.13E−05 |
| 11,326 | VSIG4 | V-Set And Immunoglobulin Domain Containing 4 | 2.6797 | 0 |
| 6876 | TAGLN | Transgelin | 2.5816 | 0.0019406 |
| 5118 | PCOLCE | Procollagen C-Endopeptidase Enhancer | 2.5077 | 0 |
| 1278 | COL1A2 | Collagen Type I Alpha 2 Chain | 2.4252 | 0.00018493 |
| 953 | ENTPD1 | Ectonucleoside triphosphate diphosphohydrolase-1 | 2.3568 | 0.0026177 |
| 1436 | CSF1R | Colony stimulating factor 1 receptor | 2.3359 | 3.11E−10 |
| 7058 | THBS2 | Thrombospondin 2 | 2.3191 | 8.60E−14 |
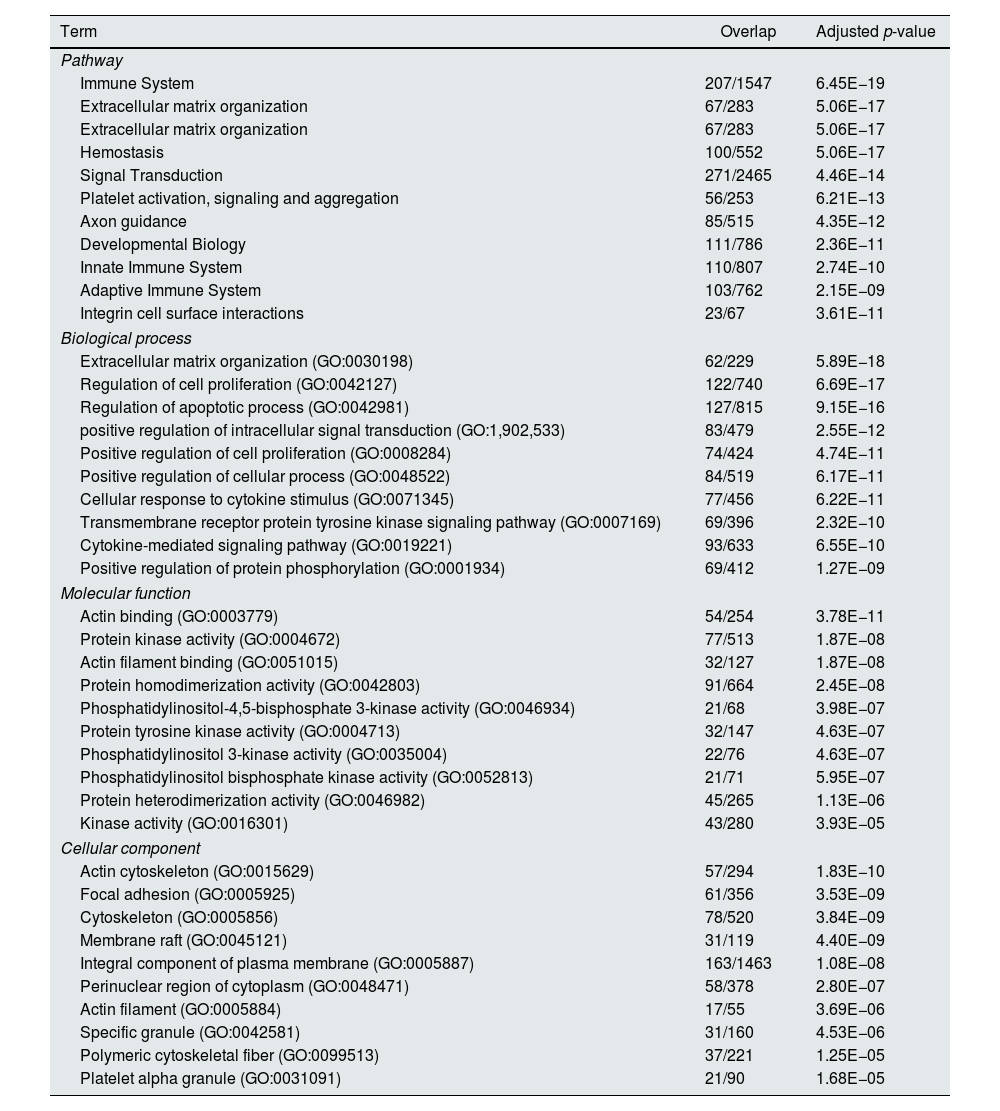
Functional enrichment analysis of the meta-DEGs was performed (Table 3) and the enrichment map representation of the GO enrichment results was constructed (Fig. 4). According to the Reactome pathway analysis, the meta-DEGs were mostly enriched in signal transduction, immune system, metabolism and extracellular matrix organization. Biological process GO terms also confirmed the Reactome analysis results, where the primarily enriched terms were mainly related to signal transduction, extracellular matrix organization and regulation of cell proliferation and death. Actin binding and protein kinase activity were two main molecular function enriched terms for the meta-DEGs. Moreover, according to the cellular component GO enrichment, the places of meta-DEGs activities are mainly cytoskeleton and the perinuclear region of the cytoplasm.
Top 10 enriched pathways and GO terms based on adjusted p-value.
| Term | Overlap | Adjusted p-value |
|---|---|---|
| Pathway | ||
| Immune System | 207/1547 | 6.45E−19 |
| Extracellular matrix organization | 67/283 | 5.06E−17 |
| Extracellular matrix organization | 67/283 | 5.06E−17 |
| Hemostasis | 100/552 | 5.06E−17 |
| Signal Transduction | 271/2465 | 4.46E−14 |
| Platelet activation, signaling and aggregation | 56/253 | 6.21E−13 |
| Axon guidance | 85/515 | 4.35E−12 |
| Developmental Biology | 111/786 | 2.36E−11 |
| Innate Immune System | 110/807 | 2.74E−10 |
| Adaptive Immune System | 103/762 | 2.15E−09 |
| Integrin cell surface interactions | 23/67 | 3.61E−11 |
| Biological process | ||
| Extracellular matrix organization (GO:0030198) | 62/229 | 5.89E−18 |
| Regulation of cell proliferation (GO:0042127) | 122/740 | 6.69E−17 |
| Regulation of apoptotic process (GO:0042981) | 127/815 | 9.15E−16 |
| positive regulation of intracellular signal transduction (GO:1,902,533) | 83/479 | 2.55E−12 |
| Positive regulation of cell proliferation (GO:0008284) | 74/424 | 4.74E−11 |
| Positive regulation of cellular process (GO:0048522) | 84/519 | 6.17E−11 |
| Cellular response to cytokine stimulus (GO:0071345) | 77/456 | 6.22E−11 |
| Transmembrane receptor protein tyrosine kinase signaling pathway (GO:0007169) | 69/396 | 2.32E−10 |
| Cytokine-mediated signaling pathway (GO:0019221) | 93/633 | 6.55E−10 |
| Positive regulation of protein phosphorylation (GO:0001934) | 69/412 | 1.27E−09 |
| Molecular function | ||
| Actin binding (GO:0003779) | 54/254 | 3.78E−11 |
| Protein kinase activity (GO:0004672) | 77/513 | 1.87E−08 |
| Actin filament binding (GO:0051015) | 32/127 | 1.87E−08 |
| Protein homodimerization activity (GO:0042803) | 91/664 | 2.45E−08 |
| Phosphatidylinositol-4,5-bisphosphate 3-kinase activity (GO:0046934) | 21/68 | 3.98E−07 |
| Protein tyrosine kinase activity (GO:0004713) | 32/147 | 4.63E−07 |
| Phosphatidylinositol 3-kinase activity (GO:0035004) | 22/76 | 4.63E−07 |
| Phosphatidylinositol bisphosphate kinase activity (GO:0052813) | 21/71 | 5.95E−07 |
| Protein heterodimerization activity (GO:0046982) | 45/265 | 1.13E−06 |
| Kinase activity (GO:0016301) | 43/280 | 3.93E−05 |
| Cellular component | ||
| Actin cytoskeleton (GO:0015629) | 57/294 | 1.83E−10 |
| Focal adhesion (GO:0005925) | 61/356 | 3.53E−09 |
| Cytoskeleton (GO:0005856) | 78/520 | 3.84E−09 |
| Membrane raft (GO:0045121) | 31/119 | 4.40E−09 |
| Integral component of plasma membrane (GO:0005887) | 163/1463 | 1.08E−08 |
| Perinuclear region of cytoplasm (GO:0048471) | 58/378 | 2.80E−07 |
| Actin filament (GO:0005884) | 17/55 | 3.69E−06 |
| Specific granule (GO:0042581) | 31/160 | 4.53E−06 |
| Polymeric cytoskeletal fiber (GO:0099513) | 37/221 | 1.25E−05 |
| Platelet alpha granule (GO:0031091) | 21/90 | 1.68E−05 |

It is clear that the clinical presentation of diseases is the result of numerous interactions between molecules in a complicated network. For a more comprehensive understanding of the underlying interactions and co-regulatory systems leading to diabetic glomerular injury and disease progression, a regulatory network consisting of interactions among meta-DEGs and their related TFs and miRNAs was constructed (Fig. S1). The constructed network is accessible at the network data exchange (NDEx) server via the web address: [https://public.ndexbio.org/#/network/009a65d0-0e4a-11ec-b666-0ac135e8bacf?accesskey=0661be1f62b70547e39bbc9615f0691e33cce1be3c7c165b14d8cdcf975b42ef].
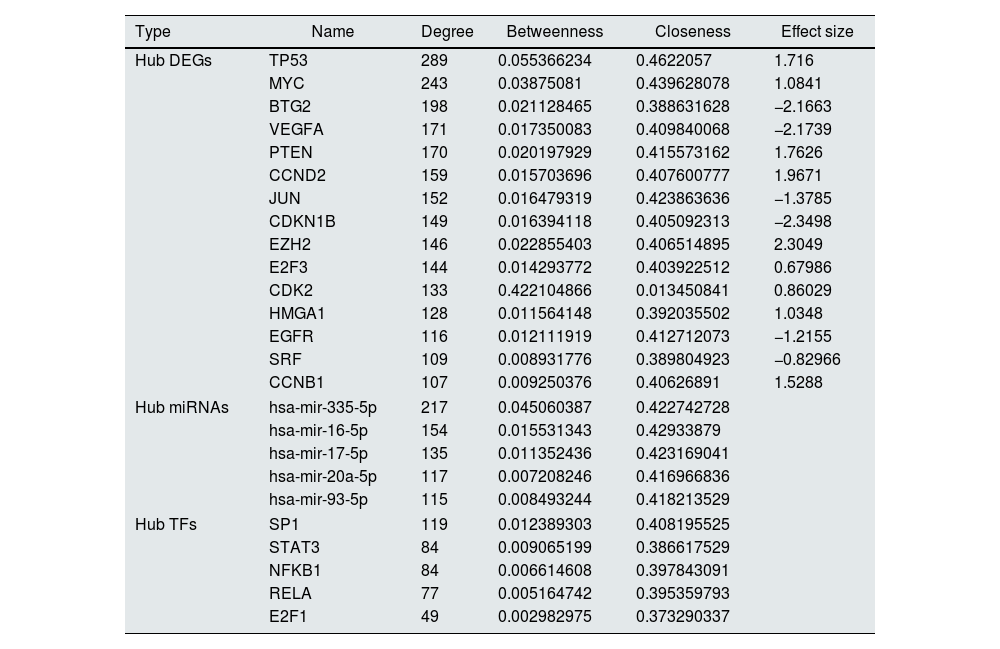
The constructed network consists of 3069 nodes and 30,759 edges incorporating 1282 DEGs, 1625 miRNAs, and 162 TFs with minimum and maximum degrees of 1 and 289. Hub DEGs were mined based on three degree, Betweenness, and closeness scores and top DEGs were identified as potentially key players in the pathogenesis of DN (Fig. 5A and B, Table 4). The top 5 TFs and miRNA molecules with the highest degree centrality scores are also listed and described in Table 4 and supplementary file S2. The 15 hub DEGs and their related miRNAs and TFs in the constructed regulatory network are shown in Figures 4C and 4D. In the case of miRNAs, hsa-mir-335-5p, hsa-mir-16-5p, hsa-mir-17-5p, hsa-mir-20a-5p, and hsa-mir-93-5p were recognized as top miRNAs targeting the majority of meta-DEGs in the constructed regulatory network. SP1, STAT3, NFKB1, RELA and E2F1 were the top 5 TFs in the constructed network.
. Top 30 DEGs based on degree, closeness and betweenness centralities and Venn diagram showing the common DEGs among these three groups. (B). PPI network among all the 15 identified hub genes. (C). TFs targeting the hub-genes. The highlighted nodes are hub TFs targeting hub DEGs in the constructed regulatory network. (D). miRNAs targeting the hub-genes. The highlighted nodes are top miRNA molecules targeting the hub DEGs in the constructed regulatory network.")
Regulatory network analysis and hub molecule identification. (A). Top 30 DEGs based on degree, closeness and betweenness centralities and Venn diagram showing the common DEGs among these three groups. (B). PPI network among all the 15 identified hub genes. (C). TFs targeting the hub-genes. The highlighted nodes are hub TFs targeting hub DEGs in the constructed regulatory network. (D). miRNAs targeting the hub-genes. The highlighted nodes are top miRNA molecules targeting the hub DEGs in the constructed regulatory network.
List of Hub DEGs, hub miRNAs and hub TFs in the constructed regulatory network. (Hub DEGs were extracted from the network based on all three centrality measures. Top miRNAs and TFs were identified based on degree centrality).
| Type | Name | Degree | Betweenness | Closeness | Effect size |
|---|---|---|---|---|---|
| Hub DEGs | TP53 | 289 | 0.055366234 | 0.4622057 | 1.716 |
| MYC | 243 | 0.03875081 | 0.439628078 | 1.0841 | |
| BTG2 | 198 | 0.021128465 | 0.388631628 | −2.1663 | |
| VEGFA | 171 | 0.017350083 | 0.409840068 | −2.1739 | |
| PTEN | 170 | 0.020197929 | 0.415573162 | 1.7626 | |
| CCND2 | 159 | 0.015703696 | 0.407600777 | 1.9671 | |
| JUN | 152 | 0.016479319 | 0.423863636 | −1.3785 | |
| CDKN1B | 149 | 0.016394118 | 0.405092313 | −2.3498 | |
| EZH2 | 146 | 0.022855403 | 0.406514895 | 2.3049 | |
| E2F3 | 144 | 0.014293772 | 0.403922512 | 0.67986 | |
| CDK2 | 133 | 0.422104866 | 0.013450841 | 0.86029 | |
| HMGA1 | 128 | 0.011564148 | 0.392035502 | 1.0348 | |
| EGFR | 116 | 0.012111919 | 0.412712073 | −1.2155 | |
| SRF | 109 | 0.008931776 | 0.389804923 | −0.82966 | |
| CCNB1 | 107 | 0.009250376 | 0.40626891 | 1.5288 | |
| Hub miRNAs | hsa-mir-335-5p | 217 | 0.045060387 | 0.422742728 | |
| hsa-mir-16-5p | 154 | 0.015531343 | 0.42933879 | ||
| hsa-mir-17-5p | 135 | 0.011352436 | 0.423169041 | ||
| hsa-mir-20a-5p | 117 | 0.007208246 | 0.416966836 | ||
| hsa-mir-93-5p | 115 | 0.008493244 | 0.418213529 | ||
| Hub TFs | SP1 | 119 | 0.012389303 | 0.408195525 | |
| STAT3 | 84 | 0.009065199 | 0.386617529 | ||
| NFKB1 | 84 | 0.006614608 | 0.397843091 | ||
| RELA | 77 | 0.005164742 | 0.395359793 | ||
| E2F1 | 49 | 0.002982975 | 0.373290337 | ||
Despite extensive research dedicated to understanding the molecular mechanisms of DN, its pathogenicity is yet to be completely understood. This lack of knowledge might be due to the heterogeneous nature of the disease or the methodological insufficiencies of previous studies. Systems biology offers valuable approaches not only to decipher the underlying molecular mechanism of diseases but also to discover novel therapeutic targets for their possible control and prevention.
Meta-analysis of transcriptomics datasets is one of the efficient methods, which can provide more consensus results about heterogeneous diseases like DN. By integrating expression data acquired from independent studies, Meta-analysis can enhance the statistical power and robustness of a study. Consistency in the results of meta-analysis studies has made them suitable choices for predicting more reliable drug targets, and uncover more specific disease-related pathways.
So far, there have been several studies integrating DN transcriptomics datasets. However, to the best of our knowledge, there is no meta-analysis study conducted on human DN transcriptomics datasets. In one recent experiment, after an independent analysis of six DN-related datasets, regardless of the tissue type common DEGs were selected for the construction and analysis of a co-regulatory network.23 Integrating different sample types (blood and tissue biopsies) in this study might cause more heterogeneity and affect the overall result. In addition, the quality control and comparability of the analyzed datasets were not assessed in this study.
One of the forms of DKD is DN that is primarily initiated as a glomerular disease, therefore in order to understand the earliest transitions occurring, the tubular gene-expression profiles were excluded to create more homogenous data.24 Bearing in mind the differences in gene expression between tubular and glomerular tissues, to decrease potential heterogeneities, only microarray datasets containing glomerular expression profiles were selected.25
PCA is a valuable tool utilized to assess the quality of gene expression profiles. It is sensitive toward batch effects, poor-preprocessing analysis, and differences between conditions.26 We applied PCA to check the quality of each dataset and detect possible outliers. After normalization and batch effects removal steps, meta-DEGs were obtained by random effect size model.
Further on, we included other regulatory elements (miRNAs and TFs) and constructed an interactive regulatory network to emphasize their roles as upstream regulatory elements and insert more weight into the constructed network.27–29 TFs and miRNAs have long been recognized as two types of regulatory elements having a pivotal role in activating or suppressing gene expression. It has been shown that the interplay between these molecules regulates intra-module and inter-module pathways, and distinct niches in gene regulatory networks.30 The regulatory network was constructed by inserting these two groups as the main upstream regulators of gene expression. Several TF and miRNA molecules were recognized as the top upstream regulators based on their degree scores in the network (Table 4). SP1, STAT3, NFKB1, RELA, and E2F1 were the top 5 TFs with a potential role in the pathogenesis of DN. In case of miRNA molecules, hsa-mir-16-5p, hsa-mir-335-5p, hsa-mir-17-5p, hsa-mir-20a-5p, and hsa-mir-93-5p were the top miRNAs regulating meta-DEGs. Supplementary file 2 (S2) listed some investigations about the potential role of these regulatory hubs in kidney-related diseases.
Our enrichment analysis showed three of the top enriched pathways to be associated with the immune system (innate immune, adaptive immune, and immune system). Although metabolic and hemodynamic factors are traditionally thought of as the root of DN, different evidence have introduced immune mechanisms and inflammasomes as major pathogenic factors.31,32 Scores of the therapeutic approaches have been developed or repurposed to target the immune system molecules and inhibit the inflammation in DN disease.33 For instance, Baricitinib a selective inhibitor of JAK-1 and JAK-2, was shown to reduce albuminuria (up to 30%) and some inflammatory markers in DN patients.34 Back to the results of the present experiment, JUN, CDKN1B, VEGFA, PTEN, EGFR, MYC and TP53 were among the identified hub genes with regulatory roles in the immune pathway that could be considered for more investigations as therapeutic targets in DN.
The association of several of our top genes and DN have previously been studied, but as far as we know, there were no investigations on the possible linkage between other identified hubs and DN pathogenicity. For example, HMGA1 is known as a pro-oncogenic gene producing an architectural transcription factor that regulates genes in different cancer types.35 Its role in insulin resistance is under research, but HMGA1's role in kidney injury has yet to be studied.36CCND2, BTG2, E2F3, CDK2,SRF, and CCNB1 were other relatively novel hub genes that have not thoroughly been explored as potential effectors in DN. Therefore, detailed investigations are recommended.
In conclusion, the result of this meta-analysis experiment was a consensus list of differentially expressed genes in the pathogenesis of DN. Further on, we recognized the highly related regulatory elements including miRNAs and TFs, and eventually presented a more robust interactive network including all these elements. Altogether, the obtained list of molecules could be the focus of more investigations in order to understand the underlying aspects of the DN pathogenesis. Moreover, the recognized hub molecules either meta-DEGs or other regulatory elements including miRNAs and TFs in the DN-related network is valuable for further studies, especially in creating new treatments in the clinical context.
Authors’ contributionsAmir Roointan and Fatemeh Hojjati participated in the design, screening, selection, meta-analysis, interpretation of data, and drafting of the manuscript. Alieh gholaminejad and Yasin Eshraghi were contributed to the meta-analysis, and interpretation of data. Yousof Gheisari contributed to the interpretation of the analyzed data and preparing the manuscript draft. All authors reviewed the manuscript.
Ethics approval and consent to participateNot applicable.
Consent for publicationNot applicable.
Availability of data and materialsThe analyzed datasets by the present study are available in the GEO repository [https://www.ncbi.nlm.nih.gov/geo/query/acc.cgi?acc=GSE104948], [https://www.ncbi.nlm.nih.gov/geo/query/acc.cgi?acc=gse1009], [https://www.ncbi.nlm.nih.gov/geo/query/acc.cgi?acc=gse47183], [https://www.ncbi.nlm.nih.gov/geo/query/acc.cgi?acc=gse96804], [https://www.ncbi.nlm.nih.gov/geo/query/acc.cgi?acc=gse30528].
FundingThis work was supported by the Isfahan University of Medical Sciences [grant number 340027].
Conflict of interestsThe authors declare that they have no competing interests.
We thank members of the Regenerative Medicine Research Center for their help in some parts of the bioinformatic analysis steps.
The following are the supplementary data to this article:


