


As in the general population, in patients on haemodialysis (HD) hyponatraemia is associated with higher mortality risk. The objective of this article was to study the relationship between predialysis serum sodium (sNa) and mortality in an HD population. We also intended to define hyponatraemia and determine the characteristics of hyponatraemic patients in terms of anthropometric data, analytical features, dialysis measurements and hydration (bioimpedance).
MethodsObservational, descriptive study of a cohort of HD incident patients. The independent variable was the mean of each patient's sNa analysed during their first 6 months on HD.
ResultsA total of 4153 patients were included in the study. Mean age was 64.7 years; 65.2% of the patients were male and 35% were diabetics. Mean follow-up time was 21.48 (SD) (1.31) months. sNa had a normal distribution, with a mean (SD)=138.46 (2.7)mEq/l. Body weight, diabetes mellitus, systolic blood pressure, interdialytic weight gain, total ultrafiltration, serum glucose, albumin and creatinine, vascular access and haemodialysis type, acquire significant differences between sodium quartiles. Lean tissue index (LTI) in patients with low serum sodium, Q1 (135mEq/l), was significantly lower than the LTI of patients from the other serum sodium quartiles. Patients with sNa<136mEq/l had a higher independent mortality risk (OR=1.62) (Cox regression analysis).
ConclusionsHD patients with hyponatraemia patients have a poor prognosis and present malnutrition or fluid overload.
Al igual que en la población general, en los pacientes en hemodiálisis (HD), la hiponatremia también se asocia a mayor riesgo de muerte. El objetivo de este trabajo es estudiar en la población en HD la relación entre natremia y mortalidad. Definir hiponatremia en HD y determinar qué peculiaridades tienen los pacientes hiponatrémicos en relación con aspectos antropométricos, analíticos, dialíticos y de hidratación, mediante bioimpedancia.
MetodosEstudio observacional, descriptivo, de una cohorte de pacientes incidentes en HD. La variable independiente fue la media de las natremias medidas en los 6 primeros meses en HD.
ResultadosSe incluyó a 4.153 pacientes. La edad media era de 64,7 años y predominaban los hombres con un 64,2%. Un 34,8% eran diabéticos. El tiempo medio de seguimiento fue 21,48 (DE) (1,31) meses. Las natremias tenían una distribución normal, con una media (DE) de 138,46 (2,7)mEq/l. Las variables que presentan diferencias significativas en función de los cuartiles de natremia son: peso, diabetes, presión arterial sistólica, ganancia de peso interdialítica, ultrafiltración total, glucemia, albúmina y creatinina séricas y tipo de acceso vascular y de HD.
El índice de masa magra (LTI) en los pacientes con hiponatremia, Q1 (135mEq/l), fue significativamente más bajo que el del resto de pacientes. Los pacientes con una natremia menor de 136mEq/l tienen un riesgo independiente de mortalidad mayor que el resto (OR=1,62) (análisis de regresión de Cox).
ConclusionesLos pacientes en HD con hiponatremia tienen mal pronóstico y presentan desnutrición o sobrecarga de volumen.
Hyponatraemia, a blood sodium (Na) level under 135mmol/l, is a common electrolyte disorder that is associated with high mortality in the general population.1–3 This poor prognosis associated with hyponatraemia is more pronounced in certain populations: women, post-operative patients, cirrhotic patients and patients with heart failure.4–6 The poor prognosis is maintained even in individuals with moderate hyponatraemia, 130–134mEql/l.2
Some patients with chronic kidney disease stage 5D (CKD5D), on a haemodialysis (HD), have hyponatraemia. The role of the kidneys in preventing hyponatraemia, tends to disappear when residual renal function (RRF) is lost such as in patients with CKD5D. In these patients, the sodium and water balance that occurs during dialysis sessions appears as a new factor in the development and maintenance of hyponatraemia.
Hyponatraemia in HD patients, as in the general population, has been associated with a greater risk of death.7–12 Those studies have found that low pre-haemodialysis blood sodium levels are associated with diabetes, neurological and psychiatric diseases, greater interdialytic weight gain (IDWG), and greater ultrafiltration (UF). The correlation between blood sodium levels and mortality has been maintained, taking into account the evolution blood sodium levels over the time.7
In HD patients, it is not clear whether the relationship between hyponatraemia and mortality is a cause-and-effect relationship or may be explained by some associated factor. The correlation between blood sodium levels and decline in brain function has been clearly demonstrated.6,13 Indeed, hyponatraemia may have a direct brain toxic effect and it causes encephalopathy. There are situations in which the association between hyponatraemia and mortality is even more pronounced; such situations include cirrhosis and heart failure, which also are common in HD patients.14 Nevertheless, there is no reason to believe that hyponatraemia in HD should be equivalent l to hyponatraemia observed in the general population.
The aim of the present study is to evaluate the relationship between serum sodium concentration and mortality in the Spanish HD population. It also sought to define hyponatraemia in HD and to determine the characteristics of hyponatraemic patients in terms of anthropometric, laboratory, dialysis and body-composition measurement using bioimpedance.
MethodsThus is an observational, descriptive study on a cohort of incident HD patients from the Fresenius Medical Care clinics in Spain (FME). The study was conducted from 2009 to 2012. The following epidemiological data were evaluated: demographic characteristics, medical history with comorbidities, dialysis and vascular-access characteristics, laboratory data, and the clinical course during follow-up (see list of variables of interest). The independent variable was the mean value of the pre-dialysis blood sodium concentration analysed within the first 6 months of HD.
Population studiedThe population included all incident HD patients in FME clinics between January 2009 and September 2012 and with at least 6 months on HD. All incident patients from January 2009 to September 2012 registered in the Fresenius Medical Care European Clinical Data Base (EuCliD) database were included. The first date of admission recorded was 2/1/2009, and the last was 1/9/2012. All causes of loss to follow-up were recorded. These included: functioning kidney transplant, change to peritoneal dialysis, transferred to another centre, death (including patients who died in the dialysis centre, during hospitalisations or within the 3 months after being transferred), among other causes. The patients enrolled in the study were from 63 FME HD centres throughout Spain.
Inclusion and exclusion criteriaThe inclusion criteria were: incident HD patients at FME clinics; more than 18 years old; registered in EuCliD® (with informed consent signed); follow-up greater than 6 months in HD; with determination of a baseline blood sodium concentration and an average blood sodium concentration from the first 6 months on haemodialysis.
Not having signed the informed consent form in EuCliD® was considered to be only exclusion criteria.
EuCliD® databaseThe database was prepared from the data of patients included in EuCliD®. EuCliD® is an tool developed to monitor the treatment of patients from Fresenius clinics in Europe, the Middle East, Africa and Latin America.15,16 Dialysis (both HD and peritoneal dialysis). Information on dialysis treatment (both HD and peritoneal dialysis), medications received during the sessions and at home, events, and comorbidities were recorded prospectively.
This database has been used in other epidemiological studies.17,18 An informed consent form for the use of the data in accordance with Data Protection Agency standards was required from all the patients included in the EuCliD® registry. Its use was described in a previous study.17
EuCliD® variables used in this studyAge at the initiation of HD, gender, time in HD, aetiology of CKD, prior history of diabetes and heart failure, dry weight (6-month average), height, type of HD (HD/HDF), type of vascular access (VA) (arteriovenous fistula or catheter), pre-HD systolic blood pressure (SBP) (6-month average), pre-HD diastolic blood pressure (DBP) (6-month average), pre-dialysis laboratory determinations (Na, K, Cl and bicarbonate, all in mEq/l; and blood glucose, albumin, creatinine, urea, in mg/dl), dialysis data (UF; interdialytic weight gain (IDWG); sodium and bicarbonate levels in the dialysis fluid [DF]) and eKt/V (6-month average). Serum sodium concentration were determined by means of indirect potentiometry.
Multi-frequency bioimpedance measurements (BCM®, Fresenius) were performed according to standard protocol. Pre-dialysis weight, overhydration (OH), extracellular volume (ECV) and intracellular volume (ICV) were collected. Relative overhydration (OH/ECV×100) (%), ECV/ICV, percentage of ECV (ECV×100/pre-dialysis weight) and ICV percentage (ICV×100/pre-dialysis weight) were calculated. The results of Bioimpedance analysed corresponded to the dates the laboratory tests.
HyponatraemiaHyponatraemia is considered to be a mean blood sodium concentration equal to or less than a mean of 136mEq/l during the 6 months on HD. This value corresponds to the upper limit of the lower quartile of sodium concentration in he present study. As is observed in the results, in this lower quartile there is a marked increase in mortality. It also corresponds to the cut-off point adopted in other similar studies.7–12
Clinical courseFollow-up time was considered to be the time elapsed from the start of follow-up, enrolment in dialysis, up to the date of exclusion. Each patient's exclusion date was recorded as death, transplant, transferred to another centre, discontinuation of treatment, loss of follow-up, or end of the study.
Death included patients who died under the care of the dialysis centre, during hospital admissions and patients who were transferred and died within the following 3 months.
The causes of death were classified as: cardiovascular (CV) death, sudden death or death at home, infections, malignancies and others.
StatisticsQualitative variables are presented as percentages, and quantitative variables are shown as means (±standard deviations). Serum sodium concentration were normally distributed in each centre. The chi-squared test was used to compare qualitative variables, and Student's t-test or ANOVA was used to compare continuous variables. Bivariate correlations between serum sodium concentration and other chemistry variables were analysed by Pearson's correlation coefficient. Actuarial (Kaplan–Meier) survival curves and the log-rank test were evaluated.
Unadjusted hazard ratios (HRs) were assessed using unadjusted hazard ratio models. Adjusted HRs were estimated by the addition of covariates (Table 4). HRs were calculated using Cox regression individually for each variable (univariate) and adjusted to all other variables and stratified to non-diabetic patients (multivariate). A multivariate Cox regression analysis was performed to identify predictors of mortality, including hyponatraemia as a potential risk factor and stratifying for the non-diabetic population. 95% confidence intervals were calculated. A p-value <0.05 was considered to be statistically significant. Statistical analysis was performed using SPSS version 19 (SPSS Inc., Chicago, IL, United States) software.
ResultsPopulation characteristicsA total of 4153 incident HD patients were enrolled in the study. Table 1 describes their demographic characteristics. Their mean age was 64.7 years, and men predominated, comprising 64.2% of patients. Diabetics accounted for 34.8% of patients. Caucasian accounted for 99% of patients.
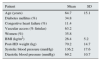
Data for patients, dialysis and laboratory tests for the 4153 incident haemodialysis patients.
| Patient | Mean | SD |
|---|---|---|
| Age (years) | 64.7 | 15.1 |
| Diabetes mellitus (%) | 34.8 | |
| Congestive heart failure (%) | 11.4 | |
| Vascular access (% fistulas) | 63.2 | |
| Women (%) | 35.8 | |
| BMI (kg/m2) | 26.4 | 5.2 |
| Post-HD weight (kg) | 70.2 | 14.7 |
| Systolic blood pressure (mmHg) | 136.2 | 17.6 |
| Diastolic blood pressure (mmHg) | 69.2 | 10.7 |
| Dialysis | Mean | SD |
|---|---|---|
| eKt/V | 1.4 | 0.3 |
| HDF (%) | 35.1 | |
| Sodium in dialysis fluid (mEq/l) | 139.1 | 1.2 |
| Bicarbonate in dialysis fluid (mEq/l) | 34.8 | 1.0 |
| Interdialytic weight gain (kg) | 1.8 | 1.2 |
| Total ultrafiltration (l) | 1.7 | 0.6 |
| Laboratory results | Mean | SD |
|---|---|---|
| Glucose (mg/dl) | 125.6 | 65.8 |
| Bicarbonate (mEq/l) | 22.50 | 3.1 |
| Chlorine (mEq/l) | 101.5 | 4.0 |
| Potassium (mEq/l) | 4.9 | 0.8 |
| Urea (mg/dl) | 122.4 | 35.6 |
| Creatinine (mg/dl) | 7.2 | 2.4 |
| Total calcium (mg/dl) | 8.9 | 0.6 |
| Albumin (g/dl) | 3.7 | 0.4 |
SD: standard deviation; HD: haemodialysis; HDF: haemodiafiltration (on-line HDF/total HD [%]); BMI: body mass index.
Table 1 describes the dialysis parameters studied. Individuals in on-line haemodiafiltration (OL-HDF) accounted for 35% of patients. Mean sodium used in the dialysate fluid (DF) was 139.1mEq/l, and mean bicarbonate level was 34.8mEq/l.
Laboratory monitoringThe distribution of mean serum sodium concentration for each patient is shown in Fig. 1. The distribution was normal or Gaussian, and the mean was 138.46 (2.70)mEq/l. Each patient had a mean of 3.2 blood sodium level measurements in the first 6 months. The first blood sodium level measured in HD was similar to the mean, 138.58 (4.22)mEq/l, although the dispersion of the values was greater. The quartiles of mean blood sodium for the 6 months had the following ranges: Q1: 135 (120–136), n=1030; Q2: 137 (137–138), n=1075; Q3: 139 (>138–140), n=1011; and Q4: 141 (>140–148), n=1037.

Table 1 lists all other laboratory results obtained. Pre-HD blood glucose and serum albumin and creatinine correlated with the serum sodium concentration (p<0.0001). The correlation albumin with sodium ratio disappeared in patients with less fluid overload.
Clinical courseMean follow-up time was 21.48 (1.31) months. At 1/03/2013, 2139 patients remained in the study. During the study 724 patients died. The main cause of loss to follow-up was kidney transplant, accounting for 608 patients in total; 87 patients voluntarily suspended treatment, and 595 were transferred. Mean survival time was 3.42 (0.24) years.
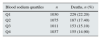
Survival and blood sodium levelsTable 2 describes the gross mortality rate separated by quartiles of serum sodium concentration. Gross mortality for patients with low sodium levels was 22.2%, versus 14.9% for patients with the highest sodium levels. Patients of the lower quartile of serum sodium concentration, Q1, had significantly greater mortality than all other patients. The Odds ratio (OR) between Q1 and Q4 was 1.62 (1.29–2.03). To assess whether the highest serum sodium concentration had a worse prognosis, the population was divided into deciles. Only the 3 lowest deciles had an OR>1.5, significant relative to the risk of death of all others deciles; the upper decile, with a mean blood sodium level of 142.8mEq/l, did not have an OR different from the deciles greater than 136mEq/l.
Mortality during follow-up, not adjusted and expressed as a percentage, for each blood sodium quartile.
| Blood sodium quartiles | n | Deaths, n (%) |
|---|---|---|
| Q1 | 1030 | 229 (22.20) |
| Q2 | 1075 | 187 (17.40) |
| Q3 | 1011 | 153 (15.10) |
| Q4 | 1037 | 155 (14.90) |
| Risk of death according to blood sodium quartile (not adjusted) | |||
|---|---|---|---|
| Sodium quartiles (blood) | OR | CI | p |
| Q1 vs Q2 | 1.35 | 1.09–1.68 | 0.003 |
| Q1 vs Q3 | 1.60 | 1.27–2.01 | 0.000 |
| Q1 vs Q4 | 1.62 | 1.29–2.03 | 0.000 |
Sodium ranges by quartile: Q1 (120–136mEq/l); Q2 (137–138mEq/l); Q3 (>138–140mEq/l); and Q4 (>140–148mEq/l).
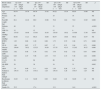
Table 3 describes the values of clinical and laboratory variables in each quartile of serum sodium concentration including the 4153 patients. The variables that showed significant differences were: post-HD weight, diabetes, systolic blood pressure (SBP), IDWG, UF, serum glucose, serum albumin, serum creatinine, Vascular Access (VA) and dialysis technique. During the first half-year of HD, the patients who died had significantly lower mean serum sodium concentration.
Clinical and laboratory variables studied according to blood sodium quartile for the 4153 incident haemodialysis patients.
| Blood sodium quartile range/mean | Q1 (120–136mEq/l) 135mEq/l n=1030 | SD | Q2 (137–138mEq/l) 137mEq/l n=1075 | SD | Q3 (>138–140mEq/l) 139mEq/l n=1011 | SD | Q4 (>140–148mEq/l) 141mEq/l n=1037 | SD | p |
|---|---|---|---|---|---|---|---|---|---|
| Age (years) | 64.74 | 14.78 | 64.70 | 15.42 | 64.22 | 15.34 | 65.03 | 14.98 | NS |
| Women (%) | 38 | 36 | 35 | 34 | NS | ||||
| Post-HD weight (kg) | 68.1 | 14.16 | 69.9 | 15.06 | 70.8 | 14.8 | 72.0 | 15.85 | 0.000 |
| Diabetes (%) | 48 | 35 | 31 | 25 | <0.001 | ||||
| CHF (%) | 12 | 12 | 12 | 9 | NS | ||||
| SBP (mmHg) | 137.63 | 18.48 | 135.91 | 18.16 | 135.93 | 16.52 | 135.68 | 17.36 | 0.045 |
| DBP (mmHg) | 68.94 | 11.21 | 69.23 | 10.69 | 69.57 | 10.64 | 69.42 | 10.57 | NS |
| IDWG (kg) | 1.93 | 0.68 | 1.80 | 0.66 | 1.73 | 0.72 | 1.68 | 0.71 | 0.000 |
| UF (l) | 1.89 | 0.67 | 1.77 | 0.67 | 1.7 | 0.71 | 1.64 | 0.71 | 0.000 |
| Glucose (mg/dl) | 150.64 | 78.52 | 125.23 | 54.59 | 117.35 | 42.15 | 112.02 | 36.27 | 0.000 |
| Albumin (g/dl) | 3.62 | 0.48 | 3.76 | 0.42 | 3.79 | 0.42 | 3.82 | 0.43 | 0.000 |
| Creatinine (mg/dl) | 6.83 | 2.47 | 7.06 | 2.35 | 7.33 | 2.33 | 7.48 | 2.42 | 0.000 |
| VA (% AVF) | 59 | 64 | 66 | 64 | <0.001 | ||||
| OL-HDF (%) | 39 | 38 | 34 | 31 | 0.002 | ||||
| eKt/V | 1.4 | 0.49 | 1.4 | 0.28 | 1.38 | 0.28 | 1.37 | 0.28 | NS |
| Sodium in dialysis fluid (mEq/l) | 139.14 | 1.24 | 139.11 | 1.24 | 139.14 | 1.28 | 139.17 | 1.25 | NS |
| Bicarbonate in dialysis fluid (mEq/l) | 34.83 | 1.11 | 34.89 | 0.92 | 34.82 | 1.01 | 34.89 | 1.2 | NS |
| Deaths (%) | 22.2 | 17.4 | 15.1 | 14.9 | <0.001 |
VA: vascular access; bicarbonate in dialysis fluid: bicarbonate concentration in dialysis fluid; SD: standard deviation; AVF: arteriovenous fistula; IDWG: interdialytic weight gain; HD: haemodialysis; OL-HDF: on-line haemodiafiltration; CHF: prior history of congestive heart failure; NS: not significant; SBP: systolic blood pressure; sodium in dialysis fluid: sodium concentration in dialysis fluid; total UF: total ultrafiltration.
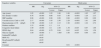
In the unadjusted survival curves, there were significant differences between the quartiles of serum sodium concentration (Fig. 2). Table 4 provides the data from the Cox regression. It describes the variables that influenced mortality in a univariate manner, with their ORs and CIs (univariate analysis), and the multivariate analysis with variables that significantly predicted mortality, including the serum sodium concentration. The variables that independent predict mortality risk were age, sex, SBP, hyponatraemia, type of VA. Heart failure, sodium and bicarbonate concentration in the dialysate and IDWG were not statistically significant independent predictors of mortality. The analysis was corrected for diabetes. There were variables, including eKt/V, prior history of heart failure and dialysis technique, which interact with each other.
 survival curves according to blood sodium quartile. The survival curves show the pattern of deaths according to the sodium quartile (Q) at 6 months after entering the FMC clinics. Mean survival time was 3.21 years (CI 3.10–3.31) for Q1, 3.42 years (CI 3.32–3.51) for Q2, 3.51 years (CI 3.42–3.60) for Q3 and 3.53 (CI 3.44–3.61) for Q4.")
(Kaplan–Meier) survival curves according to blood sodium quartile. The survival curves show the pattern of deaths according to the sodium quartile (Q) at 6 months after entering the FMC clinics. Mean survival time was 3.21 years (CI 3.10–3.31) for Q1, 3.42 years (CI 3.32–3.51) for Q2, 3.51 years (CI 3.42–3.60) for Q3 and 3.53 (CI 3.44–3.61) for Q4.
Analysis of Cox regression (mortality).
| Equation variables | Univariate | Multivariate | ||||||
|---|---|---|---|---|---|---|---|---|
| HR | Sig. | 95% CI | HR | Sig. | 95% CI | |||
| Lower | Upper | Lower | Upper | |||||
| Age (years) | 1.05 | <0.001 | 1.05 | 1.06 | 1.06 | <0.001 | 1.05 | 1.07 |
| Sex (female vs male) | 0.78 | <0.001 | 0.66 | 0.93 | 1.66 | <0.001 | 1.29 | 2.13 |
| SBP (mmHg) | 0.98 | <0.001 | 0.98 | 0.99 | 0.98 | <0.001 | 0.98 | 0.99 |
| Vascular access, Cath vs AVF | 2.17 | <0.001 | 1.85 | 2.56 | 2.29 | <0.001 | 1.81 | 2.89 |
| Hyponatraemia (<136mEq/l) | 1.749 | <0.001 | 1.43 | 2.13 | 1.98 | <0.001 | 1.44 | 2.72 |
| Diabetes mellitus | 1.53 | <0.001 | 1.3 | 1.8 | ||||
| Congestive heart failure | 1.99 | <0.001 | 1.6 | 2.48 | 1.39 | >0.05 | 0.97 | 1.99 |
| IDWG (kg) | 0.84 | <0.001 | 0.75 | 0.94 | 0.93 | >0.05 | 0.54 | 1.58 |
| Glucose (mg/dl) | 1.00 | <0.001 | 1 | 1.005 | 1.00 | >0.05 | 0.99 | 1.01 |
| Sodium/DF (mEq/l) | >0.05 | |||||||
| HDF (%) | >0.05 | |||||||
| Bicarbonate/DF (mEq/l) | >0.05 | |||||||
| eKt/V | >0.05 | |||||||
| Constant | 0.01 | <0.001 | ||||||
Cath: catheter; AVF: arteriovenous fistula; IDWG: interdialytic weight gain; HDF: on-line haemodiafiltration; DF: dialysis fluid; SBP: systolic blood pressure. HR Cox regression, individual proportionate risk for each variable (univariate) adjusted for all other variables and stratified for non-diabetic patients (multivariate).
Table 5 shows the bioimpedance data in a sample smaller than the total number of patients studied. The sample consisted of a total of 487 patients, who had undergone at least one bioimpedance analysis during the first 6 months. Relative overhydration was different between blood sodium quartiles, but differences were 1%, and there were no differences between Q1 and Q4. The LTI in patients with low blood sodium levels, Q1 (135mEq/l) was significantly lower than the LTI of patients from the other blood sodium quartiles.
Spectroscopic bioimpedance data for 487 HDs of the patients and their correlation to the blood sodium quartiles.
| n=487 patients | Q1 | Q2 | Q3 | Q4 | p (ANOVA) |
|---|---|---|---|---|---|
| Relative overhydration (%) | 11.1±8.9 | 9.8±8.7 | 10.0±8.2 | 10.8±8.7 | >0.05 |
| Lean tissue index (LTI) (kg/m2) | 11.2±2.4 | 12.1±2.7 | 12.2±2.6 | 11.7±2.7 | 0.019 |
| Fat tissue index (FTI) (kg/m2) | 13.7±6.8 | 15.0±6.4 | 13.9±6.3 | 15.0±8.4 | >0.05 |
| ECV/weight (%) | 23 | 22 | 23 | 23 | >0.05 |
| ECV/ICV | 1.02±0.14 | 1.01±0.13 | 0.99±0.15 | 1.03±0.13 | >0.05 |
Relative overhydration OH/ECV (%). ECV: extracellular volume; ICV: intracellular volume. Blood sodium quartiles: Q1 (120–136mEq/l); Q2 (137–138mEq/l); Q3 (>138–140mEq/l); and Q4 (>140–148mEq/l).
The main finding in this study is that patients with low blood sodium levels, less than 136mEq/l, have a higher risk of death than all other HD patients. This level of sodium concentration should define the hyponatraemia in HD associated to a worse prognosis. This is valid, at least, for a broad Spanish population of incident HD patients. There have been similar results in studies from other countries,7–12 with similar ranges of blood sodium concentration. In the present study, the prognostic value of hyponatraemia in HD is independent of other prognostic factors: age, gender, diabetes, SBP and VA type. As described in a previous study,17 which partially encompassed the same population studied here, this is not a population with lower comorbidity than all other Spanish dialysis patients. The factors that had an impact on mortality in this study were the same as those identified in that series,17 with the exception of hyponatraemia, which was not studied, and those from another Spanish study that also enrolled incident HD patients.19 In European and American studies, those mentioned variables also appear as predictors of mortality in HD patients.8,10–12 The relationship between blood sodium concentration and mortality in HD does not seem to conform to a J-curve, as occurs with other laboratory parameters; hypernatremia does not seem to be associated with a greater risk of death in this study or in other studies.7–12
In our study, the mean pre-HD serum sodium concentration analysed over 6 months was used as the main variable. The mean pre-HD serum sodium concentration was not different than the baseline serum sodium concentration. It was decided to obtain the mean pre-HD serum sodium concentration to avoid a potential effect of variability in the determinations of serum sodium. In the above-mentioned studies on HD in which blood sodium levels were associated to mortality,7–12 the sodium level chosen as a predictive of outcomes was the values at the time of enrolment (single value) or mean blood sodium level (3 months or one year). This decision was based in the assumption that each HD patient has a fixed serum sodium concentration or what has come to be called the plasma sodium set-point.20,21 We believe that this concept of a blood sodium set-point should be examined; it may be valid in stable HD patients, but may not be entirely true in those patients with changes in their sodium intake or in the method of dialysis.22–24 HD patients with hyponatraemia are those with the greatest variability in their blood sodium determinations.23,25 In our experience and in that of Maduell et al., changes in sodium intake may indeed affect blood sodium levels in HD patients,22 as may changes in dialysis technique.24 In the present study, to obviate this matter, it was decided to use 6-month mean serum sodium concentrations.
Our study shows that serum sodium concentration was related to age, gender, IDWG, SBP, CHF and other variables. All these variables are related with the body's distribution and content of water and sodium. The Serum sodium concentration, IDWG and SBP were interrelated. Patients with greatest IDWG and SBP tended to have lower serum sodium concentration. Hyponatraemia represents a pathophysiological crossroads. First, the hyponatraemia may be caused in part by a dilutional effect due to a large IDWG. The fact that the association between serum albumin and serum sodium concentration disappears in less overhydrated pre-HD sessions patients speaks in favour of this dilutional effect of IDWG. Hyponatraemia may be due to a relative increase in body water, which may involve: cellular hyperhydration, cerebral oedema, expansion of ECV and plasma volume, increase in blood pressure, and cardiac overload. It has been reported that overhydration above 15% of normal ECV involves a worse prognosis in HD patients.26 Different prognostic factors are SBP and IDWG.26,27 It should be noted that overhydration was not the only cause of hyponatraemia in the HD patients studied here; there were patients with hyponatraemia with high, normal or low hydration state. One study25 found a direct correlation between overhydration and blood sodium levels. Thus overhydration should be treated as a problem separated from hyponatraemia. Another possibility in the differential diagnosis of hyponatraemia is changes in body content of sodium both with and without associated osmotic changes, also related to changes in BP.
The kidneys play an important role in the onset and the maintenance hyponatraemia in non-HD patients. In HD patients without residual renal function, hyponatraemia is prevented by a reduction thirst. There are mechanisms that influence thirst independent of the sodium intake, serum sodium concentration and osmolarity. These include: angiotensin II, which increases thirst and cause polydipsia28,29; arginine vasopressin which is increased in response to a reduction of ECV; increased osmolarity caused by factors other than sodium, drugs, pain, etc.; and also local oropharyngeal factors, such as dryness of the mucosae; and psychogenic factors.29–31 All these factors could cause hyponatraemia in HD. It was not possible to assess the residual kidney function (RRF); since there were incident patients, it was assumed that some of them started with significant RRF, which may have influenced blood sodium levels. RRF in HD tends to decrease during the first few months and no changes in serum sodium concentration were in the first 6 months. The correlation between serum sodium concentration and mortality has been observed in oligo-anuric prevalent HD patients.
In addition, HD may cause changes in a patient's sodium and water ratio. Most sodium and water lost during HD is through UF. UF causes a loss of water and sodium in proportion to serum sodium concentration; the sieving coefficient for sodium is practically 1. During HD, the sodium balance by diffusion may be substantial when there is a significant gradient between concentration of sodium in blood and dialysate. Therefore, the concentration of sodium in the dialysate may play a role in this balance, in a way that is not associated with water loss. These changes resulting from the dialysate sodium concentration may influence IDWG, BP and serum sodium concentration.25 In this study, we have observed a relationship between nutritional parameters and blood sodium levels: LTI, body weight and plasma creatinine and albumin concentrations. There are probably 2 main types of hyponatraemic HD patients: patients with poor nutrition and patients with fluid overload.
Hyponatraemia in HD patients is associated to poor prognosis. Is there any action that may correct the hyponatraemia and, improve the prognosis? Action can be taken on sodium and water intake in the diet, although this is not an easy task. It is attempted when there is HTN or major interdialytic weight gain. It is not common to act at this level in situations of hyponatraemia. It is technically easier to modify the sodium balance in dialysis by modifying the total conductivity of the machine and therefore the dialysate sodium concentration. The dialysate sodium level tends to increase when HD tolerance is poor, and tends to decrease when there is HTN or major IDWG that do not respond to increased UF and reductions of dry weight. It is not usual to make changes in dialysate sodium in situations of hyponatraemia. One study mentioned that the poor prognosis associated to hyponatraemia in HD is altered by the dialysate sodium concentration. Other studies did not find this correlation.9,10 All of these were observational studies that are difficult to interpret. Changes in dialysate sodium determine IDWG, BP, tolerance to dialysis and probably blood sodium levels. Therefore, when choosing or modifying sodium in dialysate, all these features must be assessed.
Hyponatraemia is a factor of a poor prognosis in HD patients. Hyponatraemic patients have malnutrition or volume overload. The aims of suitable HD should include correcting malnutrition, volume overload and, secondarily, hyponatraemia.
Conflicts of interestThe authors declare that they have no conflicts of interest.
Group ORD: Optimizando Resultados en Diálisis. Grupo promovido por Fresenius Medical Care de España.
Please cite this article as: Pérez-García R, Palomares I, Merello JI, Ramos R, Maduell F, Molina M, et al. Hiponatremia, mortalidad y hemodiálisis: una asociación no explicada. Nefrologia. 2016;36:42–50.


AL DÍA

