
In Argentina, there have been no studies aimed at establishing the prevalence of dysglycaemia (impaired fasting glucose [IFG], impaired glucose tolerance [IGT] and diabetes mellitus [DM]) in patients with chronic kidney disease (CKD). Our group decided to conduct an observational study to evaluate the frequency with oral glucose tolerance test (OGTT) in CKD patients with no previous data for dysglycaemia in their medical records.
OGTT was performed in 254 patients (60.62% male) with stage 3, 4 and 5 CKD under conservative treatment, haemodialysis or transplantation.
Rsults for DM were found in 10 patients according to fasting glucose alone (3.94%; 95% CI: 1.35–6.53%), 11 patients with exclusively the second hour criterion (4.33%; 95% CI: 1.63–7.03%), 15 with both criteria (5.91%; 95% CI: 2.81–9.00%) and 36 patients with at least one criteria (14.17%; 95% CI: 9.69–18.66%). In a multivariate analysis, DM was associated with waist circumference (OR=1.033 per cm; 95% CI, 1.005 to 1.062; P=.019) and with conservative treatment vs. replacement therapy (OR=0.41; 95% CI: 0.19–0.92; P=.028). IGT was evident in 24.6% and 20.3 on conservative vs. replacement therapy, with no statistically significant difference. IFG (ADA criteria) was 19.75 vs. 9.24% in conservative vs. replacement therapy, with a statistically significant difference.
OGTT is suggested for all CKD patients since it is able to detect the full range of unknown dysglycaemias, which avoids underdiagnoses and favours performing treatments to prevent progression in DM risk groups (IFG and/or IGT). It also aids in the selection of the most appropriate medication for transplantation or treatment initiation in new cases of undiagnosed DM to decrease morbidity and mortality.
En Argentina no se han realizado estudios destinados a establecer la prevalencia de disglucemias (glucemia alterada en ayunas [GAA], tolerancia alterada a la glucosa [TAG] y diabetes mellitus [DM]) en pacientes con enfermedad renal. Se decidió realizar un estudio observacional, evaluando la frecuencia con prueba de tolerancia oral a glucosa (PTOG) en pacientes con enfermedad renal crónica (ERC), sin registro de disglucemia en sus historias clínicas.
Se realizó PTOG a 254 pacientes (60,62% masculinos), con ERC estadios 3, 4 y 5, en tratamiento conservador, hemodiálisis o trasplante.
Los resultados mostraron pacientes con valores de DM: 10 pacientes según ayunas exclusivamente (3,94%; IC 95%: 1,35-6,53%); exclusivamente segunda hora, 11 pacientes (4,33%; IC 95%: 1,63-7,03%); por ambos criterios, 15 pacientes (5,91%; IC 95%: 2,81-9,00%); por al menos un criterio, 36 pacientes (14,17%; IC 95%: 9,69-18,66%). En análisis multivariado, la DM se asoció con valour de cintura (OR=1,033 por cm; IC 95%: 1,005-1,062; p=0,019) y con tratamiento sustitutivo vs. conservador (OR=0,41; IC 95%: 0,19-0,92; p=0,028). La GAA (criterio ADA) fue del 19,75% en tratamiento conservador vs. 9,24% en tratamiento sustitutivo, con diferencia estadísticamente significativa. No fue significativa la diferencia de TAG que evidenció 24,6 y 20,3% en tratamiento conservador y sustitutivo, respectivamente.
Se propone la realización de PTOG en todo paciente con ERC, ya que permite la detección de todo el rango de disglucemias desconocidas, evitando el subdiagnóstico y favoreciendo la realización de tratamientos para evitar su progresión, en caso de estar ante la presencia de un grupo de riesgo para DM (GAA o TAG), así como la elección de la medicación más adecuada para el trasplante o el inicio del tratamiento de nuevos casos de DM no diagnosticada, para disminuir la morbimortalidad.
There are numerous studies in the general population1 on the prevention of the development of diabetes mellitus (DM)2 and its associated complications: renal and cardiovascular disease and premature death.3 There has been less attention in studying the metabolic abnormalities4 of chronic kidney disease (CKD) patients without DM, that may cause the development of hyperglycaemia.
In addition to the typical changes of CKD (hyperparathyroidism, activation of the renin angiotensin system, anaemia, vitamin D deficiency, inflammatory state, etc.) CKD is characterised by reduced peripheral insulin sensitivity,5 reduced insulin secretion,6 and changes in the levels of various substances such as leptin7,8 and cytokines. Such changes make these patients susceptible to developing hyperglycaemia9 and hypoglycaemia.10
Recently, an alarming increase has been seen in the incidence of post-transplant DM, or new onset diabetes mellitus after transplant (NODAT),11,12 with a prevalence of 25% in some studies.13 However, there is limited knowledge on the incidence of new cases of DM in patients with CKD awaiting transplant.14 Based on some studies, it is suspected that new cases of DM develop during haemodialysis (new onset diabetes mellitus after dialysis [NODAD]).15 This phenomenon has been confirmed by other groups who also warned about the finding,16 generating concern that these patients had been underdiagnosed in earlier stages because their glycaemic levels had improved with the onset of CKD.17
There are not protocols designed to DM detection in CKD patients and there is no validation of the criteria used in the general population for the use in CKD patients.
Conducting studies aiming to prevent new cases of DM by identifying the presence of different glycaemic changes and other risk factors in the different stages of CKD is challenging.
In Argentina, until now, there have been no studies that aimed to establish the prevalence of dysglycaemia (taken to mean impaired fasting blood glucose [IFG], impaired glucose tolerance [IGT], or DM) in patients with CKD who have no history of DM as the underlying cause or a concomitant condition in their clinical notes. Due to the lack of prospective studies analayzing the prevalence and clinical significance of dysglycemia in CKD patients we decided to conduct an observational study in CKD patients being classified according to the reccomendations of the National Kidney Foundation (NKF).3 Thus the frequency of dysglycaemia in patients with no previous medical records of DM was evaluated. We used the protocol “Alteraciones metabólicas de pacientes con enfermedad renal crónica (Metabolic Changes in Patients with Chronic Kidney Disease)” (AMPERC) of the Argentine Society of Nephrology. The aim was to evaluate CKD patients on conservative treatment, CKD patiens on haemodialysis, or with renal transplant, the oral glucose tolerance test (OGTT) as described by the WHO18 and relate the findings to risk factors. This method of evaluation was chosen because previous observations had determined that evaluation of fasting samples results in under-diagnosis of glycaemic abnormalities.19,20
Materials and methodsSample, inclusion and exclusion criteriaThe study included 254 patients (60.62% were male). The inclusion criteria were as follows: patients with age≥18 years; with a diagnosis of CKD according to the NKF3; patients on either conservative treatment, haemodialysis, or transplanted; no previously-diagnosed of blood glucose abnormalities; agreement to undergo OGTT; and with no contraindication for OGTT use; with signed informed consent form before undergoing any procedure specific to the study.
The exclusion criteria were: a previous diagnosis of DM, IGT, or IFG; on hypoglycaemics agents, insulin, corticosteroids, or anabolic steroids; severe concomitant disease (that is, life expectancy less than 2 years); acute clinical events during the 2 previous months (AMI, surgery, etc.); hypothyroidism; liver disease; pregnancy or breast-feeding; patients following another investigation protocol with a specific intervention or medication; and those that declined to undergo the glucose loading test.
Consecutive patients with CKD (defined according to NKF criteria) on conservative treatment, treated in clinic from a fixed study start date were enrolled in the study. The diagnosis of CKD had to be established more than 3 months prior to enrolment. The stages of CKD (≤60mL/min/1.73m2) were assessed using the abbreviated MDRD 4 formula.3
The study also included patients on haemodialysis or transplanted, for more than 3 months prior to starting the study and with no known history of glycaemia-related disease.
The OGTT followed the following protocol: for 3 days prior to the test, patients were instructed to follow a non restricted diet, rich in carbohydrates containing alt least 150g/day of carbohydrates. The test was carried out after 8h of fasting, and patients were instructed to refrain from tobacco for 24h prior to the test. Each patient had to remain at rest during the test. An initial blood sample was taken (fasting, time 0), then, a solution of 20% glucose was given (75g glucose dissolved in 375mL of water acidulated with the juice of ¼ lemon). The solution was ingested over a period of 5–10min. One hundred and twenty minutes after igestion of the solution a second blood sample was obtained. The diagnostic criteria for DM were the following: (a) fasting blood glucose higher than or equal to 126mg/dL, or (b) blood glucose at 120min higher than or equal to 200mg/dL. The cut-off points for the diagnosis of IFG were based on the consideration of two guidelines: (a) the ADA criteria, greater than or equal to 100mg/dL; or (b) the criteria followed by the Argentine Society of Diabetes21 and the WHO,18 greater than or equal to 110mg/dL. In both cases, the upper limit for this category was 126mg/dL; above this glucose concentration patients were classified as having DM. Patients with values between 140mg/dL and 200mg/dL at 120min were classified as having IGT.
The aetiology and duration of CKD were carefully documented, as well as the nature and starting date of the treatment (conservative or replacement: haemodialysis or renal transplant). Past medical history of systemic hypertension (according to JNC criteria), arrhythmias, heart failure, angina, or myocardial infarction, medications were recorded. Past history of left ventricular hypertrophy and cerebrovascular disease was also recorded. History of intermittent claudication, leg ulcers, peripheral neuropathy, retinopathy, cataracts, glaucoma, non-traumatic amputation, gout or hyperuricaemia, hypercholesterolaemia, hypertriglyceridaema, immune diseases (lupus, rheumatoid arthritis, Hashimoto, other) neoplastic disease, HIV-AIDS, hepatitis A, B, or C, tuberculosis, or active infectious diseases, was specifically recorded. In women, history of gestational DM was noted. The degree of physical activity, smoking habits, and alcohol consumption were documented; drug addiction was specifically investigated. As mentioned all medications being taken at the time of entry to the study were also recorded. Family history of renal disease, systemic hypertension, DM, obesity, cardiovascular events in men <55 years and women <65 years was noted.
On the day of study entry, the following clinical and paraclinical data were collected: height in cm, weight, estimated “dry” weight in kg, waist and hip measurements in cm, blood pressure (mmHg), previous fasting blood glucose level, and HbA1c if previously measured.
In addition, the values of haemoglobin level, leucocyte count, serum creatinine, serum urea, total cholesterol, HDL and LDL cholesterol, serum triglycerides, and intact parathyroid hormone (iPTH) level were also requested.
For the determination of body mass index, a calibrated scale or electronic balance with an integrated or wall altimeter was used. A wall altimeter consists of a rigid vertical surface with an attached scale in centimetres and a horizontal mobile surface at right angles, which slides freely vertically. The inferior surface lies on the floor or on any supporting surface on top of the floor, lying at the 0 of the measuring scale. The subject must be able to stand, with their back to the vertical surface so that their heels, buttocks and head are in contact with it. The heels must be kept together and the shoulders relaxed, to minimise misalignment of the spine. The head must be kept such that the inferior border of the orbit is in the same horizontal plane as the external auditory meatus (Frankfurt plane); the hands must be free and relaxed. Each patient was asked to take a deep breath, which relaxes the shoulders, and to stretch upwards to make themselves as tall as possible. Stretching minimises the variation in height that occurs throughout the day, which can be up to 2cm. The horizontal surface was then slid downwards, in contact with the vertical plane, until it touched the subject's head. The reading was then taken from the scale (in centimetres).
For the determination of the waist circumference, or perimeter, a calibrated flexible steel tape measure was used, in cm with increments in mm, with a blank space of at least 3cm before the line that records zero. The patient had to remain standing. The measurement was made in a horizontal plane, at a distance midway between the inferior border of the last rib and the iliac crest. Each of these points had to be palpated and marked and the midway point marked with a tape measure. When the legs were together with the buttocks relaxed, the measurer placed themselves in front of the patient and measured at the height of the trochanter in line with the pubic symphysis (this comprised the hip measurement in centimetres).
For blood pressure measurement, all the instruments were validated and duly calibrated. All the instruments used in the study were controlled against an instrument whose accuracy and precision had been previously assessed. The person responsible for the measurement of blood pressure was trained in the standard technique, and patients had to be adequately prepared and positioned. Patients had to remain seated and at rest for at least 5min with their feet on the floor, their back leaning against the chair back, with the arm at the level of the heart. The recording was made at least 30min after any caffeine ingestion, exercise, or tobacco use. The auscultatory method was used with aneroid and mercurial sphygmomanometers. To ensure accuracy, a cuff of appropriate size had to be used, covering at least 50% of the circumference of the arm, and 80% of its length. The midline of the inflatable cuff was positioned over the brachial artery. At least 2 measurements were taken to calculate the mean recording. For manual measurements, the systolic blood pressure was estimated by obliterating the radial pulse; in a second step, the cuff was inflated 20 or 30mmHg above the level determined by auscultation.
The speed of cuff deflation for the auscultatory measurement was 2mmHg/s. The systolic pressure was established based on the first of 2 or more clear Korotkoff sounds (start of phase 1); diastolic pressure was defined by the disappearance of the Korotkoff sounds (start of phase 5). In cases of arterial stiffness causing blowing sounds until a value close to 0, the value corresponding to the muffling of the sounds was recorded. For patients with vascular access, blood pressure was determined in the contralateral arm.
Statistical analysisThe quantitative variables, except for clearance, are described as mean±standard deviation. The nature and distribution of the qualitative variables were analysed using the Shapiro–Wilk test. A Chi-square test was used to compare ratios; the comparison between 2 groups of quantitative data with normal distribution was done using the Student t test for independent samples. The differences between 3 groups of data with normal distribution were determined using one-way ANOVA (Scheffe post hoc test). In cases of abnormal distribution, the Kruskal–Wallis test was used. To evaluate the multivariate association between the presence of DM and different independent covariates, multiple logistic regression was used (quasi-Newton method for maximum likelihood). A P-value <.05 was considered statistically significant.
ResultsThe study included 100 women and 154 men, with a mean age of 59.86±17.23 years. The conservative treatment group had 81 patients (46 men), the haemodialysis group had 140 (87 men), and the transplant group had 33 (21 men).
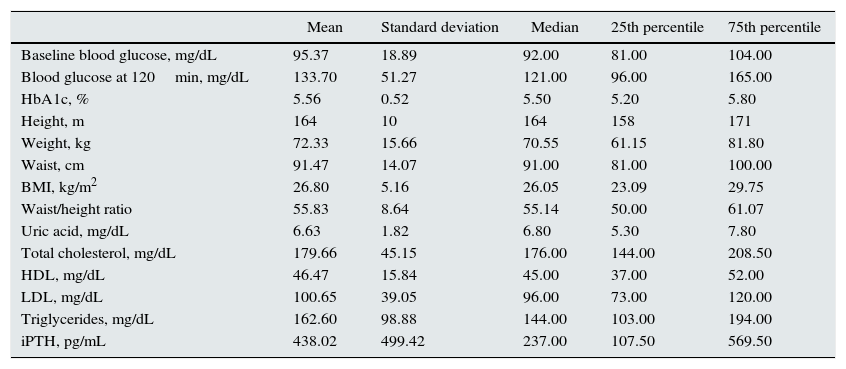
The anthropometric and general metabolic characteristics are shown in Table 1.
Anthropometric and metabolic characteristics of the study popluation.
| Mean | Standard deviation | Median | 25th percentile | 75th percentile | |
|---|---|---|---|---|---|
| Baseline blood glucose, mg/dL | 95.37 | 18.89 | 92.00 | 81.00 | 104.00 |
| Blood glucose at 120min, mg/dL | 133.70 | 51.27 | 121.00 | 96.00 | 165.00 |
| HbA1c, % | 5.56 | 0.52 | 5.50 | 5.20 | 5.80 |
| Height, m | 164 | 10 | 164 | 158 | 171 |
| Weight, kg | 72.33 | 15.66 | 70.55 | 61.15 | 81.80 |
| Waist, cm | 91.47 | 14.07 | 91.00 | 81.00 | 100.00 |
| BMI, kg/m2 | 26.80 | 5.16 | 26.05 | 23.09 | 29.75 |
| Waist/height ratio | 55.83 | 8.64 | 55.14 | 50.00 | 61.07 |
| Uric acid, mg/dL | 6.63 | 1.82 | 6.80 | 5.30 | 7.80 |
| Total cholesterol, mg/dL | 179.66 | 45.15 | 176.00 | 144.00 | 208.50 |
| HDL, mg/dL | 46.47 | 15.84 | 45.00 | 37.00 | 52.00 |
| LDL, mg/dL | 100.65 | 39.05 | 96.00 | 73.00 | 120.00 |
| Triglycerides, mg/dL | 162.60 | 98.88 | 144.00 | 103.00 | 194.00 |
| iPTH, pg/mL | 438.02 | 499.42 | 237.00 | 107.50 | 569.50 |
BMI, body mass index; HbA1c, glycosylated haemoglobin; HDL, high density lipoprotein cholesterol; iPTH intact parathyroid hormone; LDL, low density lipoprotein cholesterol.
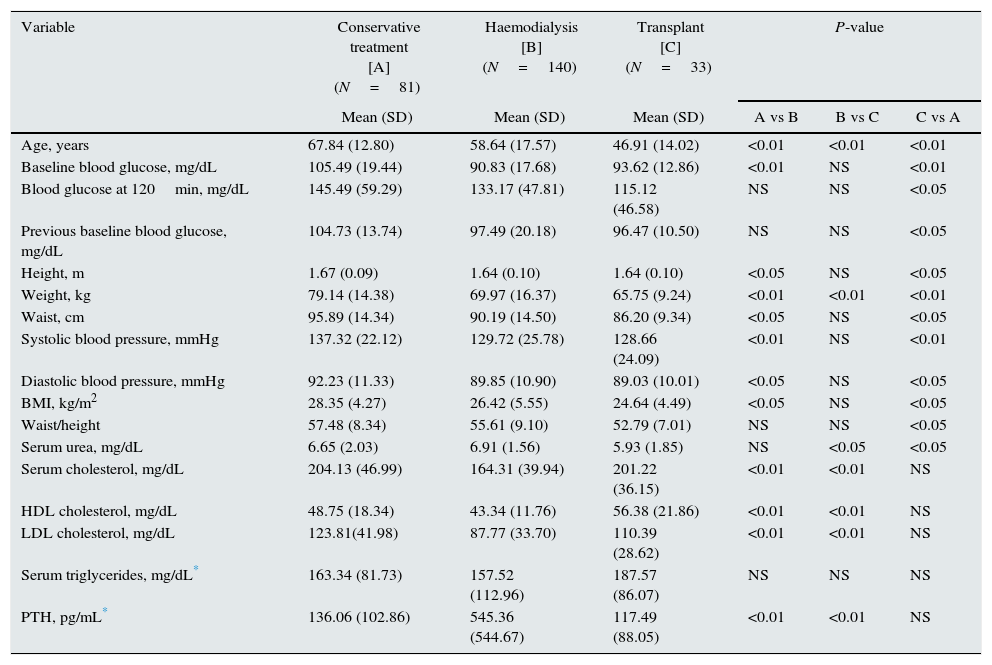
Table 2 shows the differences recorded in variables between patients on conservative treatment, on dialysis, or with transplant.
Differences between conservative treatment, dialysis, and transplant groups.
| Variable | Conservative treatment [A] (N=81) | Haemodialysis [B] (N=140) | Transplant [C] (N=33) | P-value | ||
|---|---|---|---|---|---|---|
| Mean (SD) | Mean (SD) | Mean (SD) | A vs B | B vs C | C vs A | |
| Age, years | 67.84 (12.80) | 58.64 (17.57) | 46.91 (14.02) | <0.01 | <0.01 | <0.01 |
| Baseline blood glucose, mg/dL | 105.49 (19.44) | 90.83 (17.68) | 93.62 (12.86) | <0.01 | NS | <0.01 |
| Blood glucose at 120min, mg/dL | 145.49 (59.29) | 133.17 (47.81) | 115.12 (46.58) | NS | NS | <0.05 |
| Previous baseline blood glucose, mg/dL | 104.73 (13.74) | 97.49 (20.18) | 96.47 (10.50) | NS | NS | <0.05 |
| Height, m | 1.67 (0.09) | 1.64 (0.10) | 1.64 (0.10) | <0.05 | NS | <0.05 |
| Weight, kg | 79.14 (14.38) | 69.97 (16.37) | 65.75 (9.24) | <0.01 | <0.01 | <0.01 |
| Waist, cm | 95.89 (14.34) | 90.19 (14.50) | 86.20 (9.34) | <0.05 | NS | <0.05 |
| Systolic blood pressure, mmHg | 137.32 (22.12) | 129.72 (25.78) | 128.66 (24.09) | <0.01 | NS | <0.01 |
| Diastolic blood pressure, mmHg | 92.23 (11.33) | 89.85 (10.90) | 89.03 (10.01) | <0.05 | NS | <0.05 |
| BMI, kg/m2 | 28.35 (4.27) | 26.42 (5.55) | 24.64 (4.49) | <0.05 | NS | <0.05 |
| Waist/height | 57.48 (8.34) | 55.61 (9.10) | 52.79 (7.01) | NS | NS | <0.05 |
| Serum urea, mg/dL | 6.65 (2.03) | 6.91 (1.56) | 5.93 (1.85) | NS | <0.05 | <0.05 |
| Serum cholesterol, mg/dL | 204.13 (46.99) | 164.31 (39.94) | 201.22 (36.15) | <0.01 | <0.01 | NS |
| HDL cholesterol, mg/dL | 48.75 (18.34) | 43.34 (11.76) | 56.38 (21.86) | <0.01 | <0.01 | NS |
| LDL cholesterol, mg/dL | 123.81(41.98) | 87.77 (33.70) | 110.39 (28.62) | <0.01 | <0.01 | NS |
| Serum triglycerides, mg/dL* | 163.34 (81.73) | 157.52 (112.96) | 187.57 (86.07) | NS | NS | NS |
| PTH, pg/mL* | 136.06 (102.86) | 545.36 (544.67) | 117.49 (88.05) | <0.01 | <0.01 | NS |
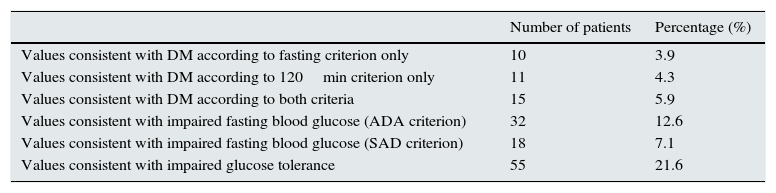
Table 3 shows the prevalence of DM and DM risk groups (IFG or IGT) in the whole sample.
Frequency of diabetes mellitus, impaired fasting blood glucose, and impaired glucose tolerance.
| Number of patients | Percentage (%) | |
|---|---|---|
| Values consistent with DM according to fasting criterion only | 10 | 3.9 |
| Values consistent with DM according to 120min criterion only | 11 | 4.3 |
| Values consistent with DM according to both criteria | 15 | 5.9 |
| Values consistent with impaired fasting blood glucose (ADA criterion) | 32 | 12.6 |
| Values consistent with impaired fasting blood glucose (SAD criterion) | 18 | 7.1 |
| Values consistent with impaired glucose tolerance | 55 | 21.6 |
The number of patients without DM according to any of the criteria used (fasting or 2h after glucose loading) was 218 (85.82%); the number with DM according to the fasting criterion only (without the 2h criterion) was 10 (3.94%; 95% CI, 1.35%–6.53%); the number with DM according to the 2h criterion only (without the fasting criterion) was 11 (4.33%, 95% CI, 1.63%–7.03%); the number with DM according to both criteria was 15 (5.91%, 95% CI, 2.81%–9.00%), and the number of patients with DM based on at least 1 criterion was 36 (14.17%, 95% CI, 9.69%–18.66%).
The frequency of DM differed according to the type of treatment. Diabetes was more common in individuals on cconservative treatment than in individuals on replacement therapy: 23.45% vs 9.82%) (P=.001).
Likewise, the frequency of IFG (ADA criterion) differed between treatments: 19.75% in those treated conservatively vs 9.24% in patients on replacement therapy (P=.02). The frequency of IGT was also higher in those treated conservatively (24.6% vs 20.23%) although the difference was not statistically significant (P=.521).
In the multivariate analysis by multiple logistic regression, having DM (using any of the accepted criteria) was associated with the waist circumference value (OR=1.033 per centimetre; 95% CI, 1.005–1.062; P=.019) and with the type of treatment, replacement vs conservative (OR=0.41; 95% CI, 0.19–0.92, P=.028). None of the other variables showed a statistically significant association.
DiscussionThe current criteria for blood glucose values for the diagnosis of DM, which are based on the probability of developing retinopathy,22 and the criteria for IFG in the general population23 have been modified several times in recent years. To this day, IFG in the general population remains a subject of debate, if we consider that different associations such as the American Diabetes Association (ADA),24 and the WHO18 place the cut-off value at 100mg/dL and 110mg/dL, respectively. The 120min blood glucose level of the WHO-standardised glucose loading test18 for the diagnosis of IGT and DM remains unchanged. The difficulty with this classification is the lack of concordance between the two values (fasting and post-loading) when it comes to identifying patients at risk of developing DM and in the development of cardiovascular disease.25 In 2010, the ADA added the use of standardised glycosylated haemoglobin for the diagnosis of DM and its intermediate stages.26
There is some information on the development of DM in patients with CKD on conservative treatment,20 on haemodialysis,15,19 and with renal transplant.12 However, in Argentina, despite it being known that CKD is associated with changes that can favour the development of glycaemic changes,9 there are few studies on the subject. In 2006, a study19 was published that assessed only patients on haemodialysis treatment with an OGTT, detecting new cases of DM and IFG in 6.7% and 20%, respectively. This observation, along with the discussion opened as to whether the assessment of such patients should follow general population protocols or be done as a strategy to increase detection sensitivity, encouraged us to broaden the sample to include other stages of CKD (conservative treatment and transplant patients).
The main contributions of this study are that the OGTT was performed in a standardised manner, and it included patients in 3 different stages of CKD, to detect patients whose glycaemic changes would have been missed if only a fasting blood glucose sample was analysed.
The results obtained show the percentage of patients with values consistent with DM, according to the criteria used by the ADA: fasting only, 3.94% (95% CI, 1.35%–6.53%); at 2h only, 4.33% (95% CI, 1.63%–7.03%); with both criteria, 5.91% (95% CI, 2.81%–9.00%); and at least one criteria, 14.17% (95% CI, 9.69%–18.66%), respectively.
Other authors, such as Salifu et al,15 also detected underdiagnosis of DM, after analysing 59340 data from the USRDS, detecting previously-unknown new onset DM after dialysis (NODAD) in 7.6%. Follow-up of these patients showed a higher 3-year mortality risk than in those who did not develop DM. Data from the Taiwan National Health Insurance Research Database,27 with a significant number of incident patients (51487), showed a cumulative incidence of new cases of DM of 4% the first year, reaching 21% at 9 years when taking haemodialysis and peritoneal dialysis into account, without significant differences between these two modalities. Another study,14 which evaluated the presence of DM in patients awaiting transplant, showed an incidence of 6% and, in post-transplant patients, an incidence of 18% to 30%, depending on the medication given. Basturk performed an OGTT in patients in stage 3 and 4 CKD and observed that 59.3% had IFG, 59.3% had IGT, and 9.7% had DM.28 Another study, performed by Rufino,20 in patients with stage 4 and 5 CKD, demonstrated that, of patients with normal fasting glucose levels, 38% had IGT and 5% had DM: this indicates the need to perform OGTT to adequately diagnose all the glycaemic changes present in these stages.
Although the majority of studies, like ours, confirm the underdiagnosis of dysglycaemia, but the methodologies are not comparable, as the first were performed using data review and the last 2, which used the OGTT, used different protocols.
The difference in prevalence of abnormal blood glucose levels between fasting and post-load samples could be due to the presence of peripheral muscular insulin resistance found in uraemia,29 which is detected mainly by performing an OGTT.30 In addition, we know that the 2 methods reveal patient groups with different physiological abnormalities,31–33 which could be present in the different CKD subgroups. Another point that supports the use of the OGTT is that in the general population at risk, the risk of progression to DM and the cardiovascular risk are greater if both abnormalities (IFG and IGT) are observed simultaneously. This justifies their detection, as this information is not known in the CKD population.
When analysed according to type of treatment, the data on the frequency of values consistent with DM were different between individuals on conventional treatment and individuals on replacement therapy: 19 cases (23.45%) vs 17 cases (9.82%) (P=.001). The same is seen with the data analysis for the different stages of DM risk groups, where we observe that the frequency of impaired fasting glucose values (ADA criterion) differs between treatments: 19.75% in patients treated conservatively vs 9.24% in patients on replacement therapy (P=.02). The frequency of IGT was also higher in those treated conservatively (24.6% vs 20.23%), although the difference was not statistically significant (P=.521).
The findings of this study have different interpretations. One interpretation is related to the fact that, the group of patients on conservative treatment had higher body mass index and waist measurements and more obesity, probably forming non-comparable groups. It must be clarified that our aim was not to compare the groups but to confirm the suspicion that in CKD there is a large subgroup of patients in which glycaemic changes go undetected, and consequently, their significance is unknown.
We must point out that there are very few publications that study the incidence or prevalence of blood glucose values for DM risk groups in CDK; the high prevalence observed in this study justifies their early detection. In addition, insulin resistance in CKD is observed even in patients without DM and in the early stages of CKD34,35; therefore, it could be interpreted that the higher prevalence of glycaemic changes in the conservative treatment group could be attributed in some way to this resistance. It could also be due to the pathophysiological changes brought on by the start of replacement therapy, when uraemia and acidosis improves, blood pressure and dyslipidaemia improve significantly, and parathyroid hormone levels decrease: these factors are known to influence insulin secretion and the development of insulin resistance.36 Such changes can have consequences for dysglycaemia, as has also been demonstrated by other studies.37–39
In the multivariate analysis by multiple logistic regression, it was observed that having values consistent with DM (by any of the accepted criteria) was associated with the waist circumference value (OR=1.033 per cm; 95% CI, 1.005–1.062; P=.019) and with the type of treatment (OR=0.41; 95% CI, 0.19–0.92; P=.028). No other variables showed significance, probably due to the low number in each subgroup, something that was a limitation of this study.
The limitations of this study include the low number of patients in each subgroup, which did not allow differentiation between the changes seen in patients in stages 3, 4, and 5 on conservative treatment. In addition, only one test was performed per patient. Another potential limitation is that patients were not paired by weight and sex to make comparisons between subgroups possible.
However, the contributions of this observational study are that it included 3 stages of CKD; there is no other study in the references with these characteristics. Likewise, the underdiagnosis of intermediate changes in blood glucose values (denominated DM risk group by the ADA in 2015) and DM in all stages was confirmed.
This study leads us to propose that, to detect all glycaemic changes in patients with CKD, an OGTT should be performed in all stages of CKD and especially in patients on the transplant waiting list. Furthermore, we propose the need to standardise the methodology in this patient group, given that, as in other studies such as that by Rufino,20 if the OGTT had not been performed, the presence of dysglycaemia would go undetected in many patients. It should be noted that the WHO18 also suggests the OGTT preferentially in the general population, and the ADA26 suggests it as an optional method with HbAlc or fasting glucose.
This alternative allows not only the early detection of dysglycaemia, but also starting preventative treatment to avoid progression from DM risk groups to DM, as well as determining the most appropriate medication during transplantation, and the possibility of early access to treatment for the previously unknown new cases of DM to reduce the high morbidity and mortality.
Conflicts of interestThe authors declare no financial conflicts of interest.
We thank the members of the Grupo de Metabolismo de la Sociedad de Nefrología Argentina (Argentine Society of Nephrology Metabolism Group), to which we belong, for their collaboration on this study.
Please cite this article as: De’Marziani G, Soler Pujol G, Obregón LM, Morales EM, Gonzalez CD, Gonzalez Paganti L, et al. Alteraciones glucémicas en los pacientes con enfermedad renal crónica. Nefrologia. 2016;36:133–140.


