Background: Darbepoetin alfa (DA) administered every-other-week (Q2W) is efficacious and safe for the treatment of anaemia in patients undergoing dialysis. There are no data available regarding the evolution of erythropoietic resistance index (ERI) after conversion from weekly (QW) to Q2W administration of DA in clinical practice. Material and methods: Multicenter, observational, retrospective, 16-weeks study, which included stable patients undergoing dialysis who were converted from DA QW to DA Q2W in clinical practice. Conversion was done according to product specifications (duplicating QW dose). The ERI to DA was calculated by dividing the weekly DA dose per kilogram of weight (µg/wk.kg)*200 by the Hb level (g/dL). ERI evolution with time was evaluated by multivariate repeated measures ANOVA, adjusting for significant covariates. Results: A total of 202 patients were included (137 patients undergoing haemodialysis [HD], intravenous (IV) DA, and 65 patients receiving peritoneal dialysis [PD], subcutaneous DA). Mean (SD) age was 66 (17) years; 61% of patients were men. Large intercentre variability was observed for the ERI at conversion time (coefficient of variation of 88%, p <0.001 for differences between centres). In the univariate analysis, predictor factors for high baseline ERI were low albumin level (r = –0.29; p =0.001), HD (mean ERI of 9.3 [8.4] vs 6.8 [4.6] for PD; p = 0.005), or previous cardiovascular disease (9.9 [8.7] vs 7.4 [6.3] for patients without history; p =0.025). During the follow up, the ERI was slightly increased in HD patients (9.3 [8.4] at conversion vs 11.1 [7.3] at 16 weeks; p <0.05), and remained stable in PD patients (6.8 [4.6] vs 6.7 [4.0], respectively; NS). In the multivariate analysis, there were no significant differences in ERI during the 16 weeks post-conversion after adjusting for albumin levels and centre (adjusted baseline mean [95% CI] of 10.0 [8.7-11.4] vs 10.5 [9.3-11.8] at 16 weeks, adjusted change of +0.5 [–0.67; 1.67] ; NS). After 16 weeks, only 7 patients (3.5%) had discontinued Q2W administration. Conclusions: Extension from weekly to once every-other-week darbepoetin alfa allows to simplify anaemia treatment without increasing the resistance index, regardless of dialysis type. The multivariate analysis shows that, after adjusting by center and inflammation/nutritional status, there were no changes in the response to darbepoetin alfa during the first 16 weeks after conversion in clinical practice.
Antecedentes: Diversos estudios han demostrado la eficacia de darbepoetina alfa (DA) administrada quincenalmente (C2S), lo que permite simplificar el tratamiento para la anemia, pero faltan datos acerca de la evolución del índice de resistencia (IRE) tras el espaciamiento desde una frecuencia semanal (CS) en la práctica clínica. Material y métodos: Estudio observacional, multicéntrico, retrospectivo, con 16 semanas de seguimiento, en pacientes dializados estables convertidos de DA CS a C2S. El espaciamiento se realizó según ficha técnica (duplicación de dosis semanal). El cálculo del IRE fue: dosis DA (µg/sem.kg*200)/Hb (g/dl). Se analizó la evolución del IRE mediante un ANOVA multivariado de medidas repetidas, ajustando por variables confusoras. Resultados: Se reclutaron 202 pacientes (137 en hemodiálisis [HD], DA intravenosa, y 65 con diálisis peritoneal [DP], DA subcutánea). La edad media (DE) fue 66 (17) años, y el 61% eran hombres. Se apreció una gran variabilidad intercentro en el IRE basal (coeficiente de variación del 88%, p <0,001 para diferencias entre centros). En el análisis univariado los factores predictores de IRE elevado fueron un bajo nivel de albúmina, la HD, o los antecedentes de enfermedad cardiovascular. Durante el seguimiento, el IRE aumentó ligeramente en los pacientes con HD (9,3 [8,4] basal frente a 11,1 [7,3] a 16 semanas; p <0,05), y se mantuvo estable en los pacientes con DP (6,8 [4,6] frente a 6,7 [4,0], respectivamente; NS). En el análisis multivariado, tras ajustar por los niveles de albúmina y el centro, el IRE global no presentó cambios significativos (media [IC 95%] basal de 10,0 [8,7-11,4] frente a 10,5 [9,3-11,8] a las 16 semanas, cambio ajustado de +0,5 [–0,67; 1,67]; NS). Conclusiones: La conversión de frecuencia semanal a quincenal de DA logró mantener el IRE, con independencia del tipo de diálisis. El análisis multivariado refleja que, una vez ajustado por las variables centro y estado de inflamación/nutricional del paciente, no hay cambios en el IRE en las primeras 16 semanas tras el espaciamiento.
INTRODUCTION
Anaemia is an important complication of chronic kidney disease (CKD)1 which is frequently present in patients undergoing dialysis.2 Treatment with erythropoiesis-stimulating agents (ESAs) effectively raises haemoglobin levels, which substantially improves quality of life.3 Furthermore, numerous studies indicate that higher haemoglobin levels are associated with a higher survival rate4 and a lower number of hospitalisations.5
Darbepoetin alpha (DA) is an erythropoietic protein which contains additional sialic acid molecules compared with endogenous human erythropoietin, and as a result, its half-life is approximately three times longer than recombinant human EPO (rHuEPO).6 Administration of ESAs on a fortnightly basis compared with a weekly basis can be associated with better comfort and a lower risk of accidental punctures. These advantages are particularly apparent in transplant patients or those on peritoneal pre-dialysis who self-administer their medication.
Several clinical trials have demonstrated the effectiveness of fortnightly DA in dialysis patients. In one analysis which included data from eight prospective single-group studies in multiple centres in the EU, fortnightly DA was shown to effectively maintain haemoglobin levels in patients who had previously received weekly rHuEPO, with no significant dosage increase.7 Another phase 3, double-blind, random multi-centre study showed that fortnightly DAwas not inferior to weekly DA for maintaining Hb levels in patients on haemodialysis.8
Although the effectiveness and safety of fortnightly DA have been proven by these intervention studies, the analysed groups may not represent the true heterogeneous nature of the population on haemodialysis. As a result, it is necessary to gather more information on the effectiveness of fortnightly administration in clinical practice.
The EPO resistance index (ERI) establishes the relationship between the dose and the response to treatment, and it is stated in U/kg/week/g/dl Hb. It is a useful index for evaluating the changes in effectiveness of different ESAs when their method of administration is changed, or when they are used with concomitant treatments.9 The differing need for and response to ESAs depends on a series of factors that are listed in section IV of the European Treatment Guidelines for optimal treatment of anaemia with CKD.10 These factors can traditionally be classified as patient-dependent (comorbidities, nutritional state, inflammation) and dependent on the treatment in question, including iron treatment and characteristics of the administered dialysis.12
The main objective of this study is to describe ERI evolution in patients who change from weekly to fortnightly DA treatment in clinical practice, as well as its relationship with patient characteristics.
MATERIAL AND METHODS
Patients
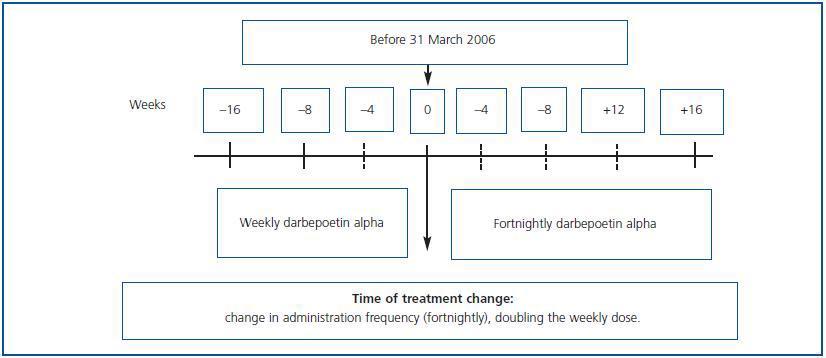
Observational, multi-centre retrospective study including patients on haemodialysis and peritoneal dialysis who, after having received DA weekly during a minimum period of 16 weeks (between October 2006 and June 2007), began to receive it fortnightly (figure 1). It included patients older than 18 years who before the change in treatment were in a maintenance phase for their anaemia treatment with a haemoglobin variation below 1.5g/dl and a dosage variation lower than 25% over the eight preceding weeks. Follow-up was performed for 16 weeks after the change in treatment.
The exclusion criteria included participation in another clinical study, a change in dialysis type or serious associated comorbidity during follow-up (active tumour process, acute infection, hospital admission, significant haemorrhage or any other conditionthat would interfere with the purpose of the study).
The change was carried out by doubling the weekly dosage and administering it by the same route every 15 days. The ERI was calculated by dividing the weekly DA dosage in U per kilogram of body weight (µg x 200/kg) by the Hb levels (g/dl). For European patients, 200U of rHuEPO = 1µg DA is the conversion factor for adapting the dose properly when changing from rHuEPO to DA.
At the beginning of the study, we recorded demographic data, comorbidity (determined by the Charlson index) and dialysis characteristics, including type, vascular access, haemodialysis membrane and endotoxin filters in the haemodialysis monitors and Kt/V.
During the follow-up phase, we recorded weight, haemoglobin, haematocrit, DA dosage, ferritin, transferrin saturation index (TSI), iron treatment, C-reactive protein (CRP), erythrocyte sedimentation rate (ESR), albumin, creatinine, prealbumin, calcium, phosphorous, parathyroid hormone, use of angiotensin converter enzyme (ACE) inhibitors and/or angiotensin II receptors antagonists. We recorded adverse reactions to DA, which were codified according to the MedDRA dictionary.
The study was carried out according to the latest revision of the Declaration of Helsinki and the Good Clinical Practice guidelines. All of the patients provided their informed consent in writing. The study was approved by the appropriate local ethics committees.
Numerical variables are shown as means and standard deviations. The Wilcoxon-Mann-Whitney and Student-t tests were used for paired data, according to normality assessment, when evaluating differences between initial values and week 16. Univariate analysis (chi-square, Mann-Whitney or Student-t tests, as appropriate) were used to determine prediction factors for ERI. Quantitative variables were associated using Pearson’s correlation. The ERI evolution over time was evaluated using a multivariate ANOVA procedure for repeated measurements adjusted for confounding variables. The Kolmogorov-Smirnov test was used to see ERI distribution. P-values < 0.05 were considered significant. For statistical calculations, we used SPSS software, version 15.0 (SPSS Inc., Chicago, Illinois, USA.)
RESULTS
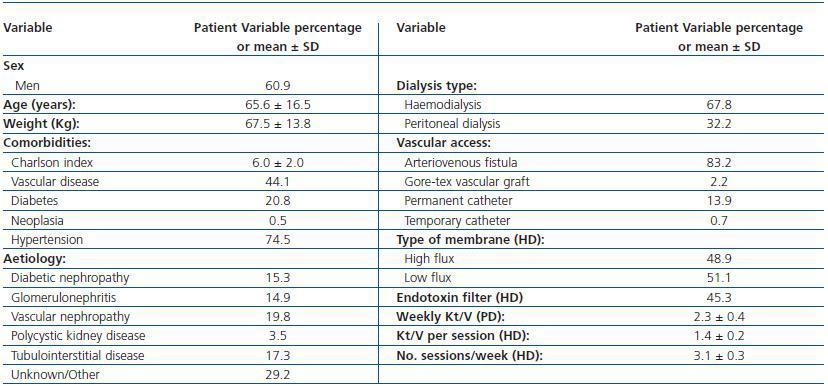
A total of 202 patients were recruited from 23 centres; 137 were on haemodialysis and treated with intravenous DA, and 65 patients were on peritoneal dialysis and treated with subcutaneous DA. Table 1 shows the main demographical and clinical traits for the population under study. Table 2 lists the biochemical parameters at baseline and at the end of follow-up. For the population as a whole, no significant changes were observed for any parameter, except for slight decreases in ESR and haematocrit.
Table 3 shows the data for haemoglobin, DA dosage and ERI just after the change and following 16 weeks of fortnightly treatment. We see a significant increase in the DA dosage and in ERI, along with a decrease in haemoglobin levels in patients on dialysis; no changes were observed in patients on peritoneal dialysis.
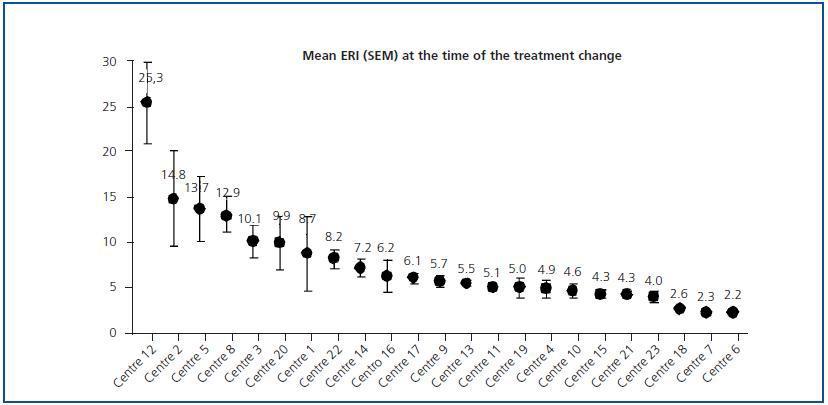
Initial ERI did not follow a normal distribution (p = 0.759, Kolmogorov-Smirnov test), and was also extremely variable (from 2.2 ± 0.1 to 25.3 ± 11.8). Analysis of the two prediction factors of baseline ERI revealed a significant association with the dialysis centre (figure 2; p < 0.0005). The dialysis method was also highly influential: Patients on haemodialysis had a higher ERI than patients on PD (9.3 ± 8.5 compared with 6.7 ± 4.5 U weekly/kg/g/dl, respectively; p = 0.005). Other factors associated with a higher baseline ERI were a low albumin level (r = - 0.29; p = 0.001) or a history of cardiovascular disease (9.9 ± 8.7 compared with 7.4 ± 6.3 in patients with no cardiovascular history; p = 0.025). In patients undergoing peritoneal dialysis, the weekly Kt/V was inversely related to baseline ERI (r = - 0.29; p = 0.017) while no significant association with Kt/V per session was observed for patients on haemodialysis.
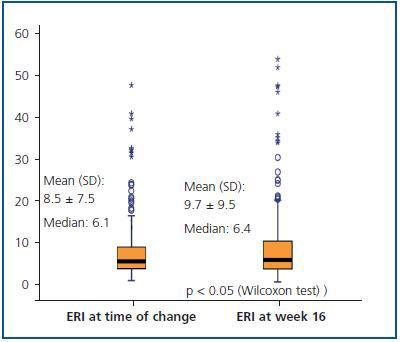
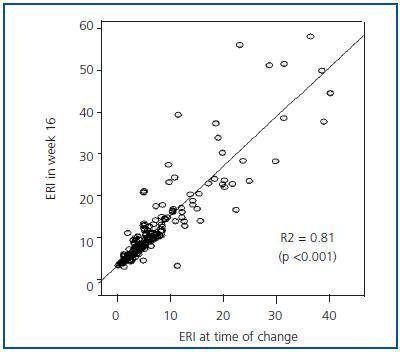
Figure 3 shows the mean and median ERI at the time of the treatment change and after 16 weeks for the entire studied population; here, we can observe a slight significant increase (p < 0.05; table 3). Figure 4 shows the relationship between initial and final ERI for each patient. Here, we see greater dispersion in patients with a higher baseline ERI.
The percentage of patients with Hb > _11g/dl went from 93.1% initially (95% CI from 0.89-0.97%; n = 188/202) to 85% (95% CI from 0.80-0.90%; n = 170/200) in week 16. We did not observe significant changes in iron consumption or in related variables: 73% (n = 72) of patients were treated with intravenous iron at the beginning compared with 71% (n = 70) in week 16, with mean doses of 195 ± 120mg/month compared to 192 ± 42mg/month, respectively.
In the analysis of factors associated with increased ERI during the study (data is not shown), only the “centre” variable showed a significant correlation (p < 0.0005). The mean change oscillated between - 0.9 ± 5.5 and + 13.5 ± 10.8; significant increases were found in six of the 23 participating centres (26.1%): centre 12: + 8.1 (95% CI: 1.8 - 14.4 [+ 32% compared to baseline value]); centre 5: + 13.5 (95% CI: 5.4 - 21.5 [+ 98%]); centre 3: + 1.2 (95% CI: 0.2 - 2.2 [+ 11%]); centre 20: + 1.5 (95% CI: 0.9 - 2.1 [+ 15%]); centre 17: + 0.3 (95% CI: 0.1 - 0.5 [+ 4.9%]) and centre 19: + 2.1 (95% CI: 1.1 - 3.1 [+ 42%]).
In order to attempt to explain the centre effect, we analysed the possible differences between centres where there was a significant increase of ERI during the study, and all others (table 4). The six centres with an increase in ERI showed the following: less use of endotoxin filters in haemodialysis monitors, lower Kt/V per haemodialysis session, a higher DA dose and higher baseline ERI, and lower baseline CRP and TSI levels.
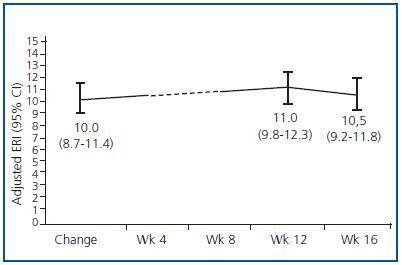
We created a multivariate model to analyse the change in ERI, adjusting for the confounding variables listed above. The explicative model reveals that, after adjusting values by albumin level and centre (the only significant variables in the model), there was no significant change in ERI during the 16 weeks following the treatment change (mean change [95% CI] adjusted for ERI: + 0.5 [–0.67; 1.67]; NA; table 5 and figure 5).
Only 11 patients (5.4%) abandoned the fortnightly treatment programme during the 16-week follow-up period and returned to weekly treatments either temporarily or permanently. These patients, most of whom were on haemodialysis (9 patients) and who had very different baseline ERIs, all showed an increased resistance to darbepoetin alpha in the 4-8 weeks before leaving treatment (data not shown). At 16 weeks, 195 of the 202 patients (96.5%) were being treated with fortnightly DA.
From a safety perspective, two patients (1%) suffered adverse reactions to DA: one had peritonitis and the other, arteriovenous fistula thrombosis.
DISCUSSION
In our study, we observed increased ERI following a change from weekly to fortnightly DA treatment in patients on haemodialysis, although after adjusting for the dialysis centre confounder and patients’ inflammation/nutrition state (albumin level), no differences were found at 16 weeks that could be attributed to the treatment change. These results coincide with those found in a large patient cohort from a recent European multi-centre study.11 However, for patients on peritoneal dialysis, no changes were observed after the treatment change, which corroborates other data in the literature.12 These findings indicate that these patients may benefit from this treatment frequency, which is much more comfortable.
The most frequent causes of EPO resistance are iron deficiency (absolute and/or functional)13 and the presence of chronic infectious or inflammatory diseases.14 In this study, we found no correlation between baseline ERI and iron parameters or the Charlson index, although in other studies with a higher number of patients, these associations are very much in evidence.14 However, we must point out that patients with acute infectious diseases were excluded as per protocol, and the TSI levels were lower in those centres in which a significant ERI increase occurred.
According to the references,14-16 patients with a higher baseline ERI had lower levels of serum albumin and a higher percentage of cardiovascular disease.With regard to dialysis characteristics, a lower Kt/V was associated with increased DA resistance only among patients on peritoneal dialysis; in general, haemodialysis presented higher ERI than peritoneal dialysis.
In this multi-centre study, a significant centre effect is very evident in both baseline ERI in the cohort and in ERI variation during follow-up. The enormous variability of responses from centre to centre has already been indicated in other studies carried out in Spain. Another multi-centre study17 carried out in 24 haemodialysis units reported a mean of 0.08 ± 0.04 for ERI to DA, which means the variation coefficient is 50%; this is somewhat lower than what we observed in our study, but it is also very high. The Management Group for haemodialysis quality indicators at the SEN (Spanish Society of Nephrology)18 states that the mean weekly ESA dose (which is closely correlated to resistance) could constitute a good ongoing quality indicator, but it warns us that its use for comparing different centres is limited, as centres may vary according to a large number of parameters.
In most haemodialysis centres in our study, the ERI remained without significant changes and only underwent a significant change (an increase of more than 15%) in three of them. The centres with an ERI increase have certain differentiating characteristics that could explain the ERI instability, such as lower use of endotoxin filters in monitors or lower doses of dialysis.With regard to endotoxin filters, it is well known that the water quality used in haemodialysis plays an important role in the ESA response,19 which is why using endotoxin filters in each monitor is highly recommended. However, more control studies are needed to determine the true role that using filters plays in patients’ response to ESAs.
The relationship between dialysis dose and response to ESAs is the source of even more debate.While some studies show that the two are substantially related,20,21 the MAR study, in which the mean Kt/V of the 1,700+ patients in the study is higher than 1.6, shows no correlation with response to ESAs.14 The joint conclusion for these studies is probably that patients with insufficient dialysis may have increased resistance to ESAs, while if the dialysis dose is correct, an increase in Kt/V is not accompanied by a better response.
In the haemodialysis patient group, increased ERI was associated with lower TSI. These findings confirm the data found in large patient series.14 Although DOQI guidelines22 and European guidelines10 establish the minimum TSI levels, the optimum levels are unknown. The DRIVE23 study indicates that patients with low TSI levels and high serum ferritin levels can benefit from intravenous iron treatment. We must also point out that although 66% of the patients in the study received intravenous iron and the ferritin and TSAT levels stayed within the normal range, one of every four patients had a TSAT level below 20% during the study, meaning that the current guidelines are still insufficient.
On the other hand, there were no comorbidity differences between patients at centres where an ERI increase did and did not occur, and therefore that increase did not seem to be caused by patients’ intrinsic characteristics. Furthermore, these are centres where baseline DA doses and ERI were higher, indicating that for these centres, the patients’ condition is worse in general and fortnightly DA administration should be approached with caution. Paradoxically, centres in which there was an ERI increase throughout the study had a lower CRP level than that measured at centres where there was no increase. This finding is hard to explain based on the results we obtained.
However, one of the main limitations of our results is that certain variables that were previously said to influence ESA resistance were not examined in this study. Bacterial contamination in the dialysis fluid19 or the chloramine level in the water24 are some examples.
85% of the patients who received doses less frequently remained with an Hb level > 11g/dl after 16 weeks, and 94.5% of the patients who doubled the dose amount continued with the fortnightly treatment. This low treatment abandonment rate in a retrospective study of clinical practice, and the maintenance of the Hb level in most patients (excluding the problems observed in three centres that were mentioned above) indicate that most patients on haemodialysis who receive DA on a weekly basis could benefit from changing to fortnightly treatment.
Among the peritoneal dialysis patients in the study, the change from weekly to fortnightly treatment does not produce any changes in the response. These data corroborate other studies listed in the literature.12 It is in these cases that changing from weekly to fortnightly DA could have a greater impact on patients’ quality of life, given that most of them administer their own ESAs, and reducing the number of subcutaneous injections would be a major improvement. Similar conclusions could be extrapolated for transplant patients or those in predialysis.
In conclusion, the results of this study confirm that fortnightly DA treatment for anaemia is effective in patients on dialysis, and they show that decreasing the dose frequency for stable haemodialysis patients does not alter the response in most of them. In patients on peritoneal dialysis, the response after decreasing dose frequency is nearly identical.
Acknowledgements
The authors would like to thank Neus Valveny at Trial Form Support S.A., for her help in preparing the manuscript, and Amgen S.A. for financing the study and its publication. The following researchers contributed to this study: Dr. Antonio Llopis (Policlínica San Carlos, S.L.); Dr. Joan Fort (Vall d’Hebron General Hospital); Dr. Jorge Bartolomé Espinosa (Sant Gervasi H.); Dra. Amparo Bernat, Dr. Javier Martín Martín, Dr. Manuel Fuentes, Dr. Enrique Albert (Dr. Peset Hospital); Dr. Jesús Montenegro (Hospital of Galdakao); Dra. Rosario Moreno, Dra. Mercedes García (San Juan de Dios Hospital); Dra. M.ª José Galán, Dra. M.ª Cruz Cid (Infanta Cristina Hospital); Dr. Manel Vera (Clinical and Provincial Hospital); Dr. Antonio Llopis (Vistahermosa Clinical); Dra. Rosa Ortega, Dra. Cloti Ríos (Virgen de La Macarena Hospital); Dr. Alfonso Miguel (University Clinical Hospital of Valencia); Dra. Dolores Arenas, Analia Moledous, María Teresa Gil González (Perpetuo Socorro Clinic, Alicante); Dr. Miguel Pérez Fontán, Dra. Teresa García Falcón (Juan Canalejo Hospital Complex); Dr. Manuel Arias, Dr. AL Martín de Francisco (Marqués de Valdecilla Hospital); Dr. Rafael Álvarez Lipe, Dr. Francisco Martín, Dr. Jesús Cebollada (Lozano Blesa University Clinic Hospital); Dra. Rosa Ramos (Sant Antoni Abat Hospital); Dr. Cesar Remón (Puerto Real University Hospital); Dra M.ª José Espigares (San Cecilio University Clinic Hospital); Dr. Juan Manuel López Gómez (Gregorio Marañón Hospital); Dra. Maite Villaverde (Dialcentro Clinic, Madrid), Dra. Dolores Güimil (Barbanza Hospital); Dr. Cristóbal Donapetry, Dra. María Montserrat Pousa, Dra. Ana Isabel Díaz (Hospital Da Costa, Burela); Dra. Cristina Pérez Melón (Hospital of Ourense).
Figure 1.
Table 1. Demographic and clinical data for patients who changed from weekly DA to fortnightly DA
Table 2. Evolution of analytical parameters for the entire study population over 16 weeks
Table 3. Haemoglobin, darbepoetin alpha (DA) dosage and DA resistance index (ERI) at beginning of the treatment change and at 16 weeks
Figure 2.
Figure 3.
Figure 4.
Table 4. Differentiating features of the 17 centres with stable or decreased ERI levels during the study (n = 157 patients) vs. the six centres with increased ERI (n = 45 patients)
Table 5. Multivariate model for predicting ERI during the study
Figure 5.


