


Epicardial and mediastinal adipose tissue (EAT, MAT) are linked to metabolic syndrome and coronary artery disease. Patients with chronic kidney disease (CKD) have thicker EAT. We assessed if EAT and MAT could be associated with increased mortality and cardiovascular events in patients with advanced CKD and haemodialysis therapy.
MethodsA post-hoc study was performed. We analyzed a prospective series of 104 cases. EAT thickness was quantified by a multislice synchronized computed tomography (MSCT).
ResultsThe follow-up period was 112.68 (109.94–115.42) months. The optimal cut-off point of EAT for prediction of total mortality was 11.45 mm (92.86% and 43.75%). EAT thickness was associated with serum albumin levels, serum triglyceride levels, phosphorus and calcium phosphate product. The EAT was greater in haemodialysis patients compared to those with advanced CKD (P < .001). Patients with diabetes mellitus had greater EAT and MAT thickness (P = .018). At the end of follow up, the survival average time of patients with EAT thickness <11.45 mm was 97.48 months vs. 76.65 months for thickness > 11.45 mm (P = .007).
ConclusionsA higher EAT and MAT thickness was associated with increased mortality. Furthermore, EAT was associated with lower free survival time to fatal and non-fatal cardiovascular events. The measurement of EAT and MAT by MSCT could be a prognostic tool to predict cardiovascular events and mortality risk in advanced CKD patients.
El tejido graso epicardico (EAT) y mediastínico (MAT) se relaciona con el síndrome metabólico y la enfermedad arterial coronaria. Los pacientes con enfermedad renal crónica (ERC) tienen mayor volumen de EAT. El objetivo de nuestro estudio fue determinar si estos depósitos adiposos podrían estar relacionados con un aumento de mortalidad y eventos cardiovasculares en pacientes con ERC avanzada y en hemodiálisis.
MétodosSe realizó un análisis post hoc de una serie prospectiva, de 104 casos, con una tomografía computarizada sincronizada multicorte (MSCT) que permitiera cuantificar el grosor EAT.
ResultadosEl periodo de seguimiento fue de 112,68 (109,94-115,42) meses. El punto de corte de EAT con mayor sensibilidad y especificidad para predecir mortalidad total fue 11,45 mm (el 92,86 y el 43,75%, respectivamente). Las variables que se correlacionaron con el EAT fueron la albúmina, el nivel sérico de triglicéridos, de fósforo y el producto fosfo-cálcico. El EAT fue mayor en pacientes en hemodiálisis respecto aquellos con ERC avanzada (p < 0,001). Los pacientes con diabetes mellitus tenían mayor grosor de EAT y MAT (p = 0,018). La supervivencia media de los pacientes con EAT < 11,45 mm fue de 97,48 meses vs. 76,65 meses para un grosor > 11,45 mm (p = 0,007).
ConclusionesUn mayor grosor de EAT y MAT se relacionó con un incremento de mortalidad total. Además, el EAT se asoció con una menor supervivencia libre de eventos cardiovasculares fatales y no fatales. La cuantificación de EAT y MAT mediante MSCT podría tener valor pronóstico para pacientes con ERC avanzada y hemodiálisis.
Chronic kidney disease (CKD) is associated with a high risk of cardiovascular (CV) morbidity and mortality.1,2
Epicardial fatty tissue (EAT) is an emerging CV risk factor.3–5 It is a perivisceral fatty tissue that surrounds the coronary arteries and the heart, and directly contacts the underlying myocardium. Embryologically it comes from the splacnopleural mesoderm and is a metabolically active tissue.6 In pathological situations, it produces pro-inflammatory cytokines. These cytokines are released to the adjacent myocardium and to the coronary blood flow, in such a way that they have systemic and paracrine effects, influencing the development of coronary atherosclerosis.7 In the general population, EAT has been associated with metabolic syndrome, diabetes mellitus (DM)6–9 and coronary artery disease (CAD).10–12
Mediastinal adipose tissue (MAT) is deposited outside the parietal fascia of the pericardium. The distinction between the different locations of fat deposits is important, since pericardial fat has specific metabolic characteristics and different blood drainage.13–17
The quantification of EAT is not standardized, the studies are heterogeneous in terms of radiological technique and the location of the fat, and there is no consensus on the reference ranges.13,18
In patients with advanced CKD or undergoing renal replacement therapy, the volume of EAT has been linked to coronary artery calcification (CaC), atherosclerosis, inflammation and malnutrition.12,19–22 However, there are few data on their predictive ability of CV events and mortality in these patients.23
The primary objective of our study is to determine whether the quantification of EAT and TMA by multislice synchronized computed tomography (MSCT) is associated with an increase in mortality in patients with advanced CKD (stages 4 and 5) and on hemodialysis.
As secondary objectives, we explored the association of these parameters with the combined variable of mortality and CV events, the relationship with the CaC score and with biochemical and clinical CV risk factors typical of this population.
MethodsThe present study is a post hoc analysis of a prospective and cohort series initially designed to study the capacity of CaC score to predict CV risk.24 The initial study included 137 patients with advanced CKD or on a chronic hemodialysis program, being followed at the Nephrology Unit of the Hospital Universitario Príncipe de Asturias. The inclusion period was 2 years.
The inclusion criteria were: age older than 18 years, advanced CKD (stages 4–5) and in a hemodialysis program, at least during the 6 months prior to recruitment. The exclusion criteria were: acute renal failure, pregnancy, an intercurrent disease that conditioned an estimated survival of less than 12 months, and the inability to perform an MSCT.
The cases selected had an adequate imaging study available that would allow calculating the thickness of the fatty tissue around the heart in its different locations or grooves.
All patients signed the informed consent. The study protocol was approved by the local ethics committee.
As part of the routine assessment of patients in the Nephrology Unit, a blood sample was obtained within the month prior to performing an MSCT. Biochemical parameters related to renal function, lipids, bone and mineral metabolism were performed. The time on hemodialysis was defined as the period elapsed since initiation of hemodialysis until the day of the MSCT.
All included patients had available 16-detector MSCT, Light Speed Plus GE medical System. Intravenous contrast was not used and the images acquired were reassembled in 2–3 mm slices. Image processing was carried out on an Advantage Workstation 4.0 console (General Electric, New York, USA).
An attenuation threshold between –200 and –20 Hounsfield units (HU) was used to isolate pericardial fat. The measurement of the thickness of the fatty deposit of interest was defined by manual delineation in millimeters, and following the distribution proposed by other authors.11 The total amount of fat in each compartment resulted from the sum of the thickness of the adipose deposit in each groove or region:
- ‐
MAT: fatty deposit located in the mediastinum, outside the parietal pericardium (presternal fat, anterior pleural, pleuro-azygoesophageal, paravertebral and cardiophrenic sinuses).
- ‐
EAT: visceral fat deposit located intrapericardially and contiguous to the myocardial surface (left and right atrioventricular grooves, interventricular groove, right apex and pericardial thickness or right ventricular free wall.
Quantification of the CaC score was determined by the method developed by Agatston, which sets a threshold of 130 HU for determining whether a lesion is calcified.25 CaC scores with a score between 100 and 400 HU indicate moderate atherosclerosis and a relatively high probability of coronary heart disease; CaC values> 400 HU indicate severe atherosclerotic disease, with a high probability of obstructive CAD and a high risk of ischemia.26
To obtain the primary endpoint, incident CV events that caused hospitalization (acute heart failure, acute ischemic heart disease, atrial fibrillation, stroke, and peripheral arterial disease) were recorded. Total mortality and mortality associated with CV events were also registered. Overall survival was defined as the time from the moment of recruitment to the patient’s death.
Statistical analysisQuantitative variables were expressed as means and standard deviation, or median and interquartile range, according to whether data was normally distributed applying the Kolmogorov–Smirnov test. The categorical variables were expressed as percentages relative to the sample size, unless otherwise specified.
To perform the analysis of the primary objective, the series was divided into n 2 cohorts of selected cases separated by the cut-off point that determines a higher sensitivity (S) and specificity (E) in the ROC curve for total mortality according to the Youden index.
The 2 groups designed were compared using a Student’s t-test or Kruskal–Wallis, as indicated. A multiple regression linear model was also carried out to estimate those variables that were associated with a greater thickness of the adipose tissue defined in the EAT. Pearson or Spearman correlation tests were used to explore the relationship of adipose tissue with the different CV risk variables.
The influence of the defined variables, EAT and MAT, on global mortality and CV events was determined by applying proportional Cox univariate models. The Kaplan–Meier (KM) method and the Mantel–Cox method (log-rank test) were applied to compare the cohort survival curves defined by the best cut-off point of EAT.
The data were analyzed using the statistical package version SPSS 20.0 (SPSS Software, Chicago, IL, USA) and R version 3.5.2 (2018); a level of significance of the p < 0.05 was established.
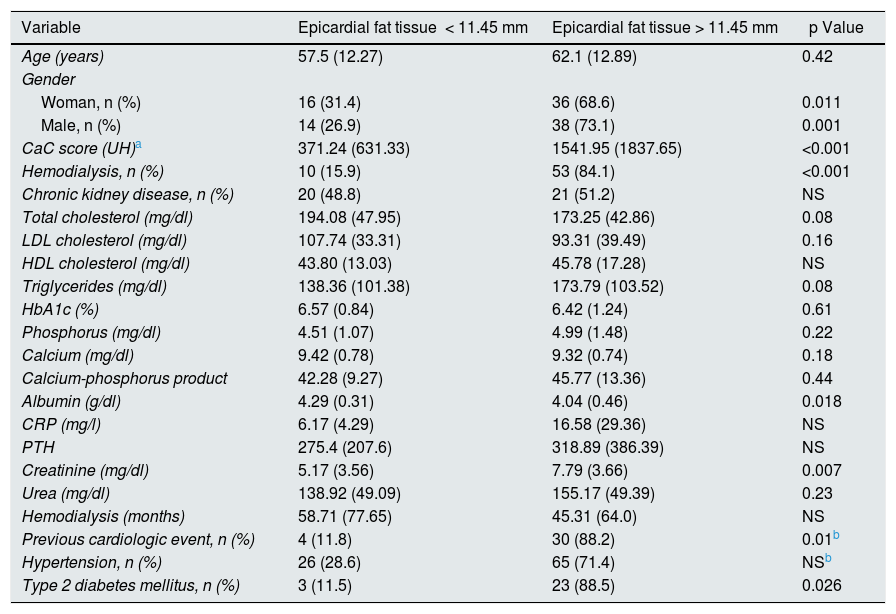
ResultsThe baseline characteristics of the series analyzed are listed in Table 1. There were 104 cases included, 63 patients were on hemodialysis and 41 patients had advanced CKD but not on renal replacement therapy (RRT); 50% of the cases were women.
Clinical characteristics and baseline biochemical parameters of the patients, separated in 2 groups, according to the thickness of the epicardial fat tissue (<11.45 mm vs. > 11.45 mm), applying non-parametric tests (except specified situations).
| Variable | Epicardial fat tissue < 11.45 mm | Epicardial fat tissue > 11.45 mm | p Value |
|---|---|---|---|
| Age (years) | 57.5 (12.27) | 62.1 (12.89) | 0.42 |
| Gender | |||
| Woman, n (%) | 16 (31.4) | 36 (68.6) | 0.011 |
| Male, n (%) | 14 (26.9) | 38 (73.1) | 0.001 |
| CaC score (UH)a | 371.24 (631.33) | 1541.95 (1837.65) | <0.001 |
| Hemodialysis, n (%) | 10 (15.9) | 53 (84.1) | <0.001 |
| Chronic kidney disease, n (%) | 20 (48.8) | 21 (51.2) | NS |
| Total cholesterol (mg/dl) | 194.08 (47.95) | 173.25 (42.86) | 0.08 |
| LDL cholesterol (mg/dl) | 107.74 (33.31) | 93.31 (39.49) | 0.16 |
| HDL cholesterol (mg/dl) | 43.80 (13.03) | 45.78 (17.28) | NS |
| Triglycerides (mg/dl) | 138.36 (101.38) | 173.79 (103.52) | 0.08 |
| HbA1c (%) | 6.57 (0.84) | 6.42 (1.24) | 0.61 |
| Phosphorus (mg/dl) | 4.51 (1.07) | 4.99 (1.48) | 0.22 |
| Calcium (mg/dl) | 9.42 (0.78) | 9.32 (0.74) | 0.18 |
| Calcium-phosphorus product | 42.28 (9.27) | 45.77 (13.36) | 0.44 |
| Albumin (g/dl) | 4.29 (0.31) | 4.04 (0.46) | 0.018 |
| CRP (mg/l) | 6.17 (4.29) | 16.58 (29.36) | NS |
| PTH | 275.4 (207.6) | 318.89 (386.39) | NS |
| Creatinine (mg/dl) | 5.17 (3.56) | 7.79 (3.66) | 0.007 |
| Urea (mg/dl) | 138.92 (49.09) | 155.17 (49.39) | 0.23 |
| Hemodialysis (months) | 58.71 (77.65) | 45.31 (64.0) | NS |
| Previous cardiologic event, n (%) | 4 (11.8) | 30 (88.2) | 0.01b |
| Hypertension, n (%) | 26 (28.6) | 65 (71.4) | NSb |
| Type 2 diabetes mellitus, n (%) | 3 (11.5) | 23 (88.5) | 0.026 |
All values are expressed as their mean (standard deviation), unless the percentage of individuals is specified.
CaC score: coronary artery calcification score; HbA1c: glycated hemoglobin; NS: not significant; CRP: C-reactive protein; PTH: parathyroid hormone; UH: Hounsfield units.
The EAT was greater in hemodialysis patients than with advanced CKD without RRT (17.9 mm [5.27] vs. 13.1 mm [3.98]; p < 0.001). The cases with type 2 DM had a greater amount of pericardial adipose tissue than those without type 2 DM; EAT (18.74 mm [6.16] vs. 15.16 mm [4.77]; p = 0.011) and MAT (59.67 mm [20,88] vs. 52.94 mm [32.65]; p = 0.018).
Using Youden index, the area under the curve (AUC) for EAT and total mortality was 0.76 (95% CI, 0.66−0.84); p < 0.001 (Fig. 1). The cut-off points for EAT to predict total mortality was 11.45 mm (S 92.86%; E 43.75%; positive predictive value [PPV] 65.82%; negative predictive value [NPV] 84% and precision 70.2%).

The AUC for MAT and total mortality was 0.6 (95% CI, 0.49−0.71); p = 0.08. The cut-off point of
MAT to predict total mortality was 55.6 mm (S 44.64%; E 83.33%. PPV 75.76%; NPV 56.34% and precision 62.5%).
The comparison of both AUC curves shows superiority EAT vs. MAT (Z = 2.44; p = 0.015).
Patients with a baseline EAT > 11.45 mm had lower serum albumin levels (4.04 g/dl [0.46] vs. 4.29 [0.31]; p = 0.018) and a higher CaC score (1,541.95 [1,837.65] vs. 371.24 [631.33]; p < 0.001). In this group with EAT > 11.45 mm there was also a higher prevalence of hypertension, type 2 DM, and a previous history of cardiological events. There were no significant differences in relation to age and gender between the two groups.
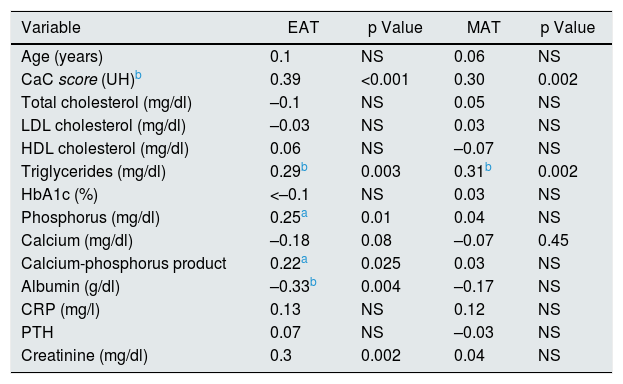
The variables that were positively correlated with EAT were: serum level of triglycerides, phosphate and phosphate-calcium product. Serum albumin was negatively correlated with EAT (Table 2). It was not found a correlation with other biochemical parameters. The cardiac history, arterial hypertension and type 2 DM were positively correlated with adipose tissue in the different territories. There was no significant correlation with age or time spent on hemodialysis.
Correlations (r) between epicardial fatty tissue (EAT) and mediastinal fatty tissue (MAT) with biochemical and clinical parameters, according to the Spearman (rho) test or Pearson's χ2, as indicated.
| Variable | EAT | p Value | MAT | p Value |
|---|---|---|---|---|
| Age (years) | 0.1 | NS | 0.06 | NS |
| CaC score (UH)b | 0.39 | <0.001 | 0.30 | 0.002 |
| Total cholesterol (mg/dl) | –0.1 | NS | 0.05 | NS |
| LDL cholesterol (mg/dl) | –0.03 | NS | 0.03 | NS |
| HDL cholesterol (mg/dl) | 0.06 | NS | –0.07 | NS |
| Triglycerides (mg/dl) | 0.29b | 0.003 | 0.31b | 0.002 |
| HbA1c (%) | <–0.1 | NS | 0.03 | NS |
| Phosphorus (mg/dl) | 0.25a | 0.01 | 0.04 | NS |
| Calcium (mg/dl) | –0.18 | 0.08 | –0.07 | 0.45 |
| Calcium-phosphorus product | 0.22a | 0.025 | 0.03 | NS |
| Albumin (g/dl) | –0.33b | 0.004 | –0.17 | NS |
| CRP (mg/l) | 0.13 | NS | 0.12 | NS |
| PTH | 0.07 | NS | –0.03 | NS |
| Creatinine (mg/dl) | 0.3 | 0.002 | 0.04 | NS |
P values shown only in significant correlations; in the rest, p value not significant.
CaC score: coronary artery calcification score; HbA1c: glycated hemoglobin; NS: not significant; CRP: C-reactive protein; PTH: parathyroid hormone.
Linear multiple regression model showed that the variables that could predict a greater EAT thickness were: albumin, CaC score, creatinine, type 2 DM and the previous cardiological event, p < 0.001; R2 = 0.37.
In addition, the fat tissue measured in different territories was positively correlated with the CaC score, and the correlation was higher with EAT (Fig. 2) than MAT (β = 0.39, p < 0.001 vs. β = 0.3, p < 0.002).
![Linear correlation between the EAT and the CaC score (Hounsfield units [HU]), according to Spearman, rho = 0.39; p < 0.001. CaC: coronary artery calcification; EAT: epicardial fatty tissue.](https://static.elsevier.es/multimedia/20132514/0000004100000002/v1_202106220601/S201325142100033X/v1_202106220601/en/main.assets/gr2.jpeg?xkr=ue/ImdikoIMrsJoerZ+w92lL8PRnKGMnsiVXV6EVJ5QRkjJZIKj2umwUyY+cL6K8cyMCoG0zLrx/ORKa7YTjKb8zGtEpNIMtsJ80ILpYctMy6fyJ4TNke2LEZHLcR/zXHmqGvhWLVw1zFg1gYmiq03Qu0o1ibwXNtLfB9g9rtoCFVEyEWIkvNIMiuCV0RMYekVcuxDB8ql3b9daCDp+KWCk+mbddnteNTY3J7JSpm8D5XC9Huf32MjSSZZVF5lQjbaD5W6AQMkAjprQ5IcMahBA6egCmEG50yOPNPA2zDrjZlPEG1DK8oeyu4xEBzxHq "Linear correlation between the EAT and the CaC score (Hounsfield units [HU]), according to Spearman, rho = 0.39; p < 0.001. CaC: coronary artery calcification; EAT: epicardial fatty tissue.")
During a follow-up period of 112.68 (95% CI 109.94–115.42) months, there were 56 deaths. Of these, 48 patients belonged to the group of highest EAT (>11.45 mm) and 8 patients the fat lower (<11, 45 mm) (χ2 12.25, p = 0.001). According to the KM analysis, patients with EAT thickness > 11.45 mm had higher mortality than those with lower thickness.
The median survival of patients with EAT < 11.45 mm was 97.48 months (95% CI, 81.46–113.51) vs. 76.65 months (95% CI, 66.28–91.47) in those with EAT > 11.45 mm; χ2 = 7.35, p = 0.007 (Fig. 3A).
 Kaplan–Meier survival curves. Fatal event-free survival according to the cutoff point of 11.45 mm for EAT. B) Mean survival free of non-fatal CV events and CV mortality for EAT, according to the cut-off point of 11.45 mm. CV: cardiovascular; EAT: epicardial fat tissue.")
There were 20 deaths due to CV causes, 16 patients had a thickness EAT > 11.45 mm. The mean survival for CV mortality was 109.11 months (95% CI, 95.59–122.64) for those with EAT thickness <11.45 mm and 104.57 months (95% CI, 94–113.8) for EAT > 11.45 mm (χ2 = 1.7, p = NS). There was a total of 53 incident CV events that required hospital admission (non-fatal events); 52.1% occurred in patients with EAT thickness > 11.45 mm vs. 47.9% with EAT < 11.45 mm (p = NS).
Analysis of KM for the composite of CV mortality and event was statistically significant (χ2 = 4.25, p = 0.039). While median survival free of any event was 105.04 months (95% CI, 91.1–118.97) for EAT thickness < 11.45 mm compared to 88.36 months (95% CI, 84.54–101.57) for EAT > 11.45 mm (Fig. 3B).
In the Cox univariate survival analysis, the presence of a thickness EAT > 11.45 mm was associated with an increased risk of overall mortality, HR 2.28 (95% CI, 1.03–5, 04), p = 0.042, and CV mortality HR 3.01 (95% CI, 0.87–10.44), p = 0.08.
Combined mortality according to CaC score and EATThe positive correlation observed between the CaC score and the EAT led us to explore whether both variables had statistical power for the group of patients who met the highest risk values for both: CaC score > 400 UH and EAT > 11.45 mm. Thus, using Cox univariate analysis, it was observed an increase in total and CV mortality with HR values of 2.11 (95% CI, 1.18–3.79), p = 0.012, and HR 4.4 (95 % CI, 1.09–17.8), p = 0.038, respectively.
Also, the survival analysis shows that nonfatal CV event free mean survival and mean CV mortality (combined) were significant χ2 = 29.16, p < 0.001 for the non-affected group (score CaC < 400 UH and EAT < 11.45 mm: 112.41 months [95% CI, 103.68–121.14) compared to the group with the affected patients (score CaC > 400 UH and EAT > 11.45 mm): 76.09 months (95% CI, 64.22–87.95) (Appendix supplemental B material, annex, Supplementary Fig. 1A).
In the case of total mortality, it remains to be statistically significant (χ2 = 18.97, p < 0.001), with survivals for the unaffected group 96.3 months (95% CI, 84.63–107.97), compared to the lower survival rate of the affected group: 69.19 months (95% CI, 57.9–80.49) (Appendix B supplementary material, annex, Supplementary Fig. 1B).
Mortality, CV event and MATThe total number of deceased patients with a mediastinal thickness greater than 55.6 mm reached 23.08%. According to the Kaplan–Meier analysis, patients with a total thickness of MAT > 55.6 mm had a higher mortality than those with less MAT thickness (χ2 = 5.85, p = 0.016) (Appendix Supplementary material, annex, (Fig. 2S-A) This was not the case with mortality and CV events combined (Appendix B Supplementary material, annex, Supplementary Fig. 2).
DiscussionVarious studies in the general population suggest an association between EAT and metabolic syndrome,8,27 insulin resistance, adiponectin28 and biochemical parameters of inflammation.6,8,10
As in other studies, in our series we found that patients with DM and CKD had a higher pericardial fat deposit in all the territories measured compared to patients without DM.19,29
In the univariate analysis, we found a negative correlation between serum albumin level and total EAT thickness. Hypoalbuminemia is a component of the inflammation-malnutrition complex, which, in turn, is involved in the etiopathogenesis of CV disease and vascular calcification in patients with advanced CKD and on hemodialysis, which could indicate a possible association between EAT and the inflammation-malnutrition complex observed in these patients.2,30
Regarding the lipid profile, triglyceride levels could be related to the total thickness of EAT and MAT, but not in the case of total cholesterol. It is important to highlight that in advanced CKD and in hemodialysis the lipid profile different from that of the general population. The total concentration of cholesterol is not as important, as its atherogenic capacity and its density.31
The EAT was positively correlated with the levels of phosphorus, the phospho-calcium product and the CaC score. Vascular calcification is very prevalent in advanced CKD. The main pathogenic factors involved in the generation of vascular calcifications are imbalance in phosphorus and calcium metabolism and chronic inflammation. Hyperphosphatemia and an elevated phospho-calcium product are associated with an increase in mortality and vascular calcification in patients with renal replacement therapy.2,32 In addition, CaC is more severe and progresses more rapidly in patients with advanced CKD and has been associated with the development of CV events and mortality.33,34
However, the MAT did not correlate with any biochemical parameter of bone mineral metabolism and its association with the CaC score was less intense with the EAT. This result would support the hypothesis that MAT is related to components of the metabolic syndrome5,10 and that EAT is mainly related with the development of atherosclerosis and CaC.16,17,28,35 A possible explanation could be the proximity of the EAT with the coronary arteries, which may facilitate a local paracrine inflammatory effect on the coronary endothelium.16,28
In the general population, EAT has been associated with fatal and non-fatal coronary events.4,36 The quantification of EAT could be a predictor of CV risk in patients with CKD or on hemodialysis, but there are few studies in this regard.12,20,23 In our series, those patients with greater total thickness of EAT and TMA had a higher mortality and a shorter survival free of non-fatal CV events and CV mortality.12,23,37 More prospective studies would be needed to assess whether the EAT measurement adds any advantage to the CaC score as predictor of mortality, CV risk, and a marker of CAD.
Our study has some limitations. It is a post hoc study, so the results must be considered preliminary and cause-effect relationships cannot be established. There is not a control group available. The sample size is relatively small, so the statistical power is limited and we cannot rule out an association of EAT with other CV risk factors. Lastly, our study is carried out with prevalent hemodialysis patients, and it is well known that the length of stay in renal replacement therapy is associated with an increase in mortality.38 In this sense, having been able to include a sample of incident patients on hemodialysis could have avoided a possible selection bias.
ConclusionsChronic inflammation and vascular calcification are the main mechanisms involved in the high morbidity and mortality of CKD, being important to obtain markers that allow an early diagnosis of a high CV risk. In patients with advanced CKD or hemodialysis, in addition to the CaC score, the quantification of EAT and TMA by MSCT could be used as a CV prognostic tool.
FinancingThe present study has not received any grant, funding or financial support. Availability of data and materials. The data sets used and/or analyzed during the present study are available from the corresponding author. Its availability to third parties will be considered according to current legislation, anonymously, and under individual requests from researchers or working groups.
Ethics approval and consent to participateThe research has been approved by the local ethics committee of the ‘Príncipe de Asturias’ University Hospital (dated December 1, 2004). All participants have signed a consent form specifically designed for current study.
Conflict of interestsThe authors declare that they have no conflict of interest.
Key concepts- ‐
Epicardial fatty tissue is an emerging cardiovascular risk factor.
- ‐
In the general population, epicardial fatty tissue has been associated with metabolic syndrome, diabetes mellitus, and coronary artery disease.
- ‐
Epicardial fat tissue could also be a predictor of cardiovascular risk and mortality in patients with advanced chronic kidney disease.
- ‐
Quantification of epicardial fat tissue by multislice synchronized computed tomography could be an additional prognostic tool to estimate cardiovascular risk in this population with advanced chronic kidney disease.
The following is Supplementary data to this article:
Please cite this article as: Cano Megías M, Guisado Vasco P, Bouarich H, Lara Aguilera I, de Arriba-de la Fuente G, Rodríguez-Puyol D. Tejido graso epicárdico, calcificación arterial coronaria y mortalidad en pacientes con enfermedad renal crónica avanzada y hemodiálisis. Nefrologia. 2021;41:174–181.


