Introducción: Las proteínas presentan una eliminación variable a lo largo del día; por ello clásicamente se ha considerado la proteinuria de 24 horas como el método de referencia para su cuantificación. Dada la dificultad de la recogida de la muestra, aparece el cociente proteína/creatinina (P/C) en orina esporádica como herramienta diagnóstica. Objetivo: El objetivo de este estudio es evaluar la correlación entre la medida de proteinuria de 24 horas y el P/C, comparando muestras recogidas de forma consecutiva en pacientes del Hospital del Mar durante el último año. Métodos: Estudio observacional transversal en una muestra de 159 determinaciones analíticas del Servicio de Nefrología. Valoración de la correlación entre proteinuria de 24 horas y P/C según diferentes grados de proteinuria mediante el coeficiente de correlación intraclases (CCI) y el coeficiente de correlación de Spearman (CCS). Resultados: Se observó una correlación directa y estadísticamente significativa entre proteinuria/24 horas y P/C en todo el grupo estudiado (CCS: r = 0,91, p < 0,001). Las correlaciones según diferentes grados de proteinuria/24 horas fueron: < 300 mg (CCS: r = 0,498, p < 0,001; CCI: 0,46), 300-3499 mg (CCS: r = 0,828, p < 0,001; CCI: 0,66) y ≥ 3500 mg (CCS: r = 0,181, p = NS; CCI: 0,18). Conclusión: El cociente P/C presenta una buena correlación con valores de proteinuria/24 horas entre 300-3499 mg. Dicha correlación se mantiene, pero con menor intensidad, en < 300 mg. En el grupo estudiado, el cociente P/C en orina esporádica no se correlaciona con la proteinuria/24 horas en rango nefrótico.
Introduction: Measurement of the protein content in a 24-hour urine sample is the definitive method of establishing the presence of abnormal proteinuria. However, the urine collection is cumbersome. The spot urine protein to creatinine ratio seems to be a reliable diagnostic tool for urine protein measurement. Objective: Our aim was to evaluate the spot urine protein/creatinine ratio against 24-h urine total protein excretion in different proteinuria ranges by comparing samples collected simultaneously in patients of Hospital del Mar during the last year. Material and method: Observational, cross-sectional study of 159 consecutive paired determinations of 24-h urine total protein excretion and the spot urine protein/creatinine ratio (P/C) in renal patients. The strength of the correlation was determined by calculating the intraclass correlation coefficient (ICC) and the Spearman correlation coefficient (SCC). Results: Among all groups, there was a significant correlation between 24-hour proteinuria and the P/C ratio (SCC: r=0.91, P<0.001). The correlation in different levels of proteinuria were: <300mg (SCC: r=0.498, P<0.001; ICC: 0.46), 300-3499mg (SCC: r=0.828, P<0.001; ICC: 0.66) and ≥3500mg (SCC: r=0.181, P=NS; ICC: 0.18). Conclusions: In summary, a strong correlation was observed between spot urine protein/creatinine ratio and 24-h urine total protein excretion in proteinuria levels from 300mg/day to 3499mg/day. A lower correlation was also maintained in 24-h urine total protein <300mg. In our experience, there is no relevant correlation between spot urine protein/creatinine ratio and 24-h urine total protein excretion in nephrotic-range proteinuria.
INTRODUCTION
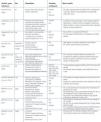
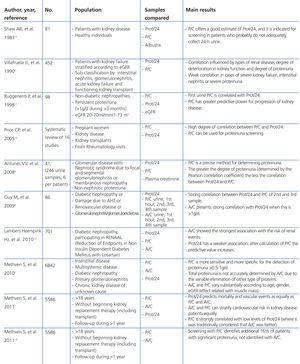
Protein excretion varies in the course of the day; for this reason 24-hour proteinuria (Prot/24) has been considered as the classic reference method for protein determination.1 The collection of urine for 24 hours is tedious, and errors may occur during the process. For this reason, the protein/creatinine ratio (P/C) in spot urine was developed as a diagnostic alterative.1-3 Spot urine is collected during the second urination of the morning, and the first 20-25ml are discarded. After this, without disrupting urination, the middle urine is collected in the receptacle, and the last portion is also discarded.4 The potential error in determining proteins in a spot urine sample as a result of daily variation does not exceed the error in collecting a 24-hour urine sample.5 Although the correlation between P/C ratio and Prot/24 has been established, previous studies suggest that this correlation varies in accordance with different levels of proteinuria.4,6-8 Some of the most important studies are included in Table 1, with comments below in the Discussion section.
The aim of our study was to clarify whether the P/C ratio in spot urine, a sample easy to obtain and handle, is correlated with Prot/24 in samples collected consecutively from patients at our hospital.
METHODS
Patients
Prospective observational study between October 2010 and March 2011. A total of 159 patients over 18 years of age with different degrees of kidney failure. Proteinuria was determined in all patients as part of their examinations or clinical study. The study of Prot/24 and P/C ratio was undertaken simultaneously. All patients were recruited at an outpatient clinic or during an in-patient stay in the Nephrology Department of Hospital del Mar.
Method for determining proteinuria and creatinine
The patients were given instructions to collect urine for 24h and spot urine. After discarding the first urine of the day (which was included in the 24-hour urine sample), 3-5ml of urine were collected in the second sample for calculating the P/C ratio, which was calculated by dividing the proteinuria (mg/dl) of urine creatinine (g/dl). The 24-hour proteinuria was expressed in milligrams.
The creatinine concentration in urine was determined by Jaffé’s method for colorimetric and kinetic determination of creatinine, and the protein concentration in urine by the turbidimetric method, using in both cases an Auto Analyzer Hitachi Modular DPP (Roche).
Statistical analysis
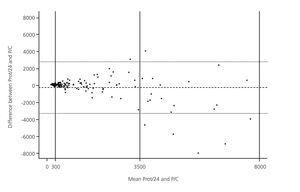
The quantitative variables were expressed as mean and standard deviation, and the qualitative variables as percentages. For the analysis of correlation between Prot/24 and the P/C ratio, the Spearman correlation coefficient was calculated (SCC). The analysis of diagnostic concordance was performed using the intraclass correlation coefficient (ICC) between the values of urinary proteinuria obtained using Prot/24 and P/C ratio on the same patient. The degree of concordance between both measurements was also analysed using the Bland and Altman method.9
The statistical analysis of the data was performed with the program SPSS version 18.0 for Windows. Statistically significance was considered whan P<0.05.
RESULTS
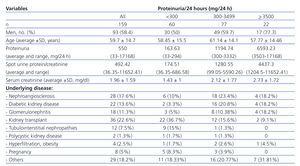
The basic characteristics of the study population are shown in Table 2, both for the total population and for the population stratified according to degrees of Prot/24. Statistically significant differences were not observed in age and distribution by sexes among the 3 subgroups. The kidney function measured by serum creatinine was worse the degree of proteinuria was greater. The underlying kidney disease of the 159 patients is detailed in Table 2.
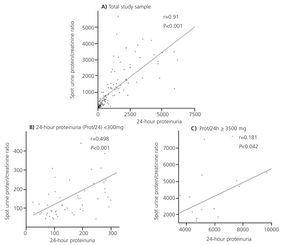
As shown in Table 3, a direct and statistically significant correlation was observed between Prot/24 and P/C in the whole group studied (n=159): with an ICC of 0.756 (confidence interval [CI] 95%, 0.680-0.816) and a SCC of r=0.91 (P<0.05) (Figure 1A). After stratifying by degrees of proteinuria, the correlation between Prot/24 and P/C ratio was maintained in the proteinuria lower than 3 500mg/24 hours, but this correlation was not observed in Prot/24 in the nephrotic range. In the Prot/24 range lower than 300mg/24hours, the correlation with P/C was maintained, although it was of lesser intensity, with an ICC of 0.456 (CI 95%, 0.230-0.635) and SCC of r=0.498 (P<0.001) (Figure 1B). The patients with Prot/24 hours of 300-3 449 showed a very good correlation with P/C, with ICC of 0.656 (CI 95%, 0.508-0.766) and SCC with r=0.828 (P<0.001). In patients with proteinuria in the nephrotic range, with Prot/24 ≥3 500mg/24h, no correlation was observed with the P/C, (CI 95%, -0.041-0.650) and a SCC of r=0.181 (P= not significant [NS]) (Figure 1C).
As shown in Table 4, when stratifying according to the degree of kidney failure determined by estimated glomerular filtration rate (eGFR) calculated by the MDRD method in 3 subgroups (>60, 30-59 and <30ml/min/1.73 m2), we did not observe differences between Prot/24–P/C correlations calculated for each sub-group.
The degree of concordance between both measurements calculated using the Bland and Altman method9 (Figure 2) showed that for proteinuria levels in the lower ranges the concordance was good, while for higher ranges the concordance practically disappeared.
DISCUSSION
Our study demonstrated that the P/C ratio has a strong correlation with the Prot/24 for values lower than 3500mg; nevertheless, we did not observe a correlation for proteinuria in the nephrotic range. Hence, in the group studied at our hospital, as the degree of Prot/24 increases, the degree of correlation both using the ICC and the SCC analyses decreases.
The adequate detection and quantification of proteinuria is of great importance in the management of patients with kidney disease. The collection of 24h urine is complicated, and it is not always performed correctly; an easy and reliable method is the once-only collection of urine for the measurement of the P/C ratio. Different studies have analysed the correlation between Prot/24 and the P/C ratio in spot urine.1,2,4-6,10-12,15 Our observational study confirmed the results obtained in other cross-sectional, observational studies, supporting the use of the P/C ratio in clinical practice due to the simplicity of collecting the sample and its low cost for Prot/24 lower than 3500mg.3,4,6,7,11,12
The usefulness of this ratio for proteinuria within the nephrotic range has been studied previously, but this was not the main objective of our study. In our population, for proteinuria in the nephrotic range we did not observe a correlation between the P/C ratio and Prot/24. In this respect, Antunes et al. have also demonstrated that, the greater the proteinuria, the lesser the correlation and adjustment between the different methods.4 Using the Bland and Altman method, it was observed that as the Prot/24 closest to the nephrotic range proteinuria, there is less concordance between the methods (Figure 2).
Ruggenenti et al.11, in their study designed to compare different factors for predicting the risk of progression of kidney failure in non-diabetic patients, observed a correlation between P/C and Prot/24 in all degrees of proteinuria, which decreased as the P/C increased. However, they did not define the degree of proteinuria in which the differences appeared. Their study concluded that the P/C ratio predicted the risk of progression of kidney failure with more precision than the Prot/24. In patients with primary glomerulopathies, Morales et al. also detected this decrease in correlation, and they defined the best cut-off point for determining nephrotic range as P/C≥3.5 (considering the Prot/24 as standard reference). These authors found good correlation and agreement between P/C and Prot/24 for all renal function levels, but demonstrated more marked differences as urinary protein excretion increased.5 In our study, when stratifying by kidney function calculated using MDRD-4, both determinations presented a very strong correlation with the different models divided into three tertiles (≥60, 59-30 and <30ml/min/1.73 m2). Nevertheless, Methyen et al., in a sub-analysis focused on studying the capacity of P/C ratio and albumin/creatinine ratio in urine for proteinuria of 1000mg/24 hours, demonstrated that the technical differences varied substantially according to age, gender and the eGFR, an effect that they related directly with the muscle mass.2
Some of the current clinical practice guidelines such as the KDOQI,16 CARI,17 KDIGO,18 UK Renal Association,19 NICE,20 and CSN21 define the presence of proteinuria according to the P/C ratio (different value according to the Scientific Society). On the other hand, other guidelines such as the SEN-semFYC22 and the ADA23 define the appearance of proteinuria according to the urine albumin/creatinine ratio. Recently, a consensus document was published on the evaluation of proteinuria in the diagnosis and follow-up of chronic kidney disease patients that determined that in the detection and monitoring of proteinuria or albuminuria, it was not necessary to collect 24h urine.24 In our study, given the difficulty of finding uniformity in the different guidelines and scientific societies for the initial determination of P/C or urine albumin/creatinine, we focused on the analysis of the P/C ratio. Nevertheless, in patients with suspicion of incipient diabetic nephropathy, just as the guidelines unanimously recommend, we advise the determination of albumin, expressed as albumin/creatine in urine, once a year.
This study focused on determining the correlation between the P/C ratio in spot urine and the Protr/24 and showed an acceptable correlation when Prot/24 values are less than 3500mg. Hence, the simplification of the collection and subsequent calculation of the ratio in patients with proteinuria within that range could result in lower health care costs. Studies focused on analysing the save in health care costs by substituting the Prot/24 for the P/C could be of great use in the future.
Our study had a series of limitations: the main limitation is the need to increase the number of patients studied, since it was too small, specifically in the sub-group of patients who showed proteinuria within the nephrotic range. Another limitation is that no cause of kidney disease was excluded, including also a sample of patients with kidney transplants and pre-eclampsia patients. Increasing the number of samples collected and perhaps stratifying by underlying kidney pathology would help acquire a better knowledge of the correlation between the two techniques studied.
In conclusion, our study shows that the P/C ratio in spot urine is useful for Prot/24 less than 3500mg. The usefulness of measuring this parameter in cases with proteinuria within the nephrotic range is yet to be confirmed. In the same manner, future studies focused on monitoring patients with proteinuria within the nephrotic range can be useful for evaluating the efficiency of the P/C ratio in detecting complete or partial remission of proteinuria during the monitoring of the underlying renal disease.
Acknowledgments
The authors wish to record their gratitude to Sergi Mojal of the Fundació IMIM for the aid received in performing the statistical studies.
Conflicts of interest
The authors affirm that they have no conflicts of interest related to the content of this article.
Table 1. Main studies comparing 24-hour proteinuria with protein/creatinine ratio in spot urine
Table 2. Characteristics of patients undergoing proteinuria determinations
Table 3. Intraclass correlation coefficient and Spearman correlation coefficient between the values for 24-hour proteinuria and the protein/creatinine ratio in sporadic urine
Table 4. Intraclass correlation coefficient and Spearman correlation coefficient between the values for 24-hour proteinuria and the protein/creatinine ratio in spot urine according to estimated glomerular filtration rate
Figure 1. Correlation between the protein/creatinine ratio in sporadic urine and 24-hour proteinuria
Figure 2. Bland and Altman plot showing concordance between 24-hour proteinuria and the protein/creatinine ratio in sporadic urine


