Antecedentes: Los trastornos del metabolismo óseo en pacientes en hemodiálisis (HD) implican varios factores humorales, de los cuales la función central recae sobre la hormona paratiroidea. Cuando hay insuficiencia renal normalmente se detectan niveles elevados de leptina y su relación con el metabolismo óseo está aún por esclarecer. Investigamos la densidad mineral ósea (DMO) y el metabolismo óseo en relación con la hormona paratiroidea sérica, el 25(OH)D3 y la leptina en pacientes en HD. Métodos: Medimos la fosfatasa alcalina ósea (FAO), el telopéptido N, la hormona paratiroidea, el 25(OH)D3 y la leptina en 37 pacientes en HD. Asimismo, evaluamos el IMC y la DMO en la columna lumbar (CL) y en el cuello femoral (CF) mediante DXA. Las evaluaciones estadísticas se basaron en análisis de regresión simples. Entrecruzamiento del telopéptido N del colágeno óseo tipo I. Resultados: 1) De nuestros pacientes, el 32,1% presentaba osteopenia en CL y 50% en CF y el 14,3% y el 21,4% osteoporosis, respectivamente. El puntaje Z en CL o CF no estaba relacionado con la duración de la HD. 2) Los marcadores óseos, la hormona paratiroidea, y los niveles de fósforo y leptina se vieron incrementados. 3) El 25(OH)D3 era bajo y no estaba relacionado con el telopéptido N, la FAO o la hormona paratiroidea. 4) La hormona paratiroidea estaba correlacionada con los marcadores óseos y con el puntaje Z en CL y CF. 5) La leptina no presentaba correlación con los marcadores óseos o con el puntaje Z (con excepción del IMC). Conclusiones: En nuestros pacientes en hemodiálisis, los marcadores del metabolismo óseo se vieron incrementados en relación con los niveles elevados de hormona paratiroidea sérica. La elevada leptina sérica observada no estaba asociada al metabolismo óseo. Además, la duración de la hemodiálisis no pareció afectar a la densidad ósea.
Background: Bone metabolism disorders in hemodialysed patients (HD) involve several humoral factors, of which PTH plays the central role. Leptin is usually found increased in renal failure and its link with bone metabolism has not been elucidated. We investigated the BMD and bone metabolism in association with serum PTH, 25OHD3 and leptin in HD patients. Methods: We measured bone alkaline phosphatase (bSAP), cross linked N telopeptide of type 1 collagen (NTx), PTH, 25OHD3 and leptin in 37 HD patients. We also evaluated BMI and BMD in lumbar spine (LS) and in femoral neck (FN) by DXA. Statistical evaluations were based on simple regression analysis. Results: 1) Osteopenia was found in 32,1% in LS and 50% in FN and osteoporosis in 14.3% and 21.4% of our patients, respectively. LS or FN Z score was not related to HD duration. 2) Bone markers, PTH, phosphorus and leptin levels were increased. 3) 25OHD3 was low and was not related to NTx, bSAP or PTH. 4) PTH correlated with bone markers and Z score in LS and FN. 5) Leptin had no correlation with bone markers or Z score (except BMI). Conclusions: In our hemodialysed patients bone metabolism markers were increased in relation with high serum PTH levels. The observed high serum leptin was not associated with bone metabolism. Additionally the duration of hemodialysis did not appear to affect bone density.
INTRODUCTION
Chronic renal failure is almost always associated with alterations in mineral and bone metabolism1,2. With the starting of haemodialysis (HD), histological signs of secondary hyperparathyroidism can be seen in bones in over 50% of patients3. In end stage renal disease (ESRD) patients, skeletal abnormalities known as Chronic Kidney Disease-Mineral and Bone Disorder (CKD-MBD) (the so called renal osteodystrophy) include several types of bone tissue lesions, such as the most prevalent high bone turn over disease but also the adynamic bone disease4,5. Other less frequent bone diseases such as osteomalacia, aluminum-related bone disease, fluorosis, strontium overload or mixed types have also been described3.
It is well known that bone mineral density (BMD) is reduced in patients with chronic renal failure and they are at higher fracture risk6,7. Uremic patients usually exhibit high plasma intact PTH and high serum concentration of biochemical markers of bone metabolism such as bone specific alkaline phosphatase (bSAP) and collagen breakdown products8. Some studies showed low 25OHD3 levels in uremic patients, which is probably implicated in CKD-MBD9.
Leptin, a hormone produced by fat tissue, decreases appetite and increases basal metabolic rate. Besides that, leptin induces in vitro stem cells differentiation to osteoblasts and reduces osteoclastogenesis, also having an in vivo positive effect on bone mass in mice10-13. Intracerebroventricular administration of leptin in wild or ob/ob leptin deficient mice resulted in bone loss14. In renal failure serum leptin levels are increased, as leptin is cleared by the kidneys15. In ESRD patients, in particular, the blood purification modality appears to affect leptin concentrations16. This fact might contribute to the development of CKD-MBD17-19.
The aim of current study is to investigate, the bone mass density and the bone metabolism in hemodialysed patients as estimated by serum markers of bone metabolism (bSAP and NTx) and to correlate with serum Ca, P, PTH, 25OHD3 and leptin.
SUBJECTS AND METHODS
Patients
Thirty seven patients, 18 postmenopausal female and 19 male, on maintenance HD were included in the present study after their informed consent. The study was performed during the period April-May. Females were 43-73 years old, mean age 56.7 years and were on HD for 6-222 months with mean HD duration 68.1 months. Males were 41-79 years old, mean age 58 years and were on HD for 24-207 months with mean HD duration 67.1 months. All the patients were treated by conventional HD 4-5 hours, three times a week. None of the patients had a past history of parathyroidectomy or renal transplantation, of fracture or radiographic evidence of vertebral, rib or hip fracture. At the moment of the evaluation none of the patients, in particular the postmenopausal women, was receiving or had received previous to the study, oestrogen or raloxifene, calcitonin, bisphosphonates, PTH or corticosteroids. Thirteen patients received an active vitamin D derivative (one alpha) orally. None of the patients received vitamin K or aluminum hydroxide. There was no clinical or biological evidence for other bone disease such as osteomalacia or Paget’s disease. All patients were measured for BMD at lumbar spine and at femoral neck and for body weight and height and their body mass index (BMI) was calculated.
Biochemistry
Pre-midweek dialysis blood sampling was collected in the morning from the arteriovenus fistula after a 12h fast. The serum obtained after centrifugation was stored in aliquots at -20 oC until assayed, with measurements made immediately after thawing. Serum calcium, phosphorus, total protein, albumin, urea, creatinine, magnesium and total alkaline phosphatase were determined routinely using an automatic analyzer. Serum bSAP was measured by ELISA (Metra BAP EIA, sensitivity 0.7 U/l, intra-assay variation 5.8%, inter-assay variation 5.2%) and serum NTx was also measured by ELISA (Wampole Laboratories, USA, intra-assay variation 4.6%, inter-assay variation 6.9%). Serum bioactive PTH and 25OHD3 were measured by chemiluminescence’s assay (Nichols advantage, functional sensitivity ≤4 ng/ml, CV 20% for bioactive PTH and functional sensitivity ≤7 ng/ml, CV 20% for 25OHD3). Serum leptin was measured by RIA (Linco Research, sensitivity 0.5 ng/ml, intra-assay variation 4.6%, inter-assay variation 5%).
Bone mineral density
Bone mineral density (BMD) of the lumbar spine, total hip, femoral neck and trochanter were measured using Lunar DPX-L densitometer (Lunar, Madison, Wis, USA). All BMD measurements were performed by the same experienced operator. The densitometer was calibrated everyday with a standard phantom specimen. BMD results were obtained in absolute values (g/cm2), in T score and in Z score. T score is the number of standard deviations from the mean of a healthy young adult population (20-40 years old) and is used to determine osteoporosis or osteopenia. Zscore is the number of standard deviations from the mean of a healthy age- and gender-matched normal population, which allows the comparison of BMD between patients of different age and gender. Osteoporosis was defined as a BMD T score at any site less than -2,5 and osteopenia as a BMD Tscore between -1 and –2,5. The reference values were obtained from an Italian normal population, similar to Greek normal population, provided by Lunar.
Statistical analysis
All results are shown as means ± SD, unless otherwise indicated. Correlations between variables were assessed using simple linear regression and p <0.05 was accepted as statistically significant. Comparison of categorical variables was performed using chi-square analyses.
RESULTS
Demographic and biochemical data
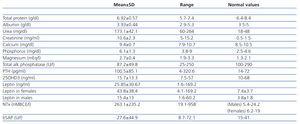
Table 1 depicts the demographic data for the 18 female patients and table 2 for the 19 male patients. Table 3 depicts the biochemical data for all 37 patients.
Bone densinometric data
The prevalence of osteoporosis (T score <-2.5) at lumbar spine and femoral neck was 14.3% and 21.4% respectively. The prevalence of osteopenia (T score between –1 and –2.5) at the same sites was 32.1% and 50% respectively. Lumbar spine Z score (m ± SD) was -0.09 ± 1.69 and femoral neck Z- score was –0.76 ± 1.14.
Bone markers, PTH, 25OHD3 and leptin
Serum levels of bone markers (NTx and bSAP) were very high (table 3). Serum PTH and phosphorus levels were also high as expected. Serum 25OHD3 levels were low and the prevalence of vitamin D deficiency was 89.2% among patients. Only 4 patients had normal 25OHD3 levels. Serum leptin was increased particularly in women (table 3).
Correlation of BMD with PTH, leptin, duration of hemodialysis, body weight and BMI
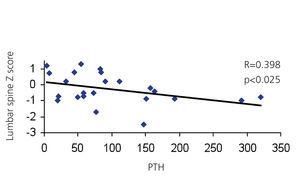
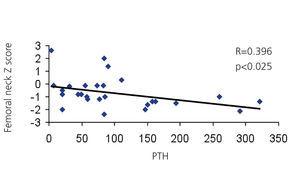
Lumbar spine and femoral neck Z-score correlated significantly in a negative manner with serum PTH (p <0.025) (figure 1, figure 2). Lumbar spine and femoral neck Z-score was not related with serum leptin or with the duration of hemodialysis. We found that 10% of lumbar spine Z-score and 22.9% of femoral neck Z-score variability is due to serum PTH levels. No correlation was found between body weight or BMI and Z-score at any site.
Correlation of PTH with bone markers, 25OHD3 and leptin
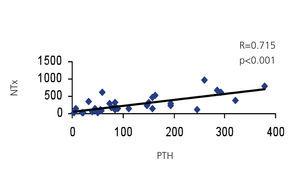
Serum PTH correlated significantly in a positive manner with serum NTx and bSAP (R = 0.715; p <0.001 and R = 0.690; p <0.001 respectively) (figure 3, figure 4). We found that 50% of serum NTx and bSAP variability is due to PTH levels. No correlation was found between serum PTH and 25OHD3 or leptin levels.
Correlation of 25OHD3 with bone markers and leptin
No correlation was found between 25OHD3, bone markers (NTx and bSAP) or leptin levels.
Correlation of leptin with bone markers, BMI, body weight, age and duration of hemodialysis
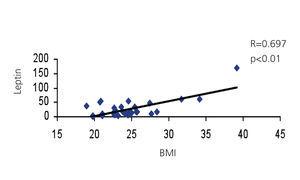
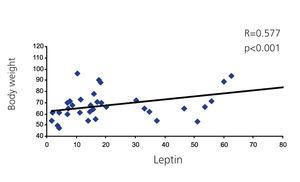
Serum leptin was not correlated with bone markers (NTx and bSAP). As expected, serum leptin levels were positively correlated with BMI (R = 0.697; p <0.001) and with body weight (R = 0.577; p <0.001) (figure 5, figure 6). We also found that 48.5% of serum leptin variability is due to BMI. Leptin levels had no correlation with age or hemodialysis duration. Serum leptin had a positive correlation with serum creatinine (R = 0.419; p = 0.012).
DISCUSSION
The data on the effect of hemodialysis in end stage renal disease patients on bone density are limited. To date most of the work has been focused on predialysis, HD and kidney transplanted patients and scarce information is available for patients on peritoneal dialysis, haemofiltration and haemodialfiltration20-23. The prevalence of osteoporosis in hemodialysed patients is quite variable and depends on several factors including the method used for BMD measurement, the skeletal site and patients’ characteristics. Nonetheless, most of the studies showed reduced BMD in HD patients, which appears to be more pronounced than in peritoneal dialysis patients24. The prevalence of osteoporosis in HD patients has been estimated to be 13-29% at lumbar spine4,5,24 and 16-19% at femoral neck4. Our findings are in accordance with these studies. Additionally, we found a high prevalence of osteopenia particularly at femoral neck. In CKD-MBD bone loss is site specific and in patients with uremic hyperparathyroidism, PTH has a preferential effect on cortical bone25,26.
It has been reported that serum NTx is significantly higher in HD patients than in healthy individuals27 and appears to be the most reliable and useful bone resorption marker in renal osteodystrophy28. In the present study we found extremely high levels of serum NTx and a significant positive correlation between serum NTx and PTH which is in line with previous published results27,28.
The clearance of bSAP is not performed by the kidney and serum bSAP concentration is therefore not affected by renal function. In our study a number of patients exhibited slightly increased serum bSAP. The significant positive correlation between serum bSAP and NTx with PTH probably suggests that the increased bone turnover is due to secondary hyperparathyroidism.
Plasma 25OHD3 levels are often abnormally low in normal population, particularly in the elderly29 and in unselected medical inpatients30, as well as in HD patients31. In our cohort of patients there was also a high prevalence of vitamin D deficiency. Ghazali A et al in their study found that low plasma 25OHD3 appears to be a major risk factor for hyperparathyroidism and Looser’s zones independent of calcitriol levels9. Interestingly, and in contrast, we found no correlation between 25OHD3 and PTH or bone markers.
Leptin, an adipocyte-derived hormone, is cleared by the kidney, and thus, plasma leptin levels are elevated in HD patients17. We also found increased serum leptin levels in our HD patients, particularly in women, which is in accordance with previous studies. It has been reported that there is a link between leptin and bone metabolism in vitro and in vivo experiments10-12. Furthermore some studies in humans have shown a positive relationship between leptin and bone parameters32-34, while others have not35-37. In our study simple regression analysis showed no correlation between serum leptin and Z-score at lumbar spine and femoral neck. Similarly, no correlation was found between leptin and bone markers (NTx and bSAP). Serum leptin showed a significant positive correlation only with BMI and body weight as expected.
In conclusion the prevalence of osteoporosis/osteopenia is increased in HD patients and bone mineral density appears to correlate with high serum levels of bioactive PTH but not with 25OH vitamin D or high serum leptin. Interestingly, the duration of hemodialysis does not appear to affect bone density. The impact of leptin on bone metabolism in HD patients remains to be elucidated with further studies.
Conflict of interest
The authors declare they have no potential conflicts of interest related to the contents of this article.
Table 1. Demographic data in 18 female patients
Table 2. Demographic data in 19 male patients
Table 3. Biochemical data in all patients
Figure 1. Lumbar spine Z score vs PTH.
Figure 2. Femoral neck Z score vs PTH.
Figure 3. PTH vs NTx.
Figure 4. PTH vs bSAP.
Figure 5. Leptin vs BMI.
Figure 6. Leptin vs Body Weight.


