


The modern diet is closely linked to the consumption of processed foods, causing an increase in the intake of salt, simple sugars, phosphorus and added potassium. This excess intake is associated with an increased risk of obesity, diabetes, hypertension and chronic kidney disease (CKD). CKD, which according to data from the ENRICA study affects 15% of the population, magnifies its impact due to the higher prevalence of diabetes and hypertension and due to limitations in the management of sodium and phosphorus. The intake of these products far exceeds the established recommendations, assuming 72% of total sodium, 25%–35% of phosphorus, 12%–18% of potassium and exceeding 10% of the caloric intake in simple sugars. Measures are necessary to reduce their contribution through nutritional advice, labeling review, education campaigns on healthy habits, fees and institutional actions that involve food safety agencies, industry, distribution and scientific societies.
La alimentación moderna está estrechamente vinculada al consumo de alimentos procesados, originando un aumento en la ingesta de sal, azúcares simples, fósforo y potasio añadidos. Este aporte excesivo se asocia a un mayor riesgo de obesidad, diabetes, hipertensión y enfermedad renal crónica (ERC). La ERC, que según datos del estudio ENRICA afecta al 15% de la población, magnifica su repercusión por la mayor prevalencia de diabetes e hipertensión y por las limitaciones en el manejo del sodio y fósforo. La ingesta de estos productos supera ampliamente las recomendaciones establecidas, suponiendo un 72% del sodio total, un 25%–35% del fósforo, un 12%–18% de potasio y más del 10% del aporte calórico en azúcares simples. Son necesarias medidas para disminuir su aporte a través de consejo nutricional, revisión del etiquetado, campañas de educación en hábitos saludables, tasas y actuaciones institucionales que impliquen a las agencias de seguridad alimentaria, industria, distribución y sociedades científicas.
The transition from an agricultural society to an industrial and urban society, together with technological advances in food processing, has led to an exponential increase in the consumption of ultra-processed products in the modern diet. The excessive availability of food favors overeating, with a high intake of processed and refined products. The sodium, phosphorus and potassium intake is increased through additives and the energy intake is excessive through the intake of saturated fats and simple sugars.
The diets are rich in red meat proteins and low in vegetable proteins, complex carbohydrates, mono and polyunsaturated fatty acids and fibers.1 The cost of food production has been lowered asymmetrically. Fruits and vegetables have increased their price by 200%, reducing their consumption, and sugars only by 30%, multiplying their consumption by 10. Portions have increased by 20% and the establishment of large multinationals has favored the dissemination of these products.
As a consequence, there is an increase in the development of obesity.2 Spain has one of the highest rates in Europe: 54% overweight and 17% obesity in adults and 40% overweight and 18% obesity in children.3 Along with aging, these habits facilitate the increase in chronic diseases of high prevalence in Western society, such as diabetes, high blood pressure, chronic kidney disease (CKD), some cancers, osteoporosis, anemia, dental caries, cataracts and certain immune disorders.4,5
Modification of eating habits is especially harmful in CKD patients due to the high incidence of diabetes, dyslipidemia and hypertension, and due to the reduced capacity to eliminate the load of salt, phosphorus and potassium. The fact that one in seven adults in Spain has CKD highlights the magnitude of the problem,6 since an adequate nutrition in CKD is a key factor to improve health and quality of life of these patients.7
The reduction of these components in processed foods is difficult to achieve given their low price and their usefulness as preservatives, stabilizers, yeasts, etc. In addition, they improve palatability, in such a way that their reduction of additives produces rejection in consumers.8,9 In addition, the food industry is reluctant to accept limitations in its use, and the power of governments to initiate concrete actions is limited.
ObjectivesThis review focuses on the deleterious effects on health of excessive consumption of ultra-processed foods, emphasizing its impact in CKD. We analyze its impact on the excessive intake of sodium, simple sugars, phosphorus and potassium, and we review the strategies and regulations aimed at reducing their consumption.
Additives based on sodium and salt intakeSodium-based food additives are among the most consumed nutrients in the world. Its high use is related to its preservative and antimicrobial properties,10 as well as its use in fermentation, emulsification and as yeasts,11 all through simple technological processes, with reduced costs. Its ability to improve the palatability of food and promote the sensation of fullness reinforces the preference of different societies for salt and hinders measures aimed at reducing its consumption.12,13
One of the priorities of the WHO to reduce chronic non-communicable diseases is the restriction of sodium in the diet below 5 g/day of salt for an adult, a figure similar to that proposed in patients with CKD by the guidelines Kidney Disease Improving Global Outcomes 2012.14,15 However, excessive salt consumption is common in the population, exceeding the amount of 5−6 g/day in virtually all of the countries16,17 (Fig. 1) and reaching 10 g/day in Spain.18
 in 1990 and 2010 in 21 regions. Burden of Diseases Regions Global Study.16 The top symbol of each pair is for 2010.")
Sodium intake (g/day) in 1990 and 2010 in 21 regions. Burden of Diseases Regions Global Study.16 The top symbol of each pair is for 2010.
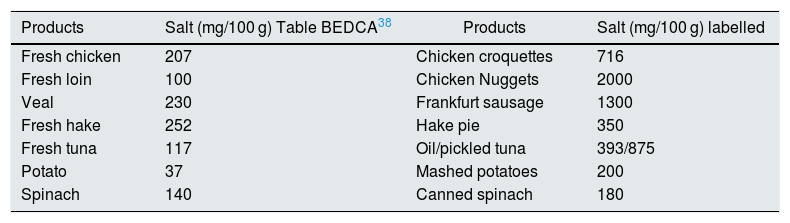
It is estimated that only 8% of the daily sodium intake comes from natural sources, while 72% comes from the salt added with the additives and the remaining 20% from the salt added during cooking or at the table19,20 (Fig. 2). A simple product review shows that manufacturing can multiply by 10–30 the content of salt (Table 1).

Distribution of sodium intake in the diet. Spanish Agency for Food Safety and Nutrition.19
Increase in salt content after processing different products.
| Products | Salt (mg/100 g) Table BEDCA38 | Products | Salt (mg/100 g) labelled |
|---|---|---|---|
| Fresh chicken | 207 | Chicken croquettes | 716 |
| Fresh loin | 100 | Chicken Nuggets | 2000 |
| Veal | 230 | Frankfurt sausage | 1300 |
| Fresh hake | 252 | Hake pie | 350 |
| Fresh tuna | 117 | Oil/pickled tuna | 393/875 |
| Potato | 37 | Mashed potatoes | 200 |
| Spinach | 140 | Canned spinach | 180 |
BEDCA: Spanish Food Composition Database.
Salt intake is associated with cardiovascular disease, the leading cause of mortality. One out of 10 deaths could be attributed to its high consumption of salt.21 These adverse effects are magnified in patients with CKD, contributing to the development of vascular damage, proteinuria and progression of kidney failure.22,23 Excess salt intake is also associated with significant costs of health care, it is estimated that a reduction of salt intake of 3 g/day could save 10–24 trillion dollars per year.24 The inclusion of costs related to CKD morbidity and mortality could significantly increase these estimates.25
Some initiatives to reduce salt intake offer us remarkable estimates. In Finland, the reduction of salt intake from 7 to 4 g/day was associated with a decrease of 10 mmHg in blood pressure and a decrease of 60% in cardiovascular mortality.26 In England, reducing the intake to 6 gm/day is estimated to prevent 26% of strokes and 20% of coronary episodes, with a reduction of 36,000 deaths per year.27
Studies based on the excretion of sodium in urine show that salt intake in CKD is similar to that of the general population, despite the fact that patients are usually under the supervision of nephrologists. This data may indicate a certain lack of compliance with the dietary recommendations, the inability of current strategies to reduce its consumption, and perhaps an association between risky behaviors and the development of CKD.28 The low importance given to reducing sodium intake29 and the preference for foods with higher salt content30 is also common with the general population.
Simple sugar intakeCarbohydrates are found in food as complex molecules (polymers or polysaccharides) or simpler molecules, commonly called simple sugars (monosaccharides like galactose, glucose, and fructose, and disaccharides like sucrose, lactose, and maltose). Simple sugars can be naturally present (honey, syrups, fruit juices, fruit juice concentrates) or added by manufacturers, cooks or consumers.31
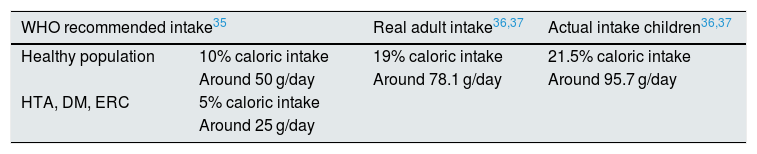
The WHO recommends a total caloric intake from simple sugars of 10%, equivalent to 50 g/day. It highlights that a reduction below 5% (25 g/day) would produce additional health benefits.32 However, in Spain consumption simple sugars by adults is 78.1 g/day, 19% of the total daily energy. In children, these data are more alarming, since the estimated consumption is 95.7 g/day, 21.5% of the total energy (Table 2).33,34
The increased intake of simple sugars is associated with obesity, diabetes, hypertension, dental caries and increased cardiovascular risk.35,36 The study by Rho et al.37 in 31,147 participants shows that high percentages of caloric intake of simple sugars (17%–21%) compared to lower percentages (8%) increase the risk of cardiovascular mortality by 38%. In childhood and adolescence, the risk of childhood obesity, insulin resistance and the development of dental caries are increased, in addition to facilitating incorrect eating habits.36 That is why early action can reduce obesity and diabetes in childhood.38
Excessive intake of simple sugars can specifically affect kidney function. It increases uric acid levels, produces acute hyperglycemia with oxidative stress,39 favors insulin resistance, dyslipidemia, activates the renin-angiotensin system, vascular disease and interstitial fibrosis, with the common link of activating inflammation.40,41
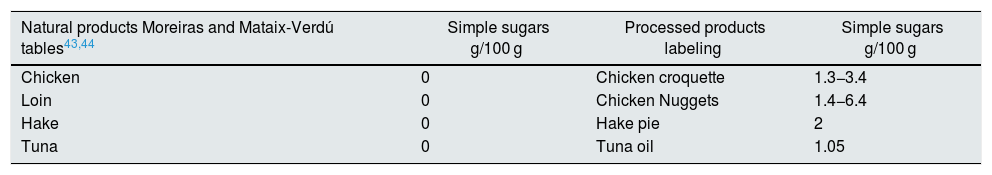
It is surprising that the Spanish Food Composition Database (BEDCA) does not record the simple sugar content of the different products.42 Other tables do include them, such as those of Mataix-Verdú and Moreiras.43,44 In processed products the amount of added sugars can vary enormously even between similar products, and significant variations may occur over time depending on the change in processing methods. It is therefore necessary to review the data provided on the labeling.
The simple sugar content of natural products is low, and the increased intake is through processed foods. Soft drinks and industrial pastries are the most important sources, although we must not underestimate the increasing amount consumed in cereals and precooked dishes45 (Fig. 3). A plain review of the simple sugar content serves as an example of the amount added in the processing of some foods (Table 3).

Sources of simple sugars added.45
Examples of the sugar content of natural and processed products.
| Natural products Moreiras and Mataix-Verdú tables43,44 | Simple sugars g/100 g | Processed products labeling | Simple sugars g/100 g |
|---|---|---|---|
| Chicken | 0 | Chicken croquette | 1.3−3.4 |
| Loin | 0 | Chicken Nuggets | 1.4−6.4 |
| Hake | 0 | Hake pie | 2 |
| Tuna | 0 | Tuna oil | 1.05 |
| Labeled industrial bakery | Juices, soft drinks labeled | ||
|---|---|---|---|
| Sobaos | 30 | Coca Cola | 10.6 |
| Donut | 20 | Juice | 10 |
| “Maria” cookies | 23 | ||
| muffins | 29 |
This fact is relevant especially in children and adolescents. A child who goes to school with a juice and four cookies in his backpack for lunch time would take approximately 20–30 g of sugar with the juice and 15–50 g with the cookies. That is, with a single intake you can exceed the recommended amount of sugar consumption in a day.46 Additionally, in children and adolescents it is common the simultaneous consumption of soft drinks and meat proteins with storage of adipose tissue due to the decrease in fat oxidation.47
The group of Ma Y et al.48 estimated the potential benefits of reduced sugar intake following the model of salt reduction program in the UK.49 A decrease in the consumption of simple sugars of 40% in sugary beverages during a 5 years period would allow a reduction in energy consumption of 38.4 kcal/day, with a decrease of 1.2 kg of weight and a reduction of 1% of the percentage of obesity in adults, and a reduction of 300,000 cases of diabetes type 2. There would not be drastic change in the taste of the product for the consumer, not be replaced by other food and would have no effect on the cost of the product. The estimated result would be higher in adolescents, young adults, and low-income families.
Phosphorus-based additivesIt is less known that phosphoric additives are widely used in food manufacturing. This additives were discovered after the sodium salts and have acquired great importance.50,51 Its wide use is due to its low price, the ease of handling and the diversity of its applications: pH regulators, antioxidants, protein stabilizers, flavor enhancers, color enhancers, melting salts in cheeses, improves dough and yeasts.52 As an example of its extensive use, in the 1970s more than 18,000 million kilos of phosphoric additives were used in the United States each year by the meat industries,50 and up to 10 times more in the bakery and food industry.53 These additives are also commonly used in dairy products, fish and beverages (in particular cola and soft drinks).54,55
Excessive intake of phosphorus can be considered a public health problem given its deleterious effects on the general population. The Framingham and CARE studies show an increase in vascular risk associated with the phosphate increase in plasma, which is why some authors suggest that the term “new cholesterol”.56,57 It has been described a correlation between serum phosphorus levels, mortality and the risk of developing diabetes in a population without CKD58,59 and the development of CKD is more frequent in diabetic patients depending on the phosphorus levels.60 Studies in children, adolescents and premenopausal women relate high phosphate levels with hypocalcemia, hyperparathyroidism and increase in fractures.61,62
In early-stage CKD, the intake of phosphate rich additives is associated with the development of albuminuria,63 and in patients with stablished CKD high phosphate intake it is associated with the development of arteriosclerosis, secondary hyperparathyroidism and bone disease in is well known.64–66
It is estimated that the average intake of phosphorus in the general population is 1338 mg/day, which is higher than the dietary recommendations of 1250 mg/day.67 Limits of phosphate intake in CKD are set between 800−1000 mg/day. Up to a third of this amount (250−300 mg/day) comes from phosphoric additives,68 with the aggravation that it is not accompanied by protein intake.69–71
The bad news about the use of phosphoric additives accumulates. Its use is widespread and relatively high amounts are allowed, as the limits are intended more to prevent fraud and toxicity than based on their health effects. Only its presence is reflected on the labeling by means of a specific code (Fig. 4), without stating the amount of total phosphorus or that provided by the additives.72 Nor do the food composition tables include phosphorus from additives, so we talk of a contribution of “hidden phosphorus”.42

Codes on the labeling referring to additives with phosphorus content. European Union Regulation 2011.72
The bioavailability of the phosphoric salts of the additives is very high, with an absorption of practically 100%, while the phosphorus bound to proteins is absorbed by 60%–70% and that bound to vegetables (in the form of phytates) in 40%.73 This high bioavailability cause an increase in serum phosphorus, and other deleterious effects, such as elevation of FGF2374 and an increase in the endothelial injury.75
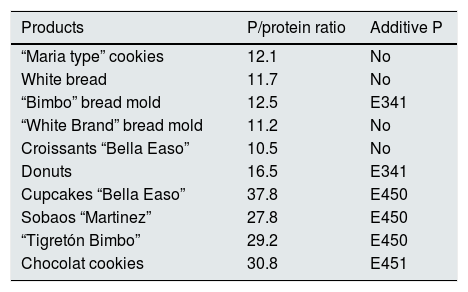
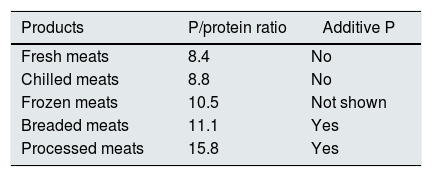
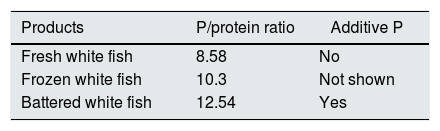
Through the studies of the Working Group for the Quality of Life in the Patient with CKD, we have determined the phosphorus and protein content in 118 products with different degrees of processing.76,77 We express in the following tables in a simplified manner the phosphorus/protein ratio and the presence of phosphoric additives by food groups.
Industrial bakery offers an acceptable phosphorus/protein ratio in simple products such as biscuits, bread or sliced bread. However there is an excessive amount of phosphorus in products with greater texture or fluffiness that require the use of yeasts with phosphoric salts (Table 4). In meat and fish products we see a significant increase in phosphorus content depending on the degree of processing. We detect higher phosphorus content in frozen products. According to current regulations, phosphoric salts can be added in the freezing process, which promote water retention and lower protein denaturation in the thawing process. However, it is not mandatory to include the use of these phosphoric additives on the labeling (Tables 5 and 6).
Phosphorus (P)/protein ratio in industrial bakery.76
| Products | P/protein ratio | Additive P |
|---|---|---|
| “Maria type” cookies | 12.1 | No |
| White bread | 11.7 | No |
| “Bimbo” bread mold | 12.5 | E341 |
| “White Brand” bread mold | 11.2 | No |
| Croissants “Bella Easo” | 10.5 | No |
| Donuts | 16.5 | E341 |
| Cupcakes “Bella Easo” | 37.8 | E450 |
| Sobaos “Martinez” | 27.8 | E450 |
| “Tigretón Bimbo” | 29.2 | E450 |
| Chocolat cookies | 30.8 | E451 |
Phosphorus (P)/protein ratio in meat products.77
| Products | P/protein ratio | Additive P |
|---|---|---|
| Fresh meats | 8.4 | No |
| Chilled meats | 8.8 | No |
| Frozen meats | 10.5 | Not shown |
| Breaded meats | 11.1 | Yes |
| Processed meats | 15.8 | Yes |
Phosphorus (P)/protein ratio in fish.76
| Products | P/protein ratio | Additive P |
|---|---|---|
| Fresh white fish | 8.58 | No |
| Frozen white fish | 10.3 | Not shown |
| Battered white fish | 12.54 | Yes |
The limited information on labels and food composition tables and the variability in manufacturing techniques lead us to a troubling conclusion: with current regulations, we are not able to estimate the amount of phosphorus ingested by our CKD patients.52,78
Potassium-containing additivesCurrent literature recommends increasing potassium intake in the general population to favor a better control of blood pressure, reduce cardiovascular risk, favoring lower bone pathology, improve glucose tolerance and decrease cardiac arrhythmias.79 This greater intake of potassium can be detrimental in CKD, since from filtrates below 45 mL/min/m2, the serum potassium levels are increased.80–82 Although potassium levels have not been associated with the progression of CKD, they are associated with the risk of mortality, hospitalization, cardiovascular events, and reduction or discontinuation of treatment with blockade of the renin-angiotensin system.83,84 Therefore, our concern is focused on preventing cardiovascular complications related to hyperkalemia.
Although the evidence is only limited, it is estimated that additives can increase potassium intake by around 300−500 mg/day.85 Parpia et al.86 detected the presence of additives with potassium in 15 of 91 meat products, chicken and fish (a 16.5%), which increases the potassium content from 325 to 900 mg/100 g.
The contribution of potassium may increase in the upcoming years by the substitution of sodium salts by potassium salts in the processing of products to following the policies of reduction of sodium intake.87 It is calculated that potassium intake would increase 453–674 mg/day if it replaces 20 or 50% of the sodium chloride in the diet.88 Parpia et al.89 find 40% more potassium in meat products in which sodium chloride has been replaced by additives containing potassium.
As with phosphoric salts, the percentage of absorbed potassium is much higher in additives. The bioavailability in fruits and vegetables is 50%–60%, compared to 90% in animal protein and 95% in additives.90,91
Diet limitations of potassium are difficult to implement and have a limited effect on potassium levels. Sources of potassium, cooking techniques, and drugs for controlling its plasma levels are currently under review.92 In this debate it would be convenient to add the relevance of the contribution of potassium with the additives.
Relationship between dietary patterns and chronic kidney diseaseInadequate dietary patterns are known to favor obesity, high blood pressure, diabetes and, through these cardiovascular risk factors, it also favors CKD. In addition there is a direct effect of these inappropriate diets on kidney function.93,94
The Mediterranean diet reduces metabolic acidosis, homocysteine, serum phosphorus, microalbuminuria, kidney damage and cardiovascular risk, improving survival in CKD, while the Western diet is correlated with systemic inflammation: increased CRP, ICAM-1 and VCAM-1.95–97
Odermatt98 describes how a combination of dietary factors contributes to impaired renal vascularization, steatosis, inflammation, hypertension, and impaired renal hormonal regulation (Fig. 5). It addresses recent advances in understanding the association of the Western-style diet with the induction of dyslipidemia, oxidative stress, inflammation, and alterations in corticosteroid regulation in the development of CKD. Future research should distinguish between the acute and chronic effects of diets high in sugar, salt, and fat and protein in red meat, and discover the contribution of each component. They strongly recommend a long-term clinical risk assessment to reduce metabolic complications and cardiovascular risk in kidney donors and CKD patients.

Impact of the Western diet on kidney physiology.
EETs: epoxyeicosatrienoic acids; 20-HETE: 20-hydroxyeicosatetraenoic acid; HPA: hydroxypentanoic acid; MAPK/ERK: mitogen activated protein kinase/extracellular signal-regulated kinase ½ ; Sgk1: serine/threonine-protein kinase. Adapted from Odermatt.98
Animal experimentation studies in Zucker rats show that a diet rich in fat produces an increase in CRP, lipids and insulin, in inflammation markers TNF, NFkB, urea and proteinuria, with a decrease in HDL cholesterol. At the renal level, it produces a cortical increase in inflammation markers TNF, NFkB, reactive oxygen species (ROS) and oxidative stress (NADP oxidase).99 The reduction in renal function also produces severe alterations in lipid homeostasis, with accumulation of ectopic fat combined with inflammatory infiltrates in the liver, pancreas and adrenal glands, renal adipogenesis and glomerulosclerosis.100
We must consider that patients on hemodialysis also present alterations in body composition that increase the deleterious effect of inadequate intake: sarcopenic obesity, decreased body fat and subcutaneous fat, increased visceral fat, and altered lipid profiles.101,102
Inflammation may be the common pathophysiological link between dietary patterns and microalbuminuria.103–105
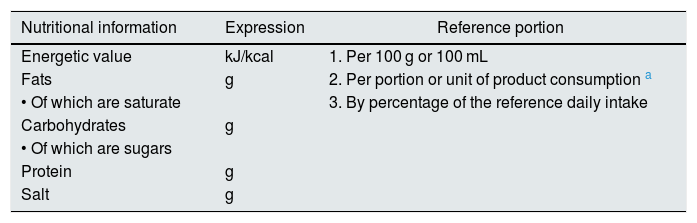
Nutritional information contained in the labelingPart of the information provided to the consumer should be the review of the labeling, an activity that should be promoted. Since December 13, 2016, there is a new regulation (EU) number 1169/201172 on food information provided to the consumer. This regulation add some improvements. The salt content must be specified, avoiding the confusion of expressing as sodium content (to change the content from grams of sodium to grams of salt we had to multiply by 2.5), and adds the obligation to include the content of saturated fats and simple sugars. These values are expressed per 100 g of the product, per consumption ration and by estimating the recommended daily intake (Table 7).
Nutritional information on the labeling. European Union Regulation 2011.72
| Nutritional information | Expression | Reference portion |
|---|---|---|
| Energetic value | kJ/kcal | 1. Per 100 g or 100 mL |
| Fats | g | 2. Per portion or unit of product consumption a |
| • Of which are saturate | 3. By percentage of the reference daily intake | |
| Carbohydrates | g | |
| • Of which are sugars | ||
| Protein | g | |
| Salt | g |
kJ: kilojoules; kcal: kilocalories.
Two limitations are still present: the amount of phosphorus and potassium provided is not recorded, since the presence of these additives is reflected by a specific letter and a code number.
The review of phosphoric additives using a simple card can be useful to select products and reduce phosphorus intake in patients with good functional capacity or good family support.106–110 The review of additives with potassium content is more complex, as they are presented in multiple components.
We therefore consider that, despite these improvements, there are at least two pending issues for the health of the general population and of our patients with CKD: the total amount of phosphorus and potassium should be recorded, broken down into that naturally contained in the food, and added by additives.111
Proposals to reduce the intake of ultra-processed foodsEducation on nutrition is basic step to accomplish healthy habits. We must consider individual dietary patterns, traditions and culture to guide the patient towards healthy diets, in our case the Mediterranean diet.112,113 We should convey a simple message: consume natural foods, increase the consumption of vegetables and fruits, and do not eat too much.114,115
It is important to raise awareness in society through institutional campaigns that promote healthy eating, limiting the advertising of ultra-processed products and prohibiting misleading advertising.116 Strict restrictions should be put in place on the messages of these products aimed at children.
In patients with advanced CKD, it is recommended the collaboration of a nutritionist within the multidisciplinary team responsible for the care of the patient. Raphael et al.117 observe that patients in the highest quartile of a healthy lifestyle reduce the risk of mortality by 53% as compared to the lowest percentile. Slinin et al.118 manage to reduce the mortality rate in the first year of dialysis by 19% in patients managed by a dietitian-nutritionist.
The application of taxes to ultra-processed products to reduce their consumption is a matter of debate. In Europe and other countries, there is already experience with the imposition of taxes on sugars. Mexico, France, Hungary, Finland, the United Kingdom and California have achieved decreases between 10 and 20% in the consumption of sugary drinks. “There is growing evidence showing that appropriately designed fiscal policies, when implemented with other political actions, have considerable potential to promote a healthy diet”, can be read in the conclusions of the WHO.119,120
Collaboration between food agencies, industry, and scientific societies is essential in managing this problem.121 Previous initiatives have made it possible to reduce the salt content in bread in Spain, France and the United Kingdom.122 A significant decrease in salt content was also detected in cereals, broths, canned fish and shellfish. However, there was a significant increase of salt in meat products, sauces, canned vegetables and cheeses.123
In 2017, a Collaborative Plan was launched between the Spanish Agency for Consumption, Food Safety and Nutrition (AECOSAN) and 328 food companies and distribution sector to improve the composition of food and beverages and other measures. This plan focuses on the commitment to reduce salt, saturated fat and added sugar, seeking a significant impact on the shopping basket (Fig. 6). The commitment is to reformulate products commonly consumed by families, offer healthy menus in catering (school, work, residences), give visibility to produce a possible drag effect on other companies, promote consumer awareness and have an impact on the health and in the prevention of the development of diseases.124

Collaboration plan between the Spanish Agency for Consumption, Food Safety and Nutrition AECOSAN and 398 companies in the food and distribution sector to improve the composition of food and beverages and other measures 2017–2020.124
There are important limitations and difficulties to implement this agreement. The amount of salt, fat and sugar to be reduced seems insufficient.125
The Spanish Association of the Bakery, Pastry and Pastry Industry (ASEMAC), which is affected by the three groups of compounds that must be reduced, affirms that they have three important limitations: techniques (machinery, processes such as fermentation), organoleptic properties (taste, smell) and consumer taste. This has led them to propose a reduction as far as possible of these compounds, but it has made it almost impossible to propose the substitution by other components.
The National Association of Meat Industries of Spain (ANICE) understands that reducing fat and salt is complex. Regarding sugar, they state that they add very little, although there is always room for improvement.” The risk of replacing sodium chloride by potassium salts should be evaluated.
In soft drinks and dairy products, these proposals do not imply a fundamental change in I + D. It is also easy for the Spanish Association of Juice Manufacturers (Asozumos), since these products do not contain added sugar (they have that of fruit). For pineapple, peach and orange nectars they promise to reduce added sugar by 10%.
In solid products, the role of sugar goes beyond the mere contribution of sweetness. It favors a whole series of processes such as capacity of conservation, contribution of volume, texture and color and modifies the melting and freezing point. Therefore, if the sugar is reduced or totally replaced, all these functions must be replaced by other ingredients or additives. To this day there is no single ingredient that is capable of doing this, or it may result of being replaced by fats.
Scientific societies play a fundamental role in producing translational and clinical research capable of generating the scientific bases that support policies and decision-making, as well as in promoting the participation and empowerment of citizens. The American Society of Nephrology presented a series of recommendations to the US Food and Drug Administration in 2014: to include CKD in all chronic diseases that affect public health, to include phosphorus content as a mandatory part of labels, and distinguish between phosphorus naturally contained in food and added as phosphoric additives and define the upper limits of tolerability and phosphorus intake, especially in ERC.78,126 The Spanish Society of Nephrology, together with other scientific societies, maintains an active involvement in advising political leaders, awareness campaigns and participation in different national and European forums. It maintains initiatives such as “Enjoy eating”, “Nefralia”, “Paths to live longer and better”127 aimed at healthcare professionals and patients in which different health issues are addressed with special emphasis on nutritional aspects.
Conclusions- •
Additives based on salt and phosphorus are widely used in food processing and they are used in large amounts.
- •
Simple sugars are widely distributed in processed foods, especially in soft drinks and industrial pastries.
- •
The intake of sodium, simple sugars and phosphorus through processed foods is excessive: approximately 72% of total sodium, 25%–35% of phosphorus, 12%–18% of potassium and higher than 10% of the daily caloric recommendation as sugars.
- •
This high intake is associated to cardiovascular and bone disease in the general population, and the these effects are especially deleterious in patients with CKD.
- •
The current labeling regulations provide adequate information on the content of salt and simple sugars. However, it still does not include the content of phosphorus and potassium.
- •
The current legislation considers that these additives are safe for consumption with few restrictions for the food industry. This represents an important barrier in reducing their intake.
- •
Measures are necessary to reduce the consumption of sodium, simple sugars, phosphorus and potassium through nutritional advice, labeling review, education campaigns on healthy habits, taxes and collaboration between scientific societies, food agencies, industry and distribution companies.
Research Group for the Improvement of the Quality of Life of Renal Patients. Annual financing. Aragonese Institute of Health Sciences. Spain.
Carlos III Institute. Grant from the Health Research Fund. Project “Dietary intervention in the control of hyperphosphataemia in patients on periodic hemodialysis”. File No. PI0790095. January 2008. Spain.
Conflict of interestsThe authors declare that they have no conflict of interest.
Please cite this article as: Lou Arnal LM, Vercet Tormo A, Caverní Muñoz A, Medrano Villarroya C, Lou Calvo E, Munguía Navarro P, et al. Impacto del consumo de alimentos ultraprocesados en la enfermedad renal crónica. Nefrologia. 2021;41:489–501.


