


Online haemodiafiltration (OL-HDF) is most effective technique; several randomised studies and meta-analyses have shown a reduction in mortality, with a directly related association with convective volume. At present, it is not properly established whether the increasing in dialyser surface area may suppose better outcomes in terms of convective and clearance efficacy. The purpose of the study was to assess the effect of increase in dialyser surface area on the convective volume and clearance capacity.
Materials and methodsA total of 37 patients were included, 31 male and 6 female subjects who were participating in an OL-HDF programme with a 5008 Cordiax monitor with autosubstitution. Each patient was analysed in three sessions, and only the dialyser surface area (1.0, 1.4 or 1.8m2) varied. In each session, urea (60Da), creatinine (113Da), β2-microglobulin (11,800Da), myoglobin (17,200Da) and α1-microglobulin (33,000Da) serum concentration at baseline and at the end of each session were determined, so the reduction of thes solutes could be calculated.
ResultsConvective volume achieved was 29.8±3.0 with 1.0m2, 32.7±3.1 (6% increase) with 1.4m2 and 34.7±3.3L (16% increase) with 1.8m2 (p<0.001). The increase in dialyser surface area showed an increase in urea and Creatinine clearance and urea and creatinine clearance. The reduction percentage of β2-m increased from 80.0±5.6 with 1.0m2, to 83.2±4.2 with 1.4m2 and to 84.3±4.0% with 1.8m2. Regarding myoglobin and α1-microglobulin, significant differences were observed between the smallest surface area (1.0m2), 65.6±11 and 20.1±9.3 and the other two surface areas, 70.0±8.1 and 24.1±7.1 (1.4m2) and 72.3±8.7 and 28.6±12 (1.8m2).
ConclusionThe increase in 40% and 80% of dialyzer surface area entails an increase in convective volume of 6 and 16% respectively, showing minimal differences both in convective volume and clearance capacity when UFC was greater than 45mL/h/mmHg. It is advisable to optimise dialyser efficiency to the smallest surface area possible, adjusting treatment prescription.
La hemodiafiltración on-line (HDF-OL) es actualmente la técnica más efectiva. Varios estudios aleatorizados y metaanálisis han observado una reducción de la mortalidad, objetivándose una asociación en relación directa con el volumen convectivo. En el momento presente no está bien establecido si el aumento de superficie del dializador puede suponer mejores resultados en términos de eficacia convectiva y depurativa. El objetivo del estudio fue valorar el efecto del aumento de superficie del dializador sobre el volumen convectivo y la capacidad depurativa.
Material y métodosSe incluyeron 37 pacientes (31 varones y 6 mujeres) que se encontraban en programa de HDF-OL con monitor 5008Cordiax con autosustitución. Cada paciente fue analizado en 3 sesiones en las que solo se varió la superficie del dializador (1,0, 1,4 o 1,8m2). En cada sesión se determinaron la concentración de urea (60Da), creatinina (113Da), β2-microglobulina (11.800Da), mioglobina (17.200Da) y α1-microglobulina (33.000Da) en suero al inicio y al final de cada sesión, para calcular el porcentaje de reducción de estos solutos.
ResultadosEl volumen convectivo alcanzado fue de 29,8±3,0 con 1,0m2, de 32,7±3,1 (incremento del 6%) con 1,4m2 y de 34,7±3,3l (incremento del 16%) con 1,8m2 (p<0,001). El incremento de la superficie del dializador mostró un aumento de la dosis de diálisis y de la depuración de urea y creatinina. El porcentaje de reducción de β2-microglobulina se incrementó de 80,0±5,6 con 1,0m2, a 83,2±4,2 con 1,4m2 y a 84,3±4,0% con 1,8m2. Respecto a la mioglobina y la a1-microglobulina, se observaron diferencias significativas entre la menor superficie (1,0m2) 65,6±11 y 20,1±9,3; y las otras 2 superficies 70,0±8,1 y 24,1±7,1 (1,4m2) y 72,3±8,7 y 28,6±12 (1,8m2).
ConclusiónEl incremento del 40 y el 80% de la superficie conlleva un aumento del volumen convectivo de un 6 y un 16%, respectivamente, mostrando mínimas diferencias tanto en el volumen convectivo como en la capacidad depurativa cuando el CUF era superior a 45ml/h/mmHg. Es recomendable optimizar el rendimiento de los dializadores a la mínima superficie posible adecuando la prescripción de tratamiento.
The ESHOL1 study has shown a longer survival in those patients receiving postdilution online HDF (OL-HDF), and recent meta-analyses has confirmed a reduction in global and cardiovascular mortality.2,3Post hoc analysis of the three clinical trials that had mortality as primary endpoint1,4,5 showed an association between convective volume and survival. In view of these results, obtaining a total convective volume greater than 21L per session has been recommended given the lack of more concluding scientific evidence.6 The main limiting factors to obtaining high convective volumes are the blood flow (Qb), the time and the dialyser.
In a previous study7 it was shown that the increase in Qb is probably the best option to reach the highest convective volume, with an increase of more than half a litre per hour per 50mL/min. The Qb increases the clearance capacity of small molecules and favours the clearance capacity of β2-m and myoglobin; and has no influence on higher molecules.
The pharmaceutical industry has improved dialysers by optimising the pore size and the inner diameter to achieve higher substitution volumes and better clearances.8 However, the choice of dialyser surface area has not been properly established. In Spain, some groups work with surface areas ranging from 1.8 to 2.1m29,10 and other groups, like ours, work with surface areas ranging from 1.4 to 1.8m2.11,12 Other European countries having a long tradition of convective therapies use high surface areas ranging from 1.8 to 2.3m2.13–15
If we consider the fact that most dialysers maintain an ultrafiltration coefficient (UFC) higher than 40mL/h/mmHg and high screening coefficients for β2-microglobulin (β2-m) and/or myoglobin, the purpose of this study was to assess the effect of dialyser surface area variations on convective volume and clearance capacity thereof in patients under treatment with OL-HDF.
Patients and methodsThis is a one centre study in stable hemodialysis patents. A total of 37 patients were included, 31 male and 6 female with a mean age of 64.7±13 years (range 41–89), who were participating in an HD programme for an average period of 39±35 months. Chronic kidney failure aetiology included 4 cases of chronic glomerulonephritis (10.8%), 8 cases of diabetic nephropathy (21.6%), 4 cases of polycystosis (10.8%), 3 cases of vascular nephropathy (8.1%), 3 cases of urologic causes (8.1%), 2 cases of systemic diseases (5.4%), 1 case of tubulointerstitial nephropathy (2.7%) and 12 cases of unknown aetiology (32.4%). All patients underwent dialysis through an arteriovenous fistula, except for one tunnelled central catheter.
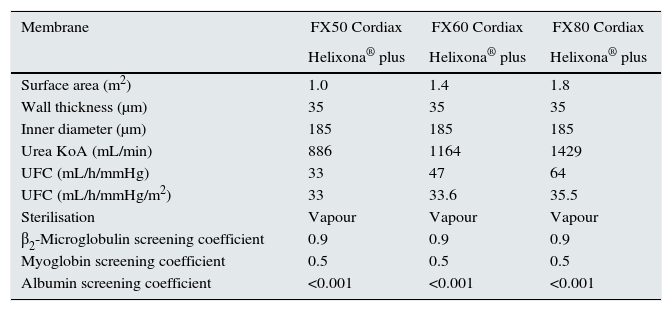
Each patient received three different dialysis sessions, always in the middle of the week, where only the dialyser surface area varied: 1.0, 1.4 or 1.8m2 (dialyser characteristics are listed in Table 1). The remaining dialysis parameters remained constant in each of the studied sessions: Helixone® plus membrane; dialysis time, 293±16min (240–300min); Qd 500mL/min; 5008 Cordiax monitor; postdilution OL-HDF with autosubstitution system. The order of sessions was randomised.
Dialyser characteristics.
| Membrane | FX50 Cordiax | FX60 Cordiax | FX80 Cordiax |
|---|---|---|---|
| Helixona® plus | Helixona® plus | Helixona® plus | |
| Surface area (m2) | 1.0 | 1.4 | 1.8 |
| Wall thickness (μm) | 35 | 35 | 35 |
| Inner diameter (μm) | 185 | 185 | 185 |
| Urea KoA (mL/min) | 886 | 1164 | 1429 |
| UFC (mL/h/mmHg) | 33 | 47 | 64 |
| UFC (mL/h/mmHg/m2) | 33 | 33.6 | 35.5 |
| Sterilisation | Vapour | Vapour | Vapour |
| β2-Microglobulin screening coefficient | 0.9 | 0.9 | 0.9 |
| Myoglobin screening coefficient | 0.5 | 0.5 | 0.5 |
| Albumin screening coefficient | <0.001 | <0.001 | <0.001 |
KoA: mass transfer area coefficient; UFC: ultrafiltration coefficient.
Dialysis parameters collected in each session were as follows: scheduled, actual duration, dialyser, Qb, needle gauge, dialysis bath flow, Kt automatically measured by ionic dialysance, recirculation index measured by temperature module, blood pressure (BP), venous pressure (VP), transmembrane pressure (TMP), baseline and final haemoglobin, ultrafiltration, processed blood volume and substitution volume.
Urea (60Da), creatinine (113Da), β2-microglobulin (11,800Da), myoglobin (17,200Da) and α1-microglobulin (33,000Da) serum concentrations at baseline and at the end of each session were determined to calculate the reduction percentage of these solutes. Urea and creatinine concentrations were measured by molecular absorption spectrometry with analyser ADVIA 2400 Chemistry System of Siemens Healthcare Diagnostics, IL, USA. β2-microglobulin and α1-microglobulin were measured by immunonephelometry with analyser BNII (Siemens Healthcare Diagnostics). Myoglobin concentrations were measured by sandwich enzyme immunoanalysis with Dimension EXL (Siemens Healthcare Diagnostics) analyser. In all cases, dedicated reagents were used.
To correct haemoconcentration during dialysis, pre- and post-treatment plasma reduction percentages of β2-m, myoglobin and α1-microglobulin were calculated using the Bergström and Wehle formula.16
The statistical analysis was performed using the SPSS statistical programme version 20.0 and the results were expressed as the arithmetic mean±standard deviation. For the analysis of statistical significance of quantitative parameters the Student's t-test has been used for paired data, or the ANOVA test for repeated data. A p<0.05 has been considered statistically significant.
ResultsAll dialysis sessions were performed with no significant clinical incidences. No session showed dialyser or line coagulation. Anticoagulation therapy used was sodium heparin in 24.3% of sessions, low-molecular-weight heparin nadroparin (32.4%) or tinzaparin (29.7%) and in 13.5% of the remaining sessions no heparin was used.
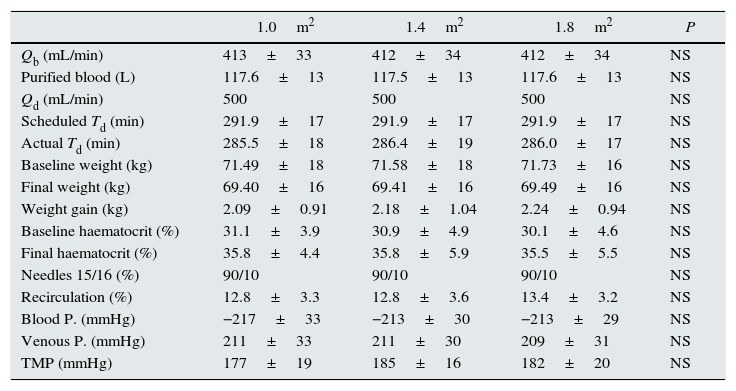
No differences were observed in dialysis parameters, Qb, total blood processed by the monitor, dialysate flow, actual duration of the sessions, baseline weight, weight gain, baseline and final hematocrit as measured by the dialysis monitor, needle size, vascular access recirculation, BP, VP or TMP (Table 2).
Comparison of dialysis parameters in the three study situations with dialyser surface area variation (n=37).
| 1.0m2 | 1.4m2 | 1.8m2 | P | |
|---|---|---|---|---|
| Qb (mL/min) | 413±33 | 412±34 | 412±34 | NS |
| Purified blood (L) | 117.6±13 | 117.5±13 | 117.6±13 | NS |
| Qd (mL/min) | 500 | 500 | 500 | NS |
| Scheduled Td (min) | 291.9±17 | 291.9±17 | 291.9±17 | NS |
| Actual Td (min) | 285.5±18 | 286.4±19 | 286.0±17 | NS |
| Baseline weight (kg) | 71.49±18 | 71.58±18 | 71.73±16 | NS |
| Final weight (kg) | 69.40±16 | 69.41±16 | 69.49±16 | NS |
| Weight gain (kg) | 2.09±0.91 | 2.18±1.04 | 2.24±0.94 | NS |
| Baseline haematocrit (%) | 31.1±3.9 | 30.9±4.9 | 30.1±4.6 | NS |
| Final haematocrit (%) | 35.8±4.4 | 35.8±5.9 | 35.5±5.5 | NS |
| Needles 15/16 (%) | 90/10 | 90/10 | 90/10 | NS |
| Recirculation (%) | 12.8±3.3 | 12.8±3.6 | 13.4±3.2 | NS |
| Blood P. (mmHg) | −217±33 | −213±30 | −213±29 | NS |
| Venous P. (mmHg) | 211±33 | 211±30 | 209±31 | NS |
| TMP (mmHg) | 177±19 | 185±16 | 182±20 | NS |
Qb: blood flow; Qd: dialysis fluid flow; Td: dialysis time; P.: pressure; TMP: transmembrane pressure.
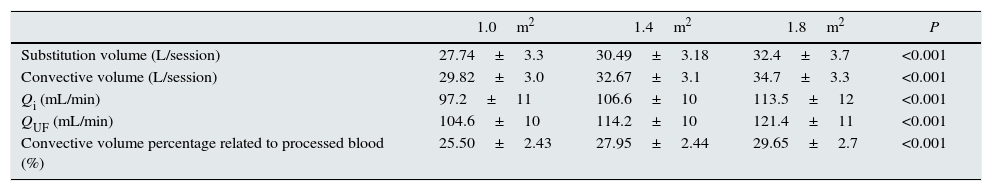
Substitution volume was significantly higher with the increase in dialyser surface area (Table 3). This table also shows the total convective volume (substitution volume plus weight gain) increased from 29.82L with 1.0m2 to 32.7L (increase of 9.5%) with 1.0m2 and 34.7L with 1.8m2 (increase of 16% in relation to 1.0m2 and 6% in relation to 1.4m2); the average Qi in each of the situations increased from 97.2mL/min with 1.0m2 to 113.5mL/min with 1.8m2; and the ultrafiltration flow (QUF). The calculation of the percent of efective concvective volume relative to the total processed blood, it was observed that this value was significantly higher with the larger surface areas, from 25.50±2.43% with 1.0m2 to 29.65±2.7% with 1.8m2 (Fig. 1).
Comparison of replacement volume, total convective volume, infusion flow, ultrafiltration flow and convective volume percentage over purified blood at different dialyser surface areas (n=37).
| 1.0m2 | 1.4m2 | 1.8m2 | P | |
|---|---|---|---|---|
| Substitution volume (L/session) | 27.74±3.3 | 30.49±3.18 | 32.4±3.7 | <0.001 |
| Convective volume (L/session) | 29.82±3.0 | 32.67±3.1 | 34.7±3.3 | <0.001 |
| Qi (mL/min) | 97.2±11 | 106.6±10 | 113.5±12 | <0.001 |
| QUF (mL/min) | 104.6±10 | 114.2±10 | 121.4±11 | <0.001 |
| Convective volume percentage related to processed blood (%) | 25.50±2.43 | 27.95±2.44 | 29.65±2.7 | <0.001 |
Qi: infusion flow; QUF: ultrafiltration flow.

The increase in dialyser surface area resulted in an increase in both the dose of dialysis and the clearance of small molecules. The Kt increased from 68.6±6.7L with 1.0m2 to 72.5±6.8 and 75.3±7.2L, with 1.4m2 and 1.8m2, respectively, p<0.001 in all situations. Fig. 2, shows the differences in the percent of urea and creatinine reduction, with statistically significant differences between 1.0m2 and the other two surface areas; there were no differences between 1.4 and 1.8m2 surface areas.

Clearance of β2-m was significatly increased in larger dilayzers (Fig. 3). Regarding myoglobin and α1-microglobulin, significant differences were observed between 1.0m2 and the other two surface areas (Figs. 4 and 5), but not between 1.4 and 1.8m2.


This study shows the comparisons of postdilutional OL-HDF in a same dialyzer with three different surface areas, 1.0, 1.4 or 1.8m2. It was observed that a 40% and 80% increase in surface area entails an increase in convective volume of 6–10% and 16%, respectively. Clearance capacity expressed as a percent reduction increased from 1% to 3% for urea (though expressed as Kt between 4% and 9.7%) and creatinine as small molecule markers, and from 1% to 5% for β2-m. In the case of molecules with a greater molecular weight, myoglobin and α1-microglobulin, a higher clearance was observed only in sessions with dialysers featuring a larger surface area compared to surface areas of 1.0m2.
OL-HDF is a safe technique which enhances intradialysis haemodynamic tolerance4,17 and increases survival.4–6 The EuDial group redefined HDF as the blood purification treatment which combines diffusive and convective transport using a high-flow dialyser with a UFC greater than 20mL/h/mmHg/m2, a screening coefficient for β2-m greater than 0.6 and an effective convective transport percentage greater than 20% of the total processed blood,18 with no other specification related to the surface area thereof.
The main limiting factors to obtain high convective volumes are Qb, the dialysis time and the haemoconcentration in the dialyser. Due to the development of new design of the dialyzers it has been possible to increase convective volume with the increase in pore size or capillary fibre diameter.8 This work aims to address the role of the dialyser surface area in obtaining the target convective volume and clearance efficacy. The convective volume reached varied from 30L with 1.0m2 to 35L with 1.8m2, or expressed as ultrafiltration flow ranging from 105 to 121mL/min, which represents an adequate convective dose in all study situations. Therefore, surface area individualisation based on each patient seems reasonable taking into account that there are dialysers with high UFC, ranging from 33 to 64mL/h/mmHg in this work, although many commercially marketed dialysers reach a maximum of 100mL/h/mmHg. This means that a TMP of 200mmHg enables a Qi of 110, 157 and 213mL/min with the three UFCs used, flows in the last two being higher than those which can actually be used, given the fact that to reach the Qi of 213mL/min in the 1.8-m2 filter with the Qi/Qb coefficient limitation of 33%, it would be necessary to use a Qb of at least 650mL/min, which is within reach only for a few vascular accesses and is rarely used in most units. In other words, we have dialysers with a high convective capacity and the Qi limitation is mainly due to Qb (25–33% thereof) and in a low percentage the limitation is in the dialyser UFC. Therefore, the issue raised relates to whether the dialyser is duly used to the fullest or not. In this work, with an average TMP of 200mmHg, this means that out of the aforementioned theoretical convective capacity, 95, 73 and 57% would be used with the three surface areas used. The change from 1.4 to 1.8m2 enables an increase of 6% in convective volume, and in a previous work,7 it was observed that increasing the Qb 50mL/min implied an increase of about 10%; the nephrologist shall decide between increasing the Qb and changing the dialyser based on his/her needs or possibilities.
An issue which has not yet been resolved relates to whether the increase in the dialyser surface area in patients treated with OL-HDF provides an added benefit in terms of clearance of molecules having a mean molecular weight, which is closely related to morbidity and mortality in patients on dialysis.19,20 The increase in the dialyser surface area increases clearance capacity. A discrete increase ranging from 1% to 3% of small molecule clearance has been essentially proved by the diffusive effect involved in this area increase. Assessed as Kt, this difference ranges from 3 to 7L (from 4% to 10%); for this reason, the prescribing physician has to assess that an adequate minimum dose is reached. The convective effect is seen with an improvement in β2-m clearance ranging from 1% to 5%. In the case of molecules with a greater molecular weight, differences were only observed when using larger surface areas compared to surface areas of 1.0m2.
If the limiting factor is the ultrafiltration coefficient, when this UFC is greater than 45mL/h/mmHg, the differences obtained in the convective volume and clearance capacity would be minimal. Therefore, it seems reasonable to question the benefit of dialysers having a larger or smaller surface area with UFCs greater than 45mL/h/mmHg, since they may obtain an ultrafiltration flow greater than 8.1L/h or 135mL/min, above that which is usually used.
In the 90s, in order to reduce dialysis duration, the Qb, Qd and the dialyser surface areas were increased using in a routine way surface areas ranging from 1.8 to 2.4m2. Subsequently, the national21 and international22 clinical guidelines recommend a minimum of 12h weekly in order to recover the importance of the dialysis time. However, despite recovering the time factor, the tendency to use dialysers with larger surface area has remained. As side effects, dialysers with larger surface area may show a higher incidence of headaches,23 particularly in women, greater albumin loss due to absorption,24 a platelet alteration determined as thrombopenia25 and may cause a higher inflammatory stimulus derived from patients’ blood contact with a larger membrane surface. In several works, it has been observed that immune system cells, even from healthy subjects, upon contact with dialysis membranes are immunologically activated,26,27 and this activation contributes to perpetuating the microinflammation condition of patients on haemodialysis. Therefore, when selecting a dialyser for a patient, it seems reasonable to choose that with which a smaller surface area makes it possible to achieve the same convection and clearance purpose. This surface area reduction is accompanied by a price reduction since efficiency is enhanced.
ConclusionWith the currently available high-flow dialysers for OL-HDF modalities, it is necessary to assess the selection of the dialyser surface area considering the cost-effectiveness ratio. A smaller surface area may reduce side effects and decrease the immunological and inflammatory response that is always present in haemodialysis. In this work, the full use of the convective capacity ranging from 57% to 95% has been observed among the dialysers used, showing minimal differences both in convective volume and clearance capacity when the UFC is greater than 45mL/h/mmHg. It is advisable to optimise dialyser output to the minimum surface area possible, adapting the treatment prescription, particularly of the Qb and the duration.
Conflicts of interestThe authors have no conflicts of interest to declare.
This study was conducted with the support of the REDIN-REN RD012 / 0021 network.
Please cite this article as: Maduell F, Ojeda R, Arias-Guillén M, Bazan G, Vera M, Fontseré N, et al. Valoración de la superficie del dializador en la hemodiafiltración on-line. Elección objetiva de la superficie del dializador. Nefrologia. 2015;35:280–286.


