


Protein-energy wasting (PEW) and poor health-related quality of life (HRQoL) are independently associated with morbi-mortality in continuous ambulatory peritoneal dialysis (CAPD). PEW may reduce HRQoL; however, we hypothesized HRQoL is affected differentially by PEW degrees or by individual criteria of nutritional status.
AimTo evaluate HRQoL according to PEW severity and nutritional status indicators in CAPD.
This is a cross-sectional study in 151 patients. Subjective global assessment (SGA) was employed, and nutritional status classified as normal, mild-moderate PEW, and severe PEW. HRQoL was evaluated using Kidney Disease Quality of Life Short Form™, including physical (PCS), mental (MCS) and kidney disease (KDCS) components, and their subscales. Dietary intake, anthropometric and biochemical variables were measured.
Forty-six percent of patients were well-nourished, 44% had mild-moderate PEW, and 10% severe PEW. Compared with well-nourished patients, those with mild-moderate (p=0.06) and severe (p=0.005) PEW had lower HRQoL score [68 (52–75), 55 (45–72), 46 (43–58), respectively]. PCS, MCS, and KDCS and their subscales had lower values as PEW was more severe. Patients with obesity and hypoalbuminemia had significantly lower HRQoL overall and component scores than their counterparts. Dietary intake was not associated with quality of life. In multivariate analysis obesity, PEW (by SGA), hypoalbuminemia, and low educational level predicted poor HRQoL (χ2 58.2, p<0.0001).
As conclusion, PEW severity was related with worse HRQoL, either as overall score or in every component or subscale in CAPD patients. Poor HRQoL was predicted independently by PEW severity and obesity; additional predictors were hypoalbuminemia and low education.
El desgaste proteico-energético (DEP) y la mala calidad de vida relacionada con la salud (CVRS) se asocian de forma independiente con la morbimortalidad en diálisis peritoneal continua ambulatoria (DPCA). El DEP puede reducir la CVRS; sin embargo, planteamos la hipótesis de que la CVRS se ve afectada de forma independiente por los grados de DEP o por los criterios individuales del estado nutricional.
ObjetivoEvaluar la CVRS de acuerdo a la gravedad de la DEP e indicadores del estado nutricional en DPCA.
Este es un estudio transversal en 151 pacientes. Se empleó la evaluación global subjetiva (EGS) y el estado nutricional se clasificó como normal, DEP leve-moderada y DEP grave. La CVRS se evaluó mediante el uso del cuestionario Kidney Disease Quality of Life Short Form™, incluidos los componentes físicos (PCS), mentales (MCS) y de enfermedad renal (KDCS) y sus subescalas. Se midieron la ingesta dietética, las variables antropométricas y bioquímicas.
El 46% de los pacientes tenía un estado nutricional normal, el 44% tenía DEP leve-moderada y el 10% DEP grave. En comparación con los pacientes bien nutridos, aquellos con DEP leve-moderada (p=0,06) y grave (p=0,005) tenían una puntuación de CVRS más baja (68 [52-75], 55 [45-72], 46 [43-58], respectivamente). Igualmente, la PCS, MCS y KDCS y sus subescalas tuvieron valores más bajos, conforme la DEP fue más severa. Los pacientes con obesidad e hipoalbuminemia tenían puntuaciones de CVRS general y de sus componentes significativamente más bajas que sus contrapartes. La ingesta dietética no se asoció con la calidad de vida. En el análisis multivariado la obesidad, el DEP (por EGS), la hipoalbuminemia y el bajo nivel educativo predijeron una mala CVRS (χ2 58,2; p<0,0001).
En conclusión, la gravedad del DEP se relacionó con una peor CVRS, ya sea como puntuación global o en cada componente o subescala de los pacientes con DPCA. La mala CVRS se predijo de forma independiente por la gravedad del DEP y la obesidad; predictores adicionales fueron hipoalbuminemia y la baja educación.
Protein-energy wasting (PEW) is a state of decreased protein and energy body stores observed in a large proportion of patients on continuous ambulatory peritoneal dialysis (CAPD, approximately 80% in our setting),1 which in turn is potently associated with increased morbidity and mortality.2,3 Causes of PEW in CAPD are multiple, including decreased dietary nutrient intake, depression, comorbidity, and dialysis procedure.4
Other factors, as health-related quality of life (HRQoL), may strongly influence morbi-mortality in end-stage renal disease (ESRD) population.5,6 It is well established that HRQoL components such as physical, emotional, mental and social aspects are more affected in ESRD patients compared to the general healthy population7 or patients with other chronic diseases.8 Malnutrition is associated with poor HRQoL in hemodialysis patients9–12; however, these studies do not differentiate quality of life according to the severity of PEW. Moreover, it is not completely clear the association between HRQoL and individual criteria of nutritional status such as dietary intake, body mass and biochemical parameters. Alterations in several nutritional criteria and unhealthy lifestyle contributing to obesity may affect both HRQoL and PEW, and as obesity affect it in other conditions13; consequently, it is necessary to evaluate this information gap in the chronic kidney disease population. In the case of CAPD, there is more limited information in this regard.14,15 Therefore, this study was performed to evaluate the HRQoL according to the PEW severity in CAPD patients, as well as the possible association between nutritional status indicators and HRQoL. We hypothesized that HRQoL is affected differentially by PEW degrees or by individual criteria of nutritional status.
MethodsThis is a cross-sectional study performed in CAPD patients, randomly selected from an outpatient clinic (Hospital General de Zona No. 89). Adult patients, both genders, age 18–65 years, who had been on CAPD for at least 3 months, were invited to participate, with a Kt/V≥1.6 to ensure adequate dialysis.16 They were excluded if had hospitalization 1 month before the study, were pregnant or breastfeeding, had a physical or mental disability to complete the evaluation, or other severe disease that could affect HRQoL (i.e., cancer, heart failure, liver failure). Patients who did not complete the whole questionnaire were eliminated from the analysis. Demographic and clinical data were obtained from direct interview and clinical evaluation. This study adhered to the Declaration of Helsinki and was approved by the Local Committee of Research and Ethics (R-2009-1304-23); written-informed consent was obtained from all participants.
Measurement of health-related quality of lifeThe self-administered questionnaire Kidney Disease Quality of Life (KDQOL, short form, v.1.3, KDQOL-SF™),17 previously validated in Mexican population,18 was employed to measure HRQoL. The KDQOL-SF™ combines the generic SF-36 with a kidney disease-specific instrument, and measures 3 domains of functioning and well-being on a 100-point scale (the higher the scale the better the HRQoL): (a) physical component summary (PCS), (b) mental component summary (MCS), and (c) kidney disease component summary (KDCS). The PCS aggregates subscales from general health, physical functioning, role-physical, bodily pain. The MCS aggregates subscales from role-emotional, social functioning, vitality and mental health, whereas KDCS aggregates subscales from burden of kidney disease, cognitive function, dialysis-staff encouragement, effects of kidney disease, patient's satisfaction, quality of social interaction, sexual function, sleep, social support, symptom/problem list and work status.17
Nutritional statusNutrition evaluation was performed with a 24-h dietary recall, a quantitative version of subjective global assessment (SGA), body mass index (BMI) and biochemical variables. SGA, 24-h dietary recall, and BMI were evaluated by an experienced renal dietitian.
The 24-h dietary recall was used to assess energy and protein intake. To calculate the consumption of nutrients, information of 24-h recalls was processed manually using reference tables from the Mexican System of Foods for Renal Patients.19,20 Consumed calories and proteins were compared to the usual CAPD recommendations.21
Quantitative version of SGA was utilized to evaluate wasting. This scale evaluates weight loss, change in dietary intake, gastrointestinal symptoms, functional impairment, loss of subcutaneous fat, muscle wasting, and presence of edema.22 Results are expressed in a score of 7–35 points, and nutritional status has been classified in dialysis patients23,24 as: normal (7–13 points), mild-moderate PEW (14–23 points), and severe PEW (24–35 points).
Anthropometric variables were measured using standard techniques for height and body weight (edema free and peritoneal cavity empty) to calculate BMI.25
Biochemical variables considered as part of nutritional evaluation in this study were serum albumin, creatinine and cholesterol. A blood sample in fasting condition was obtained to determine serum creatinine and cholesterol by habitual techniques in a VITROS 950/950AT Chemistry System (Johnson & Johnson, Langhorne, PA, USA). Serum albumin was determined by the green bromocresol method.
The following nutritional indicators reflecting PEW21,26 were evaluated in their possible association with HRQoL: energy intake <25kcal/kg, protein intake <0.8g/kg, serum creatinine <10mg/dL, serum albumin <3.8g/dL, serum cholesterol <150mg/dL, and BMI <23kg/m2. BMI was also analyzed considering obesity (≥30kg/m2).
Statistical analysisData are expressed as mean±standard deviation, median (percentiles 25–75%) or percentage, as appropriated. Comparisons between groups were made by Mann–Whitney U, analysis of variance and Chi-square tests, as appropriate. Multivariate general linear regression analyses to identify factors predicting HRQoL and its components (PCS, MCS and KDCS) were performed. A p value <0.05 was accepted as significant, but preferably the exact value was shown.
ResultsOne hundred fifty-one patients were evaluated: 70 with normal nutritional status, 66 with mild-moderate PEW and 15 with severe PEW. Comparisons of sociodemographic characteristics according to the nutritional status are shown in Table 1. Patients with normal nutritional status were younger, had more frequently a full or part time work, were more independent, and had less frequently diabetes as cause of ESRD and comorbidity after diagnosis than those with mild-moderate and severe PEW. No other differences were found in this regard.
Comparison of sociodemographic characteristics according to the nutritional status.
| Variables | Normal nutritionN=70 | Mild-moderate PEWN=66 | Severe PEWN=15 |
|---|---|---|---|
| Age, years | 32±14 | 41±17* | 41±17* |
| Sex male, n (%) | 36 (52) | 39 (59) | 10 (67) |
| Educational level, n (%) | |||
| ≤6 years | 12 (17) | 21 (32) | 6 (40) |
| >6 to <9 years | 25 (36) | 18 (27) | 6 (40) |
| ≥9 years | 33 (47) | 26 (39) | 3 (20) |
| Employment status, n (%) | |||
| Working full/part time | 26 (43) | 12 (21)* | 4 (29) |
| Unemployed | 32 (53) | 38 (65) | 8 (57) |
| Retired | 3 (5) | 8 (14) | 2 (14) |
| Source of income, n (%) | |||
| Employee income | 27 (39) | 23 (35) | 6 (40) |
| Dependent | 38 (54) | 38 (58) | 9 (60) |
| Mixed | 5 (7) | 5 (8) | 0 |
| Primary caregiver, n (%) | 48 (69) | 57 (86)* | 13 (87) |
| Cause of ESRD | |||
| Type 2 diabetes, n (%) | 9 (13) | 25 (38)* | 3 (20) |
| Hypertension, n (%) | 6 (9) | 5 (8) | 2 (13) |
| Unknown, n (%) | 16 (23) | 11 (17) | 2 (13) |
| Other, n (%) | 39 (55) | 25 (37) | 8 (54) |
| Dialysis vintage, months | 12 (10–21) | 15 (6–27) | 12 (6–36) |
| Comorbidity, n (%) | |||
| Type 2 diabetes, n (%) | 14 (20) | 29 (44)* | 4 (27) |
| Hypertension, n (%) | 34 (53) | 46 (72) | 8 (73) |
Abbreviations: PEW: protein-energy wasting; ESRD: end-stage of renal disease. Results are expressed as mean 1 standard deviation or median (percentiles 25–75%) or as the percentage of total participants. Statistical differences were determined using analysis of variance test, and χ2 test, respectively.
In the whole sample, KDQOL-SF™ results by components were: PCS 51 (35–78), MCS 67 (44–78), KDCS 60 (55–67), and overall HQRoL 59 (47–72). In general, quality of life seemed to be decreased as the nutritional status was more affected (Fig. 1). Patients with severe PEW had significantly the lowest HRQoL scores (overall and PCS, MCS and KDCS components), whereas patients with mild-moderate PEW had a worse total HRQoL and KDCS score than those with normal nutritional status.

Table 2 shows the comparison of HRQoL subscales results according to nutritional status. Regarding PCS, physical functioning progressively decreased as PEW worsened, whereas general health was significantly lower only in patients with severe PEW in comparison with well-nourished patients. In MCS, all the subscales seemed to be decreased in patients with PEW compared to subjects with normal nutrition, but only social functioning, vitality and mental health reached statistical significance in the case of patients with severe PEW. When KDCS was considered, burden of kidney disease was progressively worse as PEW was more severe, cognitive function and patient's satisfaction were lower in both PEW groups compared to normal subjects, whereas sleep and symptom/problem list were worse in patients with severe PEW than in those with normal nutritional status or with mild-moderate PEW. No other differences were found between groups; however, it is important to note that all groups reported excellent dialysis-staff encouragement, social support seemed to be higher as PEW was worse, sexual function (although decreased with PEW) seemed to be not importantly affected, and that work status (with the lowest value in both PEW groups) did not reach statistical significance.
Comparison of health-related quality of life subscales results according to the nutritional status.
| Dimension | Normal nutritionN=70 | Mild-moderate PEWN=66 | Severe PEWN=15 |
|---|---|---|---|
| Overall HRQoL | 68 (52–75) | 55 (45–72) | 46 (43–58)* |
| PCS | 59 (39–79) | 47 (33–76) | 38 (21–49)* |
| General health | 45 (30–61) | 47 (20–60) | 35 (15–40)* |
| Physical functioning | 70 (50–85) | 55 (29–80)* | 30 (10–55)* |
| Role-physical | 37 (0–75) | 0 (0–81) | 0 (0–50) |
| Bodily pain | 78 (55–93) | 73 (45–100) | 58 (45–100) |
| MCS | 70 (56–79) | 65 (36–79)† | 56 (30–68)* |
| Role emotional | 100 (33–100) | 100 (0–100) | 67 (0–100) |
| Social functioning | 75 (50–91) | 63 (38–91) | 50 (25–75)* |
| Vitality | 55 (40–75) | 47 (25–75) | 40 (20–50)* |
| Mental health | 76 (60–88) | 74 (43–84) | 48 (40–60)* |
| KDCS | 67 (62–76) | 64 (55–69)* | 59 (54–63)* |
| Burden of kidney disease | 56 (31–75) | 38 (17–64)* | 25 (0–44)* |
| Cognitive function | 87 (73–100) | 67 (53–87)* | 67 (47–87)* |
| Dialysis-staff encouragement | 100 (88–100) | 100 (88–100) | 100 (88–100) |
| Effects of kidney disease | 69 (52–85) | 66 (55–81) | 53 (41–78) |
| Patient's satisfaction | 86 (57–86) | 71 (57–86)* | 71 (57–86)* |
| Quality of social interaction | 47 (33–55) | 47 (33–60) | 60 (47–73) |
| Sexual function | 100 (63–100) | 88 (50–100) | 88 (25–100) |
| Sleep | 65 (44–90) | 66 (44–88) | 45 (28–55)*,£ |
| Social support | 75 (67–100) | 83 (67–100) | 100 (67–100) |
| Symptom/problem list | 79 (69–90) | 73 (57–86) | 60 (48–73)*,£ |
| Work status | 25 (0–50) | 0 (0–50) | 0 (0–0) |
Abbreviations: PEW: protein energy wasting; PCS: physical component summary; MCS: mental component summary; KDCS: kidney disease component summary. Results are expressed as median (percentiles 25–75%). Statistical differences were determined using analysis of variance test.
Regarding nutritional indicators reflecting PEW, the following results were observed: 56% of the patients had an energy intake <25kcal/kg and 41% had a protein intake <0.8g/kg. BMI<23kg/m2 was observed in 35%, whereas 20% had obesity, and only 45% had a BMI 23–30kg/m2. From biochemical variables, 39% had serum creatinine levels <10mg/dL, 70% serum albumin <3.8g/dL, and 23% serum cholesterol <150mg/dL.
Fig. 2 shows the comparisons of overall HRQoL and its components according to the individual nutritional status indicators. It was remarkable that patients with obesity had lower scores of all HRQoL components compared to those with ideal and low BMI. In the same way, patients with higher serum albumin levels displayed the better values in the overall and all the components of HRQoL. Additionally, those patients with higher serum creatinine had higher PCS score than those with lower values. No other significant differences were found in the energy intake, protein intake and serum cholesterol levels.

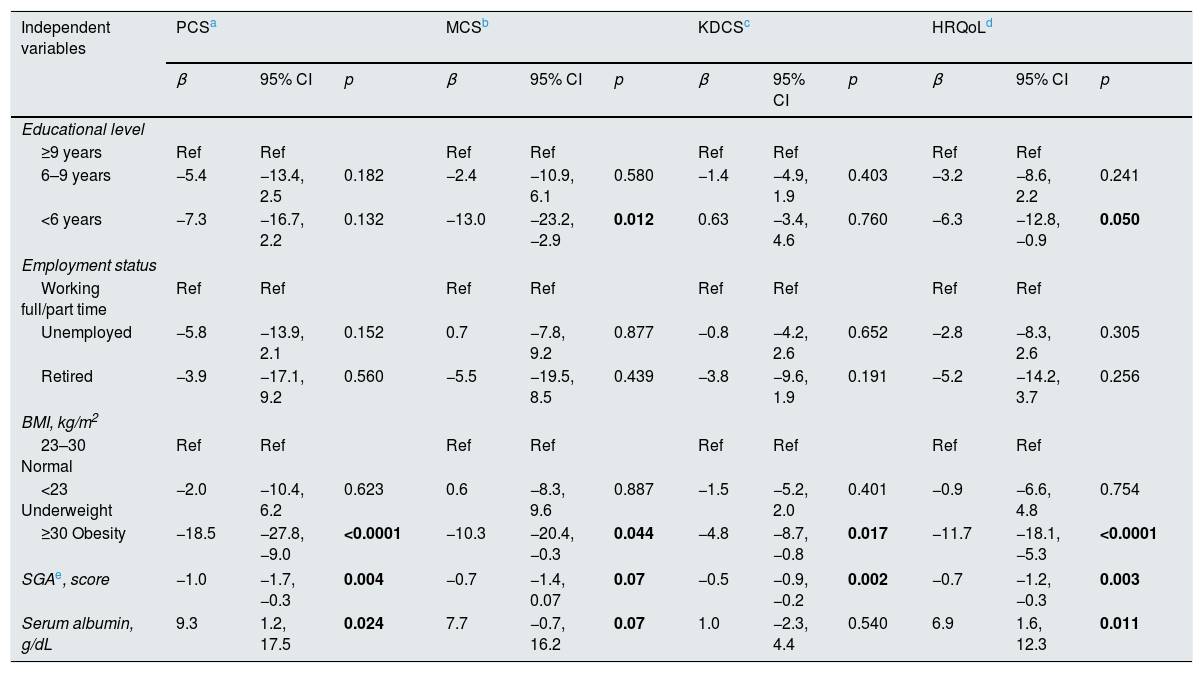
Table 3 shows results from multivariate general linear regression analysis. Obesity was the only nutritional status indicator that significantly predicted all the components and overall scores of quality of life; SGA did almost the same, except in the case of MCS in which statistical significance was marginal. Serum albumin was marginally associated to MCS and overall HRQoL, but significantly predicted PCS, whereas serum creatinine only predicted KDCS. A lower educational level predicted MCS and overall HRQoL score, whereas employment status was not associated to quality of life.
Multivariate general linear regression models predicting health-related quality of life scores.
| Independent variables | PCSa | MCSb | KDCSc | HRQoLd | ||||||||
|---|---|---|---|---|---|---|---|---|---|---|---|---|
| β | 95% CI | p | β | 95% CI | p | β | 95% CI | p | β | 95% CI | p | |
| Educational level | ||||||||||||
| ≥9 years | Ref | Ref | Ref | Ref | Ref | Ref | Ref | Ref | ||||
| 6–9 years | −5.4 | −13.4, 2.5 | 0.182 | −2.4 | −10.9, 6.1 | 0.580 | −1.4 | −4.9, 1.9 | 0.403 | −3.2 | −8.6, 2.2 | 0.241 |
| <6 years | −7.3 | −16.7, 2.2 | 0.132 | −13.0 | −23.2, −2.9 | 0.012 | 0.63 | −3.4, 4.6 | 0.760 | −6.3 | −12.8, −0.9 | 0.050 |
| Employment status | ||||||||||||
| Working full/part time | Ref | Ref | Ref | Ref | Ref | Ref | Ref | Ref | ||||
| Unemployed | −5.8 | −13.9, 2.1 | 0.152 | 0.7 | −7.8, 9.2 | 0.877 | −0.8 | −4.2, 2.6 | 0.652 | −2.8 | −8.3, 2.6 | 0.305 |
| Retired | −3.9 | −17.1, 9.2 | 0.560 | −5.5 | −19.5, 8.5 | 0.439 | −3.8 | −9.6, 1.9 | 0.191 | −5.2 | −14.2, 3.7 | 0.256 |
| BMI, kg/m2 | ||||||||||||
| 23–30 Normal | Ref | Ref | Ref | Ref | Ref | Ref | Ref | Ref | ||||
| <23 Underweight | −2.0 | −10.4, 6.2 | 0.623 | 0.6 | −8.3, 9.6 | 0.887 | −1.5 | −5.2, 2.0 | 0.401 | −0.9 | −6.6, 4.8 | 0.754 |
| ≥30 Obesity | −18.5 | −27.8, −9.0 | <0.0001 | −10.3 | −20.4, −0.3 | 0.044 | −4.8 | −8.7, −0.8 | 0.017 | −11.7 | −18.1, −5.3 | <0.0001 |
| SGAe, score | −1.0 | −1.7, −0.3 | 0.004 | −0.7 | −1.4, 0.07 | 0.07 | −0.5 | −0.9, −0.2 | 0.002 | −0.7 | −1.2, −0.3 | 0.003 |
| Serum albumin, g/dL | 9.3 | 1.2, 17.5 | 0.024 | 7.7 | −0.7, 16.2 | 0.07 | 1.0 | −2.3, 4.4 | 0.540 | 6.9 | 1.6, 12.3 | 0.011 |
Abbreviations: PCS: physical component summary; MCS: mental component summary; KDCS: kidney disease component summary; HRQoL: health-related quality of life; BMI: body mass index.
Significance determined by multivariate general linear regression analyses, all models are adjusted by gender, age and dialysis vintage.
Our results showed that PEW is significantly associated with poor HRQoL, which is in agreement with previous studies.9,10 However, the present data demonstrated as well that severe PEW was associated with decreased HRQoL more frequently than mild-moderate PEW, measured either as overall or by component and subscale (PCS, MCS and KDCS) scores, which had not been completely studied before.
PEW is characterized by loss of muscle mass, strength, and function, contributing to limited physical activities, which explain the poor PCS subscale scores, specially found in the severe form.
Moreover, our results demonstrated that the higher the PEW the worse the MCS scores. Previous studies12,27 did not find differences in MCS between malnourished and well-nourished patients, probably because they did not evaluate MCS specifically using subscales nor PEW severity. Our data showed that patients with mild-moderate PEW have similar mental status than those with normal nutrition, probably due to the possible psychological adjustment and a response shift to deal with illness.28,29 However, patients with severe wasting had significantly impaired social functioning, vitality and mental health. The latter could be associated with depression, which is commonly found30 and contributes to poor oral intake and malnutrition31 in chronic dialysis patients. Some psychological interventions have shown improvement in depressive symptoms and treatment adherence in other chronic conditions (i.e., diabetes)32; however, the effect of the latter has been poorly described patients with ESRD. Thus, it would be advisable to evaluate psychological strategies in conjunction with dietary treatment to more precisely discriminate those malnourished patients with impairment on mental health, social functioning and vitality, as well as those with low resilience to illness.
KDCS, on the other hand, displayed poor scores as previously reported11; however, analysis by subscales showed that patients with PEW, independently of the degree, had more burden of disease, more alterations in cognitive function and lower satisfaction than those without PEW. Moreover, patients with the more severe PEW had additional alterations in terms of sleep quality and in problems/symptoms list, which have been reported in association with uremia33, but its relation with PEW deserves further investigation. Although without statistical significance, it is notable that all patients reported encouragement by dialysis staff, which has been previously reported34 and that could be associated with a good dialysis service indeed or with fear of not receiving adequate treatment if they do not respond positively. In the same way, patients were less frequently laborally active and received more social support when they had severe PEW.
Regarding the individual clinical indicators of nutritional status, only the presence of obesity and hypoalbuminemia were significantly associated with worse overall and all the components of HRQoL scores. In reverse epidemiology, obesity is a protective factor for mortality in dialysis patients35; however, some studies suggest that this could be different in the case of peritoneal dialysis, as patients with obesity may have a higher mortality at ≥2 years than those with normal or overweight.36 In our study, patients with obesity had the worse HRQoL score as overall and in each of its components compared to patients with low or with normal BMI. Several factors in obese individuals may affect the physical and mental well-being37; its implications in peritoneal dialysis need further clarification. Low serum albumin was significantly associated with lower scores of overall HRQoL and all its components. Hypoalbuminemia38 as well as poor HRQoL39 have been shown as predictors for morbi-mortality in dialysis. Moreover, HRQoL has been reported as associated with low serum albumin levels10; however, it was not previously shown, particularly in peritoneal dialysis, that hypoalbuminemia is associated with all the components of HRQoL. No relation between HRQoL and dietary intake was found in this study; this finding is not completely clear but it has been reported in other studies.40,41
PEW was defined based on SGA results; in the present study, PEW was associated with worse HRQoL as previously reported,14 but additionally we demonstrated that HRQoL was worse as PEW was more severe. Results of multivariate analysis showed that for each point SGA increase (worse nutritional status), PCS, MCS, KDCS and overall HRQoL scores worsened almost at the same degree.
Finally, low educational level was associated with worse score for MCS and overall HRQoL, which is consistent with previous reports in patients with chronic illnesses42; it seems to be that individuals with higher education are more resilient.
Our study has strengths and limitations. To the best of our knowledge this is the first study in peritoneal dialysis patients assessing the association between HRQoL and PEW severity. In order to find a clear relationship between PEW severity and HRQoL, and reduce the risk of bias, we decided not to include patients whose quality of life could be affected by reasons such as recent hospitalization, severe illness, physical or mental disability and advanced age, conditions previously reported as associated with poor HRQoL.43–45
Among strengths, severity of PEW was defined according to the quantitative version of SGA with cutoff points that have been reported to have highest sensitivity and specificity for diagnosis of mild-moderate and severe PEW.23 Moreover, our study included important nutritional indicators reflecting PEW (energy and protein intake, serum biochemical markers and BMI) that supported our findings. Age, dialysis vintage and sex commonly affect HRQoL but all regression models were adjusted for such variables. On the other hand, the cross-sectional design of our study does not allow to establish causality; however, improvement in nutritional status has been shown to increase HRQoL of dialysis patients in longitudinal series.46 Due to financial limitations in our setting, bioimpedance evaluation (recognized as more accurate methods to assess nutritional status in this kind of patients),47,48 was not performed. Peritoneal membrane function and inflammation markers (i.e., C-reactive protein) measurements are not routinely available in our setting. Unfortunately, we did not collect data to calculate the neutrophil/lymphocyte or platelet/lymphocyte ratios to explore their correlation with PEW. Future studies investigating the latter issues could help to clarify such possible relation. In addition, exercise programs have favorable actions on social interaction, cognitive and physical function and depression49,50; thus, the practice of regular exercise and healthy lifestyle and their effect on each HRQoL component (i.e., PCS, MCS and KDCS) deserve to be explored more in depth in future research.
Based on the results of this study, it could be suggested to implement strategies for prevention and management of PEW in patients in order to improve quality of life. The impact of multidisciplinary strategies such as nutritional intervention, physical training and psychology strategies on HRQoL, lifestyle and therapeutic adherence of ESRD patients with nutritional disorders (PEW and/or obesity) could be considered in further investigations.
In conclusion, PEW severity was related with worse HRQoL in CAPD patients. This finding was observed evaluating HRQoL either as overall score or in every of its components and subscales. Obesity, PEW, hypoalbuminemia, and lower educational level were the only variables significantly predicting poor HRQoL.
FundingNo funders pertaining to this article.
Conflict of interestAll the authors declare no conflict of interests.
This research did not receive financial, technical, and/or editorial assistance.


