


Hypochloremia has been associated with increased mortality in patients with hypertension, heart failure, sepsis, and chronic kidney disease (CKD). The pathophysiological mechanisms of this finding are not clear. There are no studies describing an association between serum chloride levels (Cl−) and mortality in incident chronic hemodialysis (HD) patients.
MethodRetrospective cohort study of the incident population in our chronic outpatient hemodialysis program between January 1, 2016, and January 1, 2021 (N=374). Survival time was collected in all patients and analyzed using the Kaplan–Meyer method. A multivariate Cox regression model was performed to predict the probability of survival, applying a stepwise procedure.
ResultsDuring the median follow-up period of 20 months, 83 patients died. The 5-year overall survival rate for our patients was 45%. Both natremia and chloremia had no significant differences when compared by sex, vascular access, or etiology. There was an inverse correlation between Cl− and interdialytic weight gain (r=−0.15) (p=0.0038). Patients belonging to the quartile with lower Cl− levels had less probability of survival than patients in the quartile with higher Cl− levels (27% and 68%, respectively, p=0.019). On the other hand, in the multivariate Cox regression model, variables significantly associated with higher mortality were being older, having higher baseline comorbidity by modified Charlson index, not taking diuretics and having lower albumin and chloride levels. Particularly, higher Cl− levels was independently associated with both lower all-cause mortality (adjusted hazard ratio [HR]=0.84; 95% confidence interval [CI], 0.77–0.92; p=0.0001) and cardiovascular mortality (HR 0.9; 95% CI, 0.83–0.97; p<0.0057).
ConclusionsLower Cl− levels were associated with higher all-cause and cardiovascular mortality in incident patients on chronic hemodialysis in our health area.
Electrolyte disorders are frequent in CKD patients.1 Hyponatremia is one of the most established prognostic parameters given its relationship with mortality, a higher rate of cardiovascular events and progression of chronic kidney disease.1,2 But these findings may have obscured the pathophysiological role of another ion: serum chloride (Cl−).
There is increasing evidence of the role of this anion in arterial hypertension (AHT),3 heart failure,4,5 critical illness6 where low Cl− levels correlate with worse prognosis4 and these results were independent of Na+ levels.5 Supported by these results, some studies have recently emerged in patients with chronic kidney disease without renal replacement therapy (RRT)1,7 and in peritoneal dialysis.8,9
However, the underlying mechanisms related to these findings are not yet clear: low Cl− levels in the macula densa are associated with higher plasma levels of renin, conditioning a greater retention of Na+ and water and, therefore, resistance to diuretics. On the other hand, Mandai et al. highlights a possible influence of inflammation on their results.7
HD patients have high cardiovascular comorbidity, so we hypothesized that Cl− levels might be associated with inflammation and both all-cause and cardiovascular mortality in incident hemodialysis patients.
MethodsStudy design and populationWe conducted a retrospective, observational, multicenter cohort study of 374 adult HD incident patients from our outpatient hemodialysis units (Las Palmas, Spain) between January 1, 2016, and January 1, 2021. The inclusion criteria were as follows: patients over 18 years of age from the Advanced Chronic Kidney Disease consultations, renal transplantation with graft dysfunction or patients with acute renal failure who required chronic hemodialysis. Patients belonging to the peritoneal dialysis or home hemodialysis programs were not included.
Data collectionElectronic medical records (EMR) (Nefrosoft® and Selene-Drago®) of incident patients on chronic ambulatory hemodialysis were reviewed. Demographic data obtained were age, sex, type of vascular access, diuretics (use and dose), presence of comorbidities (arterial hypertension, diabetes mellitus), modified Charlson index (MCI) (calculated excluding subject's age and presence or absence of kidney disease),10 etiology of CKD and cause and date of death.
Mean dry weight (kg), interdialytic weight gain (kg), height (meter), body mass index (BMI) (kg/m2) and Kt (l) were obtained during one month after starting hemodialysis. Kt was determined by ionic dialysance, total body water (V) (l) by Watson's formula, body surface adjusted Kt (Ktbsa) by Lowrie's formula, and ΔKt was calculated by the difference between Ktbsa and Kt.11,12 The dose of loop diuretics was converted to its torasemide equivalent (8mg torasemide=40mg furosemide).1
The analytical data were obtained before the start of the hemodialysis session (the first value obtained within the first 3 months of starting the technique was taken into consideration) and were: Cl− (mEq/L), Na+ (mEq/L), K+ (mEq/L), C-reactive protein (CRP) (mg/L), bicarbonate (HCO3−) (mEq/L), anion gap (mEq/L) [AG=Na+-(Cl−+HCO3−)], serum iron (μg/dL), ferritin (ng/mL), albumin (g/dL) transferrin saturation index (TSI) (%), transferrin (mg/dl), absolute value of neutrophils (ANC) (103/μL), lymphocytes (ALC) (103/μL) and platelets (PLT) (103/μL), neutrophil–lymphocyte ratio (NLR=ANC/ALC), platelet–lymphocyte ratio (PLR=PLT/ALC) and systemic immunity-inflammation index (SII=ANC×PLT/ALC). Hypochloremia was considered when Cl− <98mEq/L.13
The analyses were performed at the hospital reference laboratory using standardized methods.
Hemodialysis techniqueFlexia® or Formula® (Bellco®/Medtronic®, Mirandola, Italy) monitors were used in the outpatient hemodialysis units. Monitors were synchronized with Nefrosoft® EMR and session data was instantly downloaded. In all cases, an ultrapure dialysis fluid was used, defined according to the guidelines of the Spanish Society of Nephrology.14 The most frequent prescription was conventional high-flow hemodialysis, 4h, 3 times per week. The membranes used were made of high permeability and biocompatibility polyethersulfone with a surface area ≥1.7m2 (Elisium® 17H, 19H or 21H, Nipro Medical Corporation®, Osaka, Japan). Dialysate concentration of chloride was 108.3mEq/L. Prescribed blood flow (Qb) was the maximum allowed by the vascular access (300–450mL/min).
OutcomesMortality was the only outcome of interest. Cardiovascular mortality was defined as death due to heart failure, cardiac arrest, myocardial infarction, cerebrovascular accident, or peripheral vascular disease. Noncardiovascular mortality was defined as all other causes of death. Survival time was calculated from the date of entry into the chronic hemodialysis program until death, kidney transplantation, loss to follow-up or end of the study: January 1, 2021.
Statistical analysisThe baseline characteristics of the sample were described: frequency and percentage were used for categorical variables and mean and standard deviation (SD) for normal continuous variables and median and quartiles for non-normal continuous variables. Normality was tested using the Shapiro–Wilk test.
Patients were divided into quartiles based on Cl− values [quartile 1 (<100mEq/L), quartile 2 (100–101mEq/L), quartile 3 (102–103mEq/L) and quartile 4 (>103mEq/L)], and a trend test was carried out (using Cuzick test for continuous variables and Cochran–Armitage test for binary variables) to evaluate whether there was an association between Cl− levels and the rest of the variables in a way that was less sensitive to the presence of outliers or possible non-linearity. In addition, the data were represented with Spearman correlations as they were less sensitive to the presence of extreme data.
Also, the sample were classified into two groups based on the median CRP as cut-off (high or low inflammation). The values of the continuous variables were compared using Student's T-test (for normal variables) or Mann–Whitney–Wilcoxon test (for non-normal variables). In the case of categorical variables, the comparison was made using the chi-square test.
Kaplan–Meier survival curves were used for the entire cohort and for groups defined by Cl− quartiles; and median Cl− or CRP, both used as cut-off point. Survival curves were compared between groups using the log-rank test. As a description of survival time, the probability of survival after 1, 2, 3, 4 and 5 years, respectively, was estimated.
Univariate and multivariate Cox proportional hazard regression models were constructed to examine the association between serum Cl− levels at the start of chronic hemodialysis and mortality (cardiovascular and all-cause).
To select variables in the multivariate model, initially, univariate Cox models were adjusted to all study variables. Those that were significant at the level of 0.25 were then used in an initial multivariate model. A stepwise procedure was used to minimize the Akaike Information Criterion (AIC), selecting the best model. The proportional hazards assumption was tested to validate the model.15
In all cases, differences with p-values of less than 0.05 were considered significant. Statistical analysis was performed using R program version 4.1.1 (2021) (R Foundation for Statistical Computing, Vienna, Austria. URL http://www.R-project.org/).
Ethical aspectsThe study protocol (2020-428-1) was approved by the Ethics and Clinical Research Committee of the Dr. Negrín University Hospital of Gran Canaria (Las Palmas de Gran Canaria, Spain). The study was conducted following the guidelines of the Declaration of Helsinki. Data were collected in an anonymized database and given its retrospective study design and not affecting the clinical management of patients, informed consent exemption was granted.
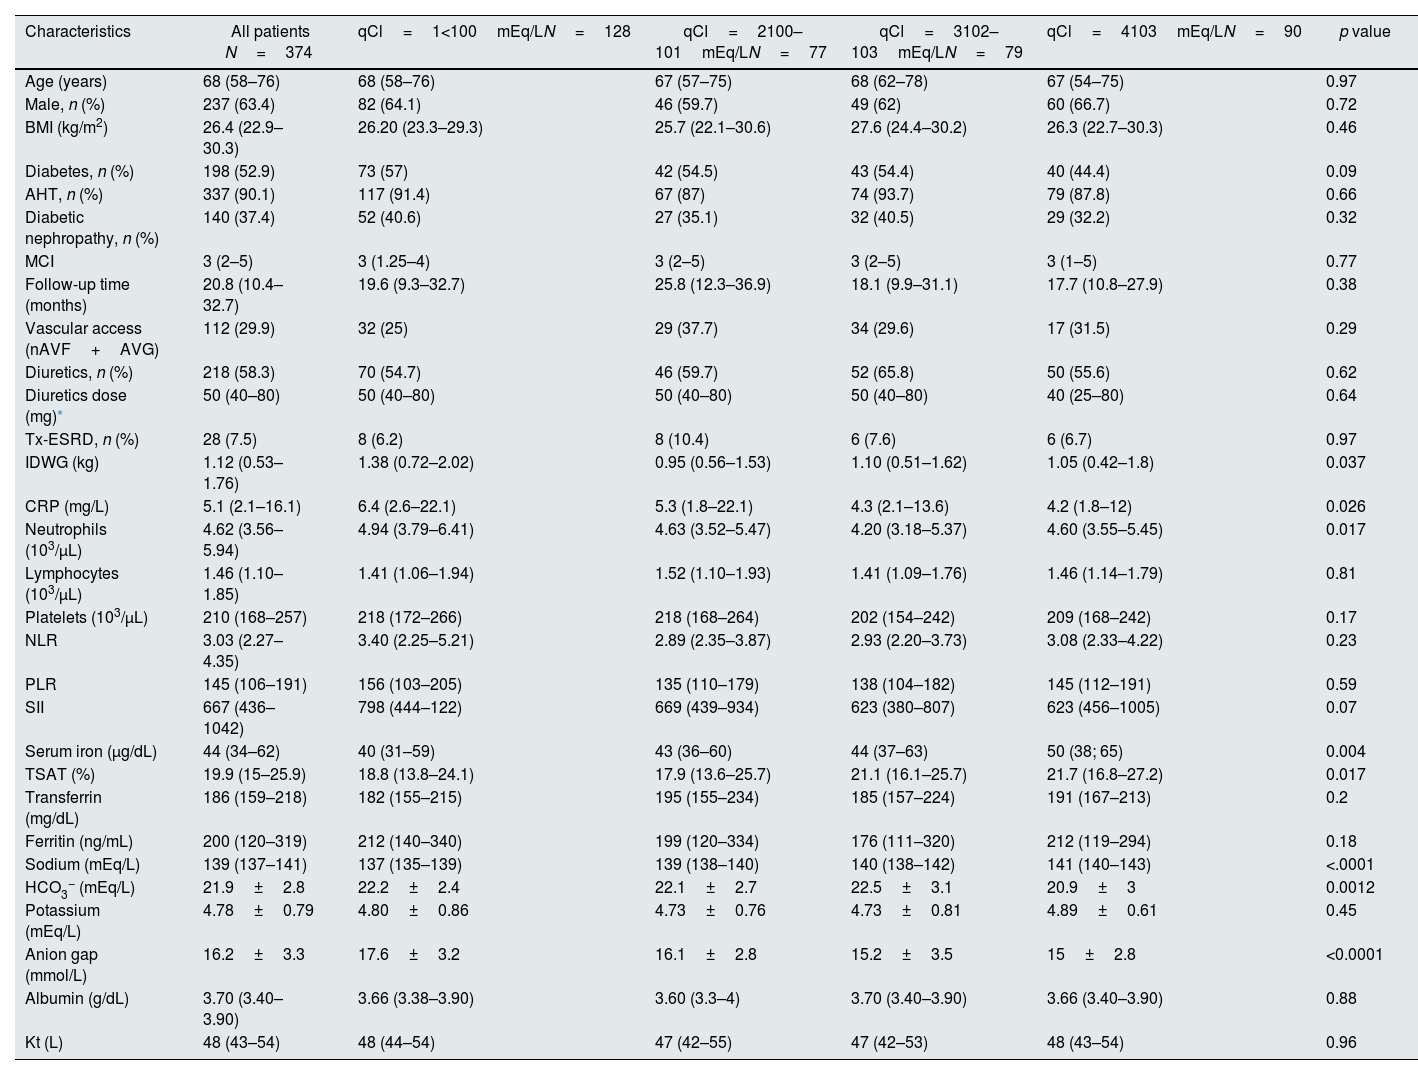
ResultsBaseline characteristicsThe median age of patients was 68 years. Males accounted for 64.4%. Diabetes as a comorbidity was present in 52.9%. Patients were also grouped according to quartiles of Cl−. Those belonging to the first quartile of Cl− presented higher CRP levels, as well as other parameters associated with inflammation. There were no significant differences in MCI as a function of chloride quartiles (p=0.77) or cause of death (p=0.16) (Table 1) (Table S1).
Baseline characteristics of patients according to quartile of serum chloride levels.
| Characteristics | All patients N=374 | qCl=1<100mEq/LN=128 | qCl=2100–101mEq/LN=77 | qCl=3102–103mEq/LN=79 | qCl=4103mEq/LN=90 | p value |
|---|---|---|---|---|---|---|
| Age (years) | 68 (58–76) | 68 (58–76) | 67 (57–75) | 68 (62–78) | 67 (54–75) | 0.97 |
| Male, n (%) | 237 (63.4) | 82 (64.1) | 46 (59.7) | 49 (62) | 60 (66.7) | 0.72 |
| BMI (kg/m2) | 26.4 (22.9–30.3) | 26.20 (23.3–29.3) | 25.7 (22.1–30.6) | 27.6 (24.4–30.2) | 26.3 (22.7–30.3) | 0.46 |
| Diabetes, n (%) | 198 (52.9) | 73 (57) | 42 (54.5) | 43 (54.4) | 40 (44.4) | 0.09 |
| AHT, n (%) | 337 (90.1) | 117 (91.4) | 67 (87) | 74 (93.7) | 79 (87.8) | 0.66 |
| Diabetic nephropathy, n (%) | 140 (37.4) | 52 (40.6) | 27 (35.1) | 32 (40.5) | 29 (32.2) | 0.32 |
| MCI | 3 (2–5) | 3 (1.25–4) | 3 (2–5) | 3 (2–5) | 3 (1–5) | 0.77 |
| Follow-up time (months) | 20.8 (10.4–32.7) | 19.6 (9.3–32.7) | 25.8 (12.3–36.9) | 18.1 (9.9–31.1) | 17.7 (10.8–27.9) | 0.38 |
| Vascular access (nAVF+AVG) | 112 (29.9) | 32 (25) | 29 (37.7) | 34 (29.6) | 17 (31.5) | 0.29 |
| Diuretics, n (%) | 218 (58.3) | 70 (54.7) | 46 (59.7) | 52 (65.8) | 50 (55.6) | 0.62 |
| Diuretics dose (mg)* | 50 (40–80) | 50 (40–80) | 50 (40–80) | 50 (40–80) | 40 (25–80) | 0.64 |
| Tx-ESRD, n (%) | 28 (7.5) | 8 (6.2) | 8 (10.4) | 6 (7.6) | 6 (6.7) | 0.97 |
| IDWG (kg) | 1.12 (0.53–1.76) | 1.38 (0.72–2.02) | 0.95 (0.56–1.53) | 1.10 (0.51–1.62) | 1.05 (0.42–1.8) | 0.037 |
| CRP (mg/L) | 5.1 (2.1–16.1) | 6.4 (2.6–22.1) | 5.3 (1.8–22.1) | 4.3 (2.1–13.6) | 4.2 (1.8–12) | 0.026 |
| Neutrophils (103/μL) | 4.62 (3.56–5.94) | 4.94 (3.79–6.41) | 4.63 (3.52–5.47) | 4.20 (3.18–5.37) | 4.60 (3.55–5.45) | 0.017 |
| Lymphocytes (103/μL) | 1.46 (1.10–1.85) | 1.41 (1.06–1.94) | 1.52 (1.10–1.93) | 1.41 (1.09–1.76) | 1.46 (1.14–1.79) | 0.81 |
| Platelets (103/μL) | 210 (168–257) | 218 (172–266) | 218 (168–264) | 202 (154–242) | 209 (168–242) | 0.17 |
| NLR | 3.03 (2.27–4.35) | 3.40 (2.25–5.21) | 2.89 (2.35–3.87) | 2.93 (2.20–3.73) | 3.08 (2.33–4.22) | 0.23 |
| PLR | 145 (106–191) | 156 (103–205) | 135 (110–179) | 138 (104–182) | 145 (112–191) | 0.59 |
| SII | 667 (436–1042) | 798 (444–122) | 669 (439–934) | 623 (380–807) | 623 (456–1005) | 0.07 |
| Serum iron (μg/dL) | 44 (34–62) | 40 (31–59) | 43 (36–60) | 44 (37–63) | 50 (38; 65) | 0.004 |
| TSAT (%) | 19.9 (15–25.9) | 18.8 (13.8–24.1) | 17.9 (13.6–25.7) | 21.1 (16.1–25.7) | 21.7 (16.8–27.2) | 0.017 |
| Transferrin (mg/dL) | 186 (159–218) | 182 (155–215) | 195 (155–234) | 185 (157–224) | 191 (167–213) | 0.2 |
| Ferritin (ng/mL) | 200 (120–319) | 212 (140–340) | 199 (120–334) | 176 (111–320) | 212 (119–294) | 0.18 |
| Sodium (mEq/L) | 139 (137–141) | 137 (135–139) | 139 (138–140) | 140 (138–142) | 141 (140–143) | <.0001 |
| HCO3− (mEq/L) | 21.9±2.8 | 22.2±2.4 | 22.1±2.7 | 22.5±3.1 | 20.9±3 | 0.0012 |
| Potassium (mEq/L) | 4.78±0.79 | 4.80±0.86 | 4.73±0.76 | 4.73±0.81 | 4.89±0.61 | 0.45 |
| Anion gap (mmol/L) | 16.2±3.3 | 17.6±3.2 | 16.1±2.8 | 15.2±3.5 | 15±2.8 | <0.0001 |
| Albumin (g/dL) | 3.70 (3.40–3.90) | 3.66 (3.38–3.90) | 3.60 (3.3–4) | 3.70 (3.40–3.90) | 3.66 (3.40–3.90) | 0.88 |
| Kt (L) | 48 (43–54) | 48 (44–54) | 47 (42–55) | 47 (42–53) | 48 (43–54) | 0.96 |
The values are expressed as median (q25–q75) unless otherwise specified. Trend test p-value is shown. BMI: body mass index; AHT: arterial hypertension; MCI: modified Charlson index; TSAT: transferrin saturation; SII: systemic immune-inflammation index; Tx-ESRD: patients receiving hemodialysis after failure of a previously functioning transplant; nAVF: native arteriovenous fistula; AVG: arteriovenous graft; IDWG: interdialytic weight gain; NLR: neutrophil-to-lymphocyte ratio; PLR: platelet-to-lymphocyte ratio.
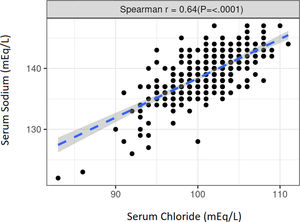
The median Cl− level was 101mEq/L (q25–q75: 99–103) while the median Na+ level was 139mEq/L (q25–q75: 137–141). Both natremia and chloremia had no significant differences when compared by sex, vascular access, or etiology. There was a strong, positive, and significant correlation between Cl− and Na+ (r=0.64) (p≤0.0001) (Fig. S1).
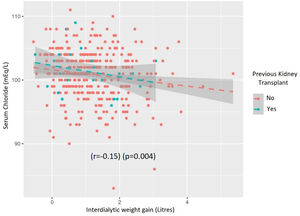
The correlation between Cl− and diuretic dose was low (r=−0.05) and not significant (p=0.49) but there was an inverse correlation between Cl− and interdialytic weight gain (r=−0.15) (p=0.004) (Fig. S2).
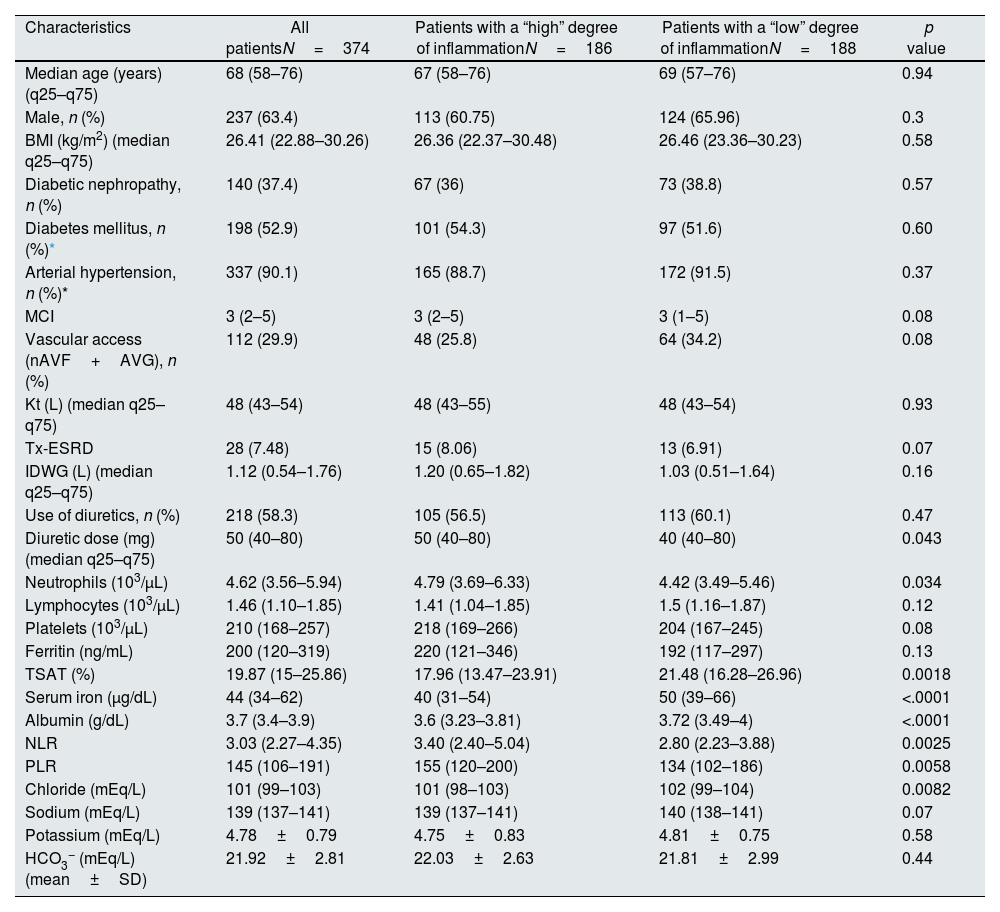
Inflammatory parametersThe median CRP of the sample was 5.11mg/L (q25–q75: 2.04–16.05). This was the cut-off point chosen to divide the patients into two groups (“high” inflammation=CRP >5.11mg/L and “low” inflammation=CR≤5.11mg/L). Between the two inflammatory subgroup populations (high vs low), there were no significant differences in age, gender, etiology, presence of diabetes or hypertension as comorbidities, previous kidney transplant, interdialytic weight gain, type of vascular access, MCI, or use of diuretics.
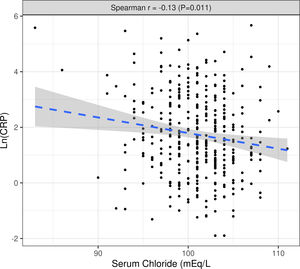
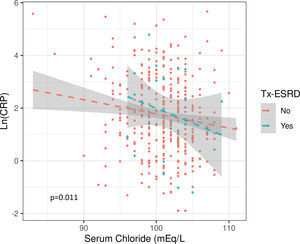
The median value of both Cl− and Na+ were significantly lower in the group with “high” inflammation and there was a significant inverse correlation between Cl− or Na+ levels and Ln(CRP). This association was not affected by interdialytic weight gain, diuretic dose, or their previous transplant condition (Fig. S3) (Table 2).
Baseline characteristics of patients according to inflammation status.
| Characteristics | All patientsN=374 | Patients with a “high” degree of inflammationN=186 | Patients with a “low” degree of inflammationN=188 | p value |
| Median age (years) (q25–q75) | 68 (58–76) | 67 (58–76) | 69 (57–76) | 0.94 |
| Male, n (%) | 237 (63.4) | 113 (60.75) | 124 (65.96) | 0.3 |
| BMI (kg/m2) (median q25–q75) | 26.41 (22.88–30.26) | 26.36 (22.37–30.48) | 26.46 (23.36–30.23) | 0.58 |
| Diabetic nephropathy, n (%) | 140 (37.4) | 67 (36) | 73 (38.8) | 0.57 |
| Diabetes mellitus, n (%)* | 198 (52.9) | 101 (54.3) | 97 (51.6) | 0.60 |
| Arterial hypertension, n (%)* | 337 (90.1) | 165 (88.7) | 172 (91.5) | 0.37 |
| MCI | 3 (2–5) | 3 (2–5) | 3 (1–5) | 0.08 |
| Vascular access (nAVF+AVG), n (%) | 112 (29.9) | 48 (25.8) | 64 (34.2) | 0.08 |
| Kt (L) (median q25–q75) | 48 (43–54) | 48 (43–55) | 48 (43–54) | 0.93 |
| Tx-ESRD | 28 (7.48) | 15 (8.06) | 13 (6.91) | 0.07 |
| IDWG (L) (median q25–q75) | 1.12 (0.54–1.76) | 1.20 (0.65–1.82) | 1.03 (0.51–1.64) | 0.16 |
| Use of diuretics, n (%) | 218 (58.3) | 105 (56.5) | 113 (60.1) | 0.47 |
| Diuretic dose (mg) (median q25–q75) | 50 (40–80) | 50 (40–80) | 40 (40–80) | 0.043 |
| Neutrophils (103/μL) | 4.62 (3.56–5.94) | 4.79 (3.69–6.33) | 4.42 (3.49–5.46) | 0.034 |
| Lymphocytes (103/μL) | 1.46 (1.10–1.85) | 1.41 (1.04–1.85) | 1.5 (1.16–1.87) | 0.12 |
| Platelets (103/μL) | 210 (168–257) | 218 (169–266) | 204 (167–245) | 0.08 |
| Ferritin (ng/mL) | 200 (120–319) | 220 (121–346) | 192 (117–297) | 0.13 |
| TSAT (%) | 19.87 (15–25.86) | 17.96 (13.47–23.91) | 21.48 (16.28–26.96) | 0.0018 |
| Serum iron (μg/dL) | 44 (34–62) | 40 (31–54) | 50 (39–66) | <.0001 |
| Albumin (g/dL) | 3.7 (3.4–3.9) | 3.6 (3.23–3.81) | 3.72 (3.49–4) | <.0001 |
| NLR | 3.03 (2.27–4.35) | 3.40 (2.40–5.04) | 2.80 (2.23–3.88) | 0.0025 |
| PLR | 145 (106–191) | 155 (120–200) | 134 (102–186) | 0.0058 |
| Chloride (mEq/L) | 101 (99–103) | 101 (98–103) | 102 (99–104) | 0.0082 |
| Sodium (mEq/L) | 139 (137–141) | 139 (137–141) | 140 (138–141) | 0.07 |
| Potassium (mEq/L) | 4.78±0.79 | 4.75±0.83 | 4.81±0.75 | 0.58 |
| HCO3− (mEq/L) (mean±SD) | 21.92±2.81 | 22.03±2.63 | 21.81±2.99 | 0.44 |
The values are expressed as median (q25–q75) unless otherwise specified; MCI: modified Charlson index; NLR: neutrophil-to-lymphocyte ratio; PLR: platelet-to-lymphocyte ratio; TSAT: transferrin saturation; BMI: body mass index; nAVF: native arteriovenous fistula; AVG: arteriovenous graft; IDWF: interdialytic weight gain; Tx-ESRD: patients receiving chronic dialysis after failure of a previously functioning transplant.
There were significant differences in the median dose of diuretics, being higher in the most inflamed group. Significant differences were observed in many of the variables classically related to inflammation between subgroups (Table 2).
Hemodialysis adequacyThe median Kt was 48L (q25–q75: 43–54). The target Kt adjusted to body surface (Ktbs) was 50±3.80L and the Kt/V was 1.30±0.29. The mean of the differences (ΔKt) between the Ktbs and the Kt was −2.18±8.81L.
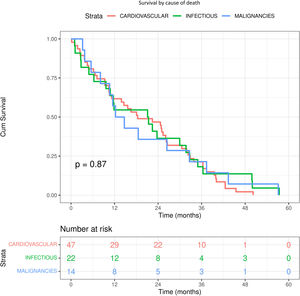
Cl− and mortalityDuring a median follow-up of 20 months (q25–q75: 10–32), 83 (22.2%) of the 375 patients died. The causes of death were: 47 (56.6%) cardiovascular, 22 (26.5%) infection and 14 (16.9%) malignancies. Although it appears that death due to infectious causes and malignancy occurs earlier (12 months), the log-rank test was not significant (p=0.87) (Fig. S4). There was no significant difference between Cl− and Na+ values according to cause of death (Table S1).
The Kaplan–Meir survival analysis stratified by baseline Cl− levels showed that patients in the 1st quartile had a higher both cardiovascular mortality (log-rang test, p=0.0085) and all-cause mortality (log-rank test, p=0.019). The separation of the 1st quartile curve from the rest is more pronounced from the second year onwards (Fig. 1).
 Kaplan–Meier estimates of cumulative all-cause survival rates. (B) Kaplan–Meier estimates of cardiovascular mortality. In both cases patients were stratified into four groups according to Cl− quartiles.")
Patients in the group with high CRP and low Cl− also had higher all-cause mortality compared with other groups (log-rank test, p=0.00044). In addition, of the two curves classified as “low CRP”, the one belonging to the lower chloride separates from the other from month 25 onwards (Fig. 2). There were no significant differences between these groups in terms of MCI (p=0.35).

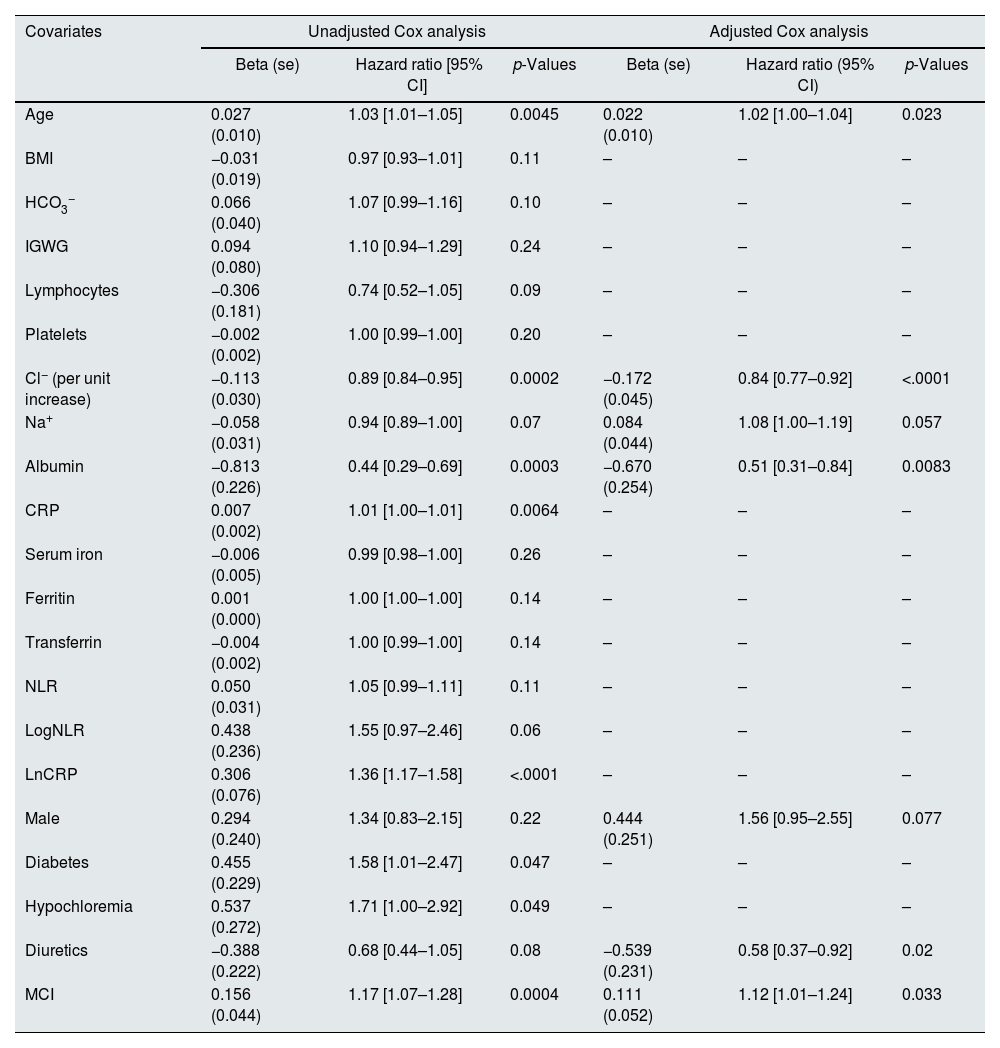
To identify which variables were significantly associated with survival, univariate Cox proportional hazard regression models were fitted to each one of the variables in the study. Only those variables for which the regression coefficient has p-value <0.25 are shown (Table 3).
Multivariate Cox regression model for all-cause mortality.
| Covariates | Unadjusted Cox analysis | Adjusted Cox analysis | ||||
|---|---|---|---|---|---|---|
| Beta (se) | Hazard ratio [95% CI] | p-Values | Beta (se) | Hazard ratio (95% CI) | p-Values | |
| Age | 0.027 (0.010) | 1.03 [1.01–1.05] | 0.0045 | 0.022 (0.010) | 1.02 [1.00–1.04] | 0.023 |
| BMI | −0.031 (0.019) | 0.97 [0.93–1.01] | 0.11 | – | – | – |
| HCO3− | 0.066 (0.040) | 1.07 [0.99–1.16] | 0.10 | – | – | – |
| IGWG | 0.094 (0.080) | 1.10 [0.94–1.29] | 0.24 | – | – | – |
| Lymphocytes | −0.306 (0.181) | 0.74 [0.52–1.05] | 0.09 | – | – | – |
| Platelets | −0.002 (0.002) | 1.00 [0.99–1.00] | 0.20 | – | – | – |
| Cl− (per unit increase) | −0.113 (0.030) | 0.89 [0.84–0.95] | 0.0002 | −0.172 (0.045) | 0.84 [0.77–0.92] | <.0001 |
| Na+ | −0.058 (0.031) | 0.94 [0.89–1.00] | 0.07 | 0.084 (0.044) | 1.08 [1.00–1.19] | 0.057 |
| Albumin | −0.813 (0.226) | 0.44 [0.29–0.69] | 0.0003 | −0.670 (0.254) | 0.51 [0.31–0.84] | 0.0083 |
| CRP | 0.007 (0.002) | 1.01 [1.00–1.01] | 0.0064 | – | – | – |
| Serum iron | −0.006 (0.005) | 0.99 [0.98–1.00] | 0.26 | – | – | – |
| Ferritin | 0.001 (0.000) | 1.00 [1.00–1.00] | 0.14 | – | – | – |
| Transferrin | −0.004 (0.002) | 1.00 [0.99–1.00] | 0.14 | – | – | – |
| NLR | 0.050 (0.031) | 1.05 [0.99–1.11] | 0.11 | – | – | – |
| LogNLR | 0.438 (0.236) | 1.55 [0.97–2.46] | 0.06 | – | – | – |
| LnCRP | 0.306 (0.076) | 1.36 [1.17–1.58] | <.0001 | – | – | – |
| Male | 0.294 (0.240) | 1.34 [0.83–2.15] | 0.22 | 0.444 (0.251) | 1.56 [0.95–2.55] | 0.077 |
| Diabetes | 0.455 (0.229) | 1.58 [1.01–2.47] | 0.047 | – | – | – |
| Hypochloremia | 0.537 (0.272) | 1.71 [1.00–2.92] | 0.049 | – | – | – |
| Diuretics | −0.388 (0.222) | 0.68 [0.44–1.05] | 0.08 | −0.539 (0.231) | 0.58 [0.37–0.92] | 0.02 |
| MCI | 0.156 (0.044) | 1.17 [1.07–1.28] | 0.0004 | 0.111 (0.052) | 1.12 [1.01–1.24] | 0.033 |
BMI: Body Mass Index; NLR: neutrophil-to-lymphocyte ratio; CRP: C-reactive protein; IDWG: interdialytic weight gain; MCI: modified Charlson index.
All these variables were initially entered in a multivariate model. A stepwise procedure seeking to minimize the AIC criterion was used for selecting variables in the final model. Variables selected were age, LnCRP, Cl− (as continuous variable), Na+, albumin, sex, use of diuretics and MCI. The LnCRP variable did not meet the proportional hazards hypothesis in the model (p=0.002). For this reason, we stratified the Cox model according to this variable; to stratify we considered two groups, the one formed by subjects whose CRP exceeds the median CRP value (CRP High), and those whose CRP is less than or equal to the median value (CRP Low). Model was again adjusted by a stepwise procedure. In the stratified model it is assumed that the effect of each independent variable is the same in the two strata defined by the CRP value. It is possible that this value differs between strata, i.e. that there is an interaction between the level of PCR and any of the independent variables. To check this, we also test for the presence of interactions. As interaction was not significant (p=0.99), the final fitted model was the stratified one, which coefficients are shown in Table 3.
After adjusting for the rest of variables (age, Na+, albumin, being male, taking diuretics and MCI), the coefficient of Cl− was negative (−0.172, with se=0.045), which means that higher baseline Cl− was associated with an increase in the probability of survival (HR 0.83; 95% CI 0.77–0.92; p<0.0001).
Increasing age (HR 1.02; 95% CI, 1.01–1.04; p=0.023), lower albumin (HR 0.51; 95% CI, 0.31–0.84; p=0.0083), not taking diuretics (HR 0.58; 95% CI, 0.37–0.92; p=0.02) and higher MCI (HR 1.12; 95% CI, 1.01–1.23; p=0.033) were also significantly associated with all-cause mortality (Table 3).
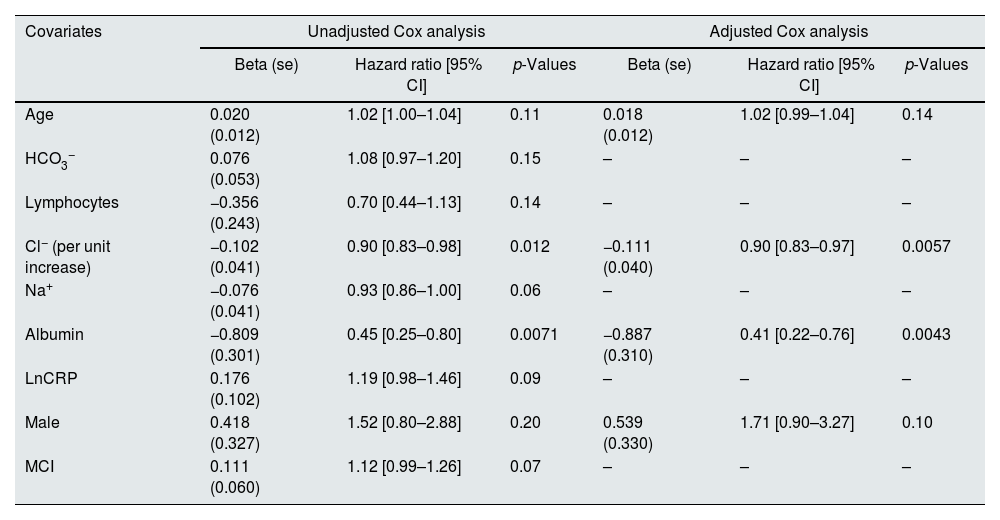
Likewise, in a multivariate analysis of cardiovascular mortality, higher baseline Cl− (HR 0.9; 95% CI, 0.82–0.97; p=0.0057) and albumin levels (HR 0.41; 95% CI, 0.22–0.76; p=0.043) were significantly associated with better survival (Table 4).
Multivariate Cox regression model for cardiovascular mortality.
| Covariates | Unadjusted Cox analysis | Adjusted Cox analysis | ||||
|---|---|---|---|---|---|---|
| Beta (se) | Hazard ratio [95% CI] | p-Values | Beta (se) | Hazard ratio [95% CI] | p-Values | |
| Age | 0.020 (0.012) | 1.02 [1.00–1.04] | 0.11 | 0.018 (0.012) | 1.02 [0.99–1.04] | 0.14 |
| HCO3− | 0.076 (0.053) | 1.08 [0.97–1.20] | 0.15 | – | – | – |
| Lymphocytes | −0.356 (0.243) | 0.70 [0.44–1.13] | 0.14 | – | – | – |
| Cl− (per unit increase) | −0.102 (0.041) | 0.90 [0.83–0.98] | 0.012 | −0.111 (0.040) | 0.90 [0.83–0.97] | 0.0057 |
| Na+ | −0.076 (0.041) | 0.93 [0.86–1.00] | 0.06 | – | – | – |
| Albumin | −0.809 (0.301) | 0.45 [0.25–0.80] | 0.0071 | −0.887 (0.310) | 0.41 [0.22–0.76] | 0.0043 |
| LnCRP | 0.176 (0.102) | 1.19 [0.98–1.46] | 0.09 | – | – | – |
| Male | 0.418 (0.327) | 1.52 [0.80–2.88] | 0.20 | 0.539 (0.330) | 1.71 [0.90–3.27] | 0.10 |
| MCI | 0.111 (0.060) | 1.12 [0.99–1.26] | 0.07 | – | – | – |
CRP: C-reactive protein; MCI: modified Charlson index.
A similar adjusted Cox model was designed using Cl− quartiles. Compared with the 4th quartile of Cl− (>103mEq/L), the 1st quartile (<100mEq/L) had 2.51-fold (95% CI, 1.25–5.07; p=0.01) and 2.94-fold (95% CI, 1.20–7.18; p=0.018) higher risk of all-cause and cardiovascular mortality, respectively (Tables S2 and S3).
DiscussionTo the best of our knowledge, this is the first study conducted in incident patients on chronic hemodialysis that demonstrates that lower baseline chloride levels were independently associated with increased all-cause and cardiovascular mortality. Of note, there were no significant differences in modified Charlson index as a function of chloride quartiles or cause of death.
Recently, the importance of Cl− in the prognosis of hypertension, heart failure and sepsis has been highlighted (1, 3–5, 7–9). Similar to our findings, these results were independent of Na+ levels or acid-base disturbances in most of cases (3, 5), although still with an unknown mechanism.
Testani et al. were among the first to highlight that patients with lower chloride levels had higher mortality in a post hoc analysis of the BEST clinical trial involving patients with heart failure (HF) with reduced ejection fraction.16 Similar results were found by Seo et al. in a Japanese cohort of patients with heart failure with preserved ejection fraction, which highlights the strength of this association in this group of patients.17
Dyschloremia has been associated with increased mortality in hospitalized patients. In intensive care units, both hypochloremia (adjusted OR 2.1; 95% CI 1.6–2.9; p<0.001) and hyperchloremia (unadjusted OR 1.9; 95% CI 1.6–2.3; p<0.001) were associated with higher mortality, even in post-discharge from the intensive care unit (adjusted HR 1.3; 95% CI 1.1–1.6; p<0.001).18 It should be noted that in this study, patients with hypochloremia had HF more frequently.
In another cohort, hyperchloremia was also associated with increased mortality (OR 2.50; 95% CI 2.01–3.12; p<0.001).19 In the latter case, it is noteworthy that 27% of the included patients were admitted to the intensive care unit and there could be an influence of the administration of chloride-rich fluids.
Petnak et al. highlighted that chloride levels before hospital discharge had a U-curve in terms of mortality, with patients with Cl− <99mEq/L and ≥109mEq/L having the highest mortality at one year. In our study, patients from 4th quartile (Cl−>103mEq/L) had better survival rate than the other groups, probably because our sample was smaller, only four patients had Cl− ≥109mEq/L and the inherent characteristics of hemodialysis population.20 Therefore, chloride alterations, in specific clinical contexts, could be related to increased mortality.
Few studies analyze dyschloremia as a prognostic marker in patients with CKD, and none on chronic hemodialysis.1,7–9 All were retrospective cohorts and there are, to date, no prospective studies. Two of them were conducted in CKD patients without RRT and the others two on peritoneal dialysis (PD) patients.
Mandai and Kubota's studies in non-dialysis CKD patients mention that those with lower levels of Cl− had higher mortality. However, Mandai (N=923) in its 4th quartile (Cl− levels≥108.1mEq/L) also found an increased risk of mortality. Kubota (N=2661) also finds an analogous result in his cohort (a J curve). However, this author highlights that after adjusting the results according to HCO3− levels, the greater risk of the group with higher Cl− levels disappears, concluding that low levels of HCO3− can bias the prognosis in this group of patients. This could be an explanation for the difference found with the previous study.1,7
It is striking that in Zhou's PD cohort (N=2376), the patients who had the highest mortality were those who had higher Cl− levels, both in general and cardiovascular mortality. It should be noted that in this study 446 patients who were taking diuretics and 368 with pre-existing cardiovascular disease were excluded and HCO3− levels were not collected.8
On the contrary, Li et al. (N=1656) found that PD patients with lower Cl− levels had higher all-cause and cardiovascular mortality, similar to ours. It must be noted that in this study, patients with cardiovascular comorbidity and diuretic treatment were not excluded. Also, bicarbonate levels were collected and analyzed. They highlight that the relationship between chloride and cardiovascular mortality was more accentuated in patients older than 50 years and with diabetes.9
Cl− is a main modulator of renin secretion and an important player in tubule-glomerular feedback within the kidney. In addition, it influences Na+ transport in the loop of Henle and the distal convoluted tubule. Cl− levels can vary with plasma tonicity and therefore reflect water and solute balance.18 In fact, hypochloremia produce both neurohormonal activation and resistance to diuretics that prevent adequate volume depletion in these patients.4 Also, low Cl− levels have been associated with an elevation of cardiac markers and a reduced left ventricular ejection fraction.21
However, despite these data, the clinical importance of Cl− has been overshadowed by Na+ which is a historically more recognized prognostic marker.22,23
Hypochloremia has recently been reported to stimulate with-no-lysine protein kinases (WNK). This favors a greater synthesis of transporters related to Cl− and Na+, such as Na+-Cl− cotransporter (NCC) or Na+-K+-2Cl− cotransporter (NKCC) (targets of thiazides and loop diuretics, which are in the distal convoluted tubule and in the loop of Henle, respectively), which lead to a greater reabsorption of both electrolytes and water. This situation, acting synergistically with increased resin-angiotensin system (RAAS) activation, could contribute to a worse prognosis in patients with heart failure, as suggested by some studies. Therefore, in our patients, low chloride could reflect the patient's baseline cardiac function at the start of hemodialysis and could be an explanation of their worse survival.24,25
In addition, it has been shown in vitro that tumor necrosis factor (TNF)-α increases the activity of WNK1, boosting the presence of NCC in the tubule and favoring the deleterious effects previously described.24,26 This highlights a possible link between TNF-α (one of the most important pro-inflammatory cytokines) and Cl−. Thus, our findings could suggest that in addition to inflammation, other factors, especially hemodynamics, may be involved: systemic congestion is associated with greater inflammation. Perhaps there are a synergistic mechanism between them.27
In fact, current literature review shows only little information about Cl− levels and inflammation. Notably, of the 4 studies in CKD and Cl− as prognostic marker, only 2 of them7,8 suggest that there could be an association between hypochloremia and inflammation. In our study, among the most inflamed patients, those with lower Cl− levels also had higher mortality compared to the rest of the groups. Although, it is possible that these are patients starting chronic hemodialysis clinically worse, there were no significant differences in terms of MCI values.
Furthermore, among the less inflamed, those with lower chloride appeared to have higher mortality, so the relationship between chloride and inflammation is still unclear. Therefore, other factors, such as cardiovascular status or volume overload may have a role.
Another aspect that has recently been considered is that overly strict salt restriction may be detrimental in hemodialysis patients.28,29 However, these studies do not analyze the possible role of chloride, something that is intuited in a post hoc analysis of the TOPCAT trial.30 In this study, patients with HF with preserved ejection fraction and lower salt intake had lower baseline chloride and sodium levels. They presented worse cardiovascular outcomes suggesting greater neurohormonal activation and worsening of their HF.
Finally, in the Cox analysis, the apparent protective effect of taking diuretics when starting hemodialysis is a point to consider. Some studies describe a protective effect in terms of hospitalization and intradialytic hypotension.31 However, our study does not include the subsequent suspension or continuation of treatment, and it may be a surrogate marker of residual diuresis at the beginning of the technique.
Therefore, there is a clear need for prospective studies specially designed to evaluate the prognostic significance of Cl− in CKD patients, especially on hemodialysis and, on the other hand, to design studies that integrate inflammation as an alternative pathophysiological explanation for this finding.
Some limitations of the study were its retrospective design, its circumscription to a single geographic area, the possible loss of data due to time limit constraints, and the need to find them in a specific period. Baseline echocardiography, bioimpedance, residual diuresis, and type of start (planned or not) data were not collected as they were not available. Only baseline analytical data were considered due to the variability of subsequent analyses.
The causal relationship between Cl− and outcomes cannot be established because of its design, and we cannot exclude the possibility that our findings may be related to unmeasured bias or confounding factors.
In conclusion, lower Cl− levels in our cohort of incident chronic hemodialysis patients were associated with higher cardiovascular and all-cause mortality. Further studies, preferably prospective, are needed to determine the clinical implications of this finding.
Authors’ contributionsStudy concept and design: F.V, T.M and N.V. Data collection: F.V and T.M. Data analysis and interpretation: A.S, N.V, T.M and F.V. Draft of the manuscript: all authors. Review and approval of the final version: all authors.
FundingThe authors declare no financial support for the project.
Conflict of interestThe authors declare no competing financial interest in relation to the publication of this article.
The authors would like to thank all the medical, nursing, and administrative staff of all AVERICUM S.L centers for the excellent care they provide to all our patients.