


The associated factors of peritoneal small solute transport was not fully understood. This research aimed to investigate the connection between dialysate inflammatory markers (e.g. macrophage migration inhibitory factor, MIF) in peritoneal dialysis (PD) effluent and peritoneal solute transport rate (PSTR) properties.
Subjects and designA total of 80 stable PD patients in the First ShaoYang Hospital were enrolled in present study. Overnight PD effluent and serum inflammatory markers including MIF, MCP-1, VEGF, IL-6, TNFα and TGFβ were detected. Pearson correlation analysis and Logistic regression was performed to determine the risk factors for the increased PSTR.
ResultsA trend toward increased values of MIF, MCP-1 and IL-6 in PD effluent was observed in subjects with high PSTR when compared with those with low PSTR. The Pearson correlation test showed that D/P Cr exhibited positive correlations with dialysis effluent MIF (r=0.32, p=0.01), MCP-1 (r=0.47, p=0.01), IL-6 (r=0.48, p=0.01). Conversely, no significant correlation was found between D/P Cr and TGF-β (r=0.04, p=0.70), TNF-ɑ (r=0.22, p=0.05), VEGF (r=0.02, p=0.86) and serum inflammatory markers. In the unadjusted regression analysis, dialysis effluent MIF (OR 2.41), MCP-1 (OR 1.72), IL-6 (OR 1.55) were associated with high PSTR condition. Multivariate logistic regression analysis showed that the adjusted odds ratios (OR) of dialysis effluent MIF for high PSTR were 2.47 in all subjects (p=0.03).
ConclusionElevated MIF, MCP-1 and IL-6 levels in PD effluent were associated with increased PSTR. Elevated dialysis effluent MIF levels was an independent risk factor for high PSTR in subjects with PD treatment.
Los factores asociados del transporte peritoneal de pequeños solutos no se conocen completamente. Esta investigación tuvo como objetivo investigar la conexión entre los marcadores inflamatorios del dializado (por ejemplo, el factor inhibidor de la migración de macrófagos [MIF]) en el efluente de diálisis peritoneal (DP) y las propiedades de la tasa de transporte de solutos peritoneal (PSTR).
Sujetos y diseñoSe incluyó un total de 80 pacientes con DP estable en el primer Hospital de Shaoyang. Se detectaron efluentes de DP nocturnos y marcadores inflamatorios séricos, incluyendo MIF, MCP-1, VEGF, IL-6, TNF -ɑ, TGF -β. Se realizó un análisis de correlación de Pearson y regresión logística para determinar los factores de riesgo para la PSTR aumentada.
ResultadosSe observó una tendencia hacia valores incrementados de MIF, MCP-1 e IL-6 en el efluente de DP en sujetos con PSTR alta, en comparación con aquellos con PSTR baja. La prueba de correlación de Pearson mostró que D/Pcr exhibe correlaciones positivas con el MIF del efluente diálisis (r = 0,32, p = 0,01), MCP-1 (r = 0,47, p = 0,01), IL-6 (r = 0,48, p = 0,01). Por el contrario, no se encontró una correlación significativa entre D/Pcr y TGF-β (r = 0,04, p = 0,70), TNF-ɑ (r = 0,22, p = 0,05), VEGF (r = 0,02, p = 0,86) y marcadores séricos de inflamación. En el análisis de regresión no ajustado, el MIF del efluente diálisis (OR 2,41), la MCP-1 (OR 1,72), la IL-6 (OR 1,55) se asociaron con una PSTR elevada. El análisis de regresión logística multivariante mostró que las odds ratios (OR) ajustadas del MIF del efluente diálisis para PSTR alta fueron de 2,47 en todos los sujetos (p = 0,03).
ConclusiónLos niveles elevados de MIF, MCP-1 y IL-6 en el efluente de DP se asociaron con un aumento de la PSTR. Los niveles elevados del MIF del efluente diálisis fueron un factor de riesgo independiente para PSTR elevada en sujetos tratados con DP.
End-stage renal disease (ESRD) was a serious public health problem with very high mortality and morbidity if lacking seasonable treatment. The major therapy for ESRD included kidney transplantation and dialysis.1 Peritoneal dialysis (PD) was a kind of renal replacement therapy with satisfactory efficacy.2 Effective ultrafiltration and convective transport of solutes was the pivotal function of PD. Preservation of the peritoneal membrane structure was a key point to the long-term success of PD treatment. Constant exposure of the peritoneum to bio-incompatible dialysis solutions with high concentrations of glucose resulted in deleterious changes to the peritoneal structure, which was associated with unfavorable clinical outcome.3 Both high glucose and glucose degradation products could impair cellular functions in peritoneal tissue, ultimately lead to peritoneal fibrosis.
Previous studies have confirmed that accumulation of advanced glycation end products in the peritoneal tissues promoted human peritoneal mesothelial cells synthesizing various inflammatory markers (e.g. macrophage migration inhibitory factor, MIF and tumor necrosis factor-α). More interestingly, the level of peritoneal cavity local micro-inflammation increased significantly with the extension of PD treatment time.4 Several previous studies have indicated that the micro-inflammation in peritoneal dialysis effluent was a risk factor for the increased peritoneal small-solute transport rate (PSTR),5,6 which was a common peritoneal membrane functional alteration during long-term PD treatment.2,7 It has been confirmed that high PSTR was an independent risk factor for PD therapy termination and death.8 However, the relationship between abdominal local micro-inflammation and faster PSTR remains controversial.9 Furthermore, in recent years, MIF has assumed a central role as a regulator of innate immunity and inflammatory cytokine network,10 but the impact of peritoneal local MIF on PSTR still remained unclear. Therefore, we performed this study to investigate the possible association between various inflammatory cytokines (e.g. MIF) and PSTR in patients undergoing PD.
Methods and materialsParticipantsThis study included 80 patients who were treated with PD from January 2018 to January 2020 in the First ShaoYang Hospital of Shaoyang College. The eligibility of the candidate was defined as follows: those patients with an age range from 18 to 80 years. In addition, these patients should be treated with continuous ambulatory peritoneal dialysis (CAPD) using conventional lactate-buffered glucosebased PD solution (Baxter, Guangzhou, China). Most patients adopted a 4×2L1.5% glucose PD solution (PDS) dialysis prescriptions, and the percentage of patients using 2.5% glucose PD solution was calculated. The subjects with any active infectious disease (e.g. systematic inflammation, peritonitis), active liver, immune disease, cancer or other abdominal operation and PD related peritonitis history were excluded. This study was approved by the ethics committee of the First ShaoYang Hospital of Shaoyang College.
Data collection and inflammatory factor detectionStandard questionnaire survey was used to collect the information on age, sex, weight, height and personal history (e.g. antihypertensive medications). The blood pressure was measured by an experienced nurse. The blood sample of included subjects were collected to detect blood glucose (BS), serum creatinine (SCr), hemoglobin (Hb), parathyroid hormone (PTH), blood calcium (Ca), blood phosphorus (IP) using automatical biochemical analyzer (OLMPUS AU100, Japan) in the central laboratory of the First ShaoYang Hospital, Blood C-reactive protein (CRP) was measured using immunonephelometry assay (Beckman Coulter, Inc., Fullerton, CA, USA).
The levels of MIF, Intedeukin-6 (IL-6), monocyte chemoattractant protein-1 (MCP-1), vascular endothelial growth factor (VEGF), tumor necrosis factor-ɑ (TNF-ɑ), transforming growth factor-β (TGF-β) in the peritoneal dialysis effluent was detected with ELISA technique. Dialysate sampling was from an overnight dwell. The test kits of MIF (CSB-E08330h), IL-6 (CSB-E04638h), MCP-1 (CSB-E04655h), VEGF (CSB-E11718h), TNF-α (CSB-E04740h), TGF-β (CSB-E04725h) were obtained from Wuhan CUSABIO BIOTECH CO., Ltd.
DefinitionWeekly urea clearance index (weekly Kt/V urea) was calculated to assess the efficiency of PD,11 the peritoneal equilibrium test (PET) was calculated to evaluate PSTR. For the PET, 2L of 2.5% glucose PDS was used, the dialysate-to-plasma ratio of creatinine at 4h (4h D/P Cr) and the protein catabolic rate were determined as previously described.12 Based on the value of 4h D/P Cr, High transport of PSTR (group H) was defined as from 0.82 to 1.03, High-average transport of PSTR (group HA) was defined as from 0.65 to 0.81, Low-average transport of PSTR (group LA) was defined as from 0.50 to 0.64, Low transport of PSTR (group L) was defined as from 0.34 to 0.49. In order to avoid affecting measurement accuracy of standardized ultrafiltration, we defined the standardized morning ultrafiltration of all patients using 1.5% PDS overnight dwell, and PET was performed at the later of this study.
Statistical analysisStatistical analyses were performed using the SPSS software (version 22.0). Mean values±standard deviation (X±SD) was calculated for the continuous results. Data was analyzed using t-test or one-way ANOVA for continuous variables. The Pearson correlation analysis between parameters was calculated whenever appropriate. The logistic regression analysis was analyzed to explore the association between various inflammatory parameters and high PSTR. Statistical significance was considered if p<0.05.
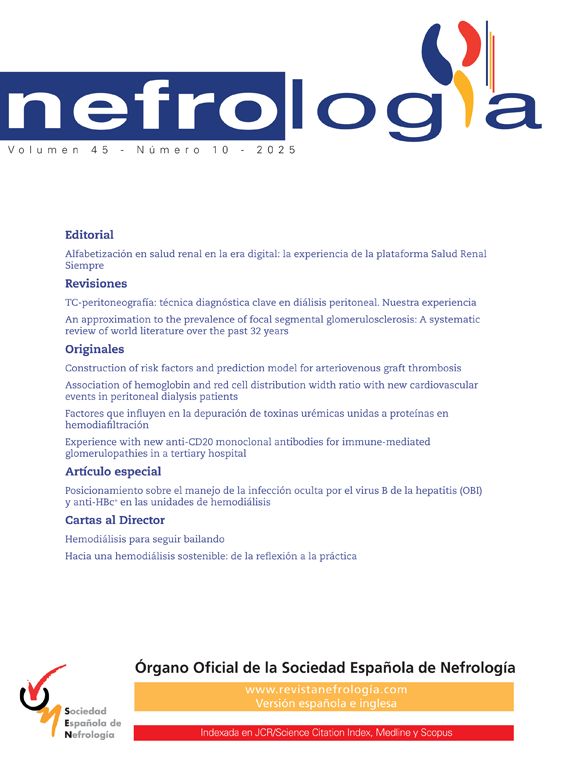
ResultsBaseline characteristics of the study populationBaseline demographic and laboratory characteristics of the subjects were shown in Table 1, 80 participants with mean age 52.5 years were included in this study, the mean duration of PD was 26.6±8.3 months. Among them, 44 (55%) were male, and 36 (45%) were female. Based on the status of PSTR, all patients were divided into four groups (high transport of PSTR, group H; high-average transport of PSTR, group HA; low-average transport of PSTR, group LA; low transport of PSTR, group L). We found that night ultrafiltration volume and the level of PTH were significantly higher in group L than those in group H (p<0.01 and p<0.05 respectively). In addition, we found that the percentage of using 2.5% PD solution in group H was higher than other groups (p<0.05). On the other hand, there were no significant differences in the levels of age, body weight, BMI, blood pressure, blood glucose, CRP, Hb, Serum Alb, Ca, IP, total Kt/V and duration of PD among four different groups (p>0.05). Besides, the results showed no significant difference in the prevalence of diabetes and cardiovascular disease (CVD) among four different groups (p>0.05).
Comparative analysis of patients’ information in independent groups of different solute transport rate.
| Group H | Group HA | Group LA | Group L | p | |
|---|---|---|---|---|---|
| n | 20 | 21 | 16 | 23 | >0.05 |
| Age | 52.4±11.0 | 53.2±18.4 | 53.5±13.9 | 52.6±11.1 | >0.05 |
| BW (kg) | 56.2±18.9 | 57.1±10.9 | 57.6±8.9 | 57.4±8.6 | >0.05 |
| BMI | 22.1±3.6 | 22.5±3.6 | 22.2±3.3 | 21.7±2.4 | >0.05 |
| SBP (mmHg) | 157.9±24.5 | 155.0±31.1 | 148.4±26.4 | 150.9±19.5 | >0.05 |
| DBP (mmHg) | 89.7±16.6 | 85.9±15.6 | 86.9±16.4 | 85.4±14.3 | >0.05 |
| BS (mmol/l) | 7.9±5.2 | 5.9±1.8 | 5.9±1.3 | 6.9±2.6 | >0.05 |
| CRP (mg/l) | 4.5±8.0 | 6.8±9.5 | 8.7±2.8 | 4.2±5.8 | >0.05 |
| HB (g/l) | 103.1±19.2 | 102.7±17.7 | 100.6±26.2 | 92.6±19.5 | >0.05 |
| Alb (g/l) | 31.9±3.1 | 32.7±3.1 | 34.7±3.02 | 33.2±2.5 | >0.05 |
| PTH (pg/ml) | 152.2±129.5 | 304.7±231.9 | 269.9±212.7 | 303.2±273.1 | <0.05 |
| Ca (mmol/l) | 2.3±0.2 | 2.2±0.2 | 2.3±0.2 | 2.2±0.3 | >0.05 |
| IP (mmol/l) | 1.4±0.5 | 1.6±0.4 | 1.6±0.5 | 1.6±0.4 | >0.05 |
| D/P Cr | 0.86±0.07 | 0.71±0.04 | 0.57±0.04 | 0.46±0.17 | <0.05 |
| Night ultrafiltration volume (mL) | 105.0±143.2 | 335.7±196.9 | 353.1±353.7 | 449.1±215.4 | <0.01 |
| Total Kt/V | 1.74±0.10 | 1.75±0.15 | 1.79±0.09 | 1.82±0.09 | >0.05 |
| PD time (month) | 26.3±6.8 | 24.7±10.3 | 26.3±8.4 | 28.8±7.4 | >0.05 |
| Serum MIF (pg/ml) | 470.3±130.5 | 391.2±131.6 | 478.5±118.6 | 442.7±178.1 | >0.05 |
| Serum MCP-1 (pg/ml) | 529.6±229.8 | 495.3±202.6 | 500.6±104.2 | 487.3±185.9 | >0.05 |
| Serum IL-6 (pg/ml) | 25.8±19.2 | 26.8±18.1 | 26.2±20.0 | 25.9±19.8 | >0.05 |
| Serum TGF-β (ng/ml) | 1.85±0.88 | 2.11±0.67 | 2.00±0.82 | 1.94±0.69 | >0.05 |
| Serum TNF-α (pg/ml) | 18.1±5.0 | 17.8±6.7 | 17.1±3.6 | 17.4±5.3 | >0.05 |
| Serum VEGF (pg/ml) | 129.9±38.3 | 121.4±35.2 | 129.3±40.8 | 120.0±31.1 | >0.05 |
| The prevalence of diabetes | 20.0%(4) | 23.8%(5) | 25%(4) | 17.4%(4) | >0.05 |
| The prevalence of CVD | 15.0%(3) | 14.2%(3) | 18.7%(3) | 17.3%(4) | >0.05 |
| Using of 2.5% PD solution | 60%(12) | 42.8%(9) | 37.5%(6) | 30.4%(7) | <0.05 |
Note: BMI, body mass index; BW, body weight; SBP, systolic blood pressure; DBP, diastolic blood pressure; BS, blood glucose; CRP, C-reactive protein; HB, hemoglobin; Alb, albumin; MIF, macrophage migration inhibitory factor; MCP-1, monocyte chemoattractant protein-1; IL-6, interleukin-6; TGF-β, transforming growth factor-β; TNF-α,tumor necrosis factor-α; VEGF, vascular endothelial growth factor; CVD, cardiovascular disease; PD, Peritoneal dialysis.
Six different inflammatory factors were detected in various group of PD solution. As shown in Fig. 1, the analysis showed that the average levels of inflammatory factors in group H were: MIF (206.8±91.17pg/ml, Fig. 1A), MCP-1 (509.1±296.3pg/ml, Fig. 1B), IL-6 (30.6±20.6pg/ml, Fig. 1C), TGF-β (1.36±0.36ng/ml, Fig. 1D), TNF-ɑ (12.4±4.4pg/ml, Fig. 1E), VEGF (50.9±15.4pg/ml, Fig. 1F). In patients of group L, a trend toward reduced values of MIF, MCP-1 and IL-6 was observed when compared with those in group H. The patients of group L showed an evident decline in MIF, MCP-1 and IL-6 (p<0.01, Fig. 1A–C). In addition, the levels of MIF, MCP-1 and IL-6 in group LA were obviously less than those in subjects of group H (p<0.05, Fig. 1A–C). We also found that the levels of MIF and MCP-1 in group L were obviously less than those in subjects of group HA (p<0.05, Fig. 1 A and B). However, no distinctly difference were found for the values of TGF-β, TNF-ɑ and VEGF among four different groups (p>0.05, Fig. 1D–F). Besides, these inflammatory factors in various subjects of serum has been tested, as shown in Table 1, unlike in the PD solution, no distinctly difference were found for the values of MIF, MCP-1, IL-6, TGF-β, TNF-ɑ and VEGF among four different groups (p>0.05).
Correlation analysis between dialysate/serum inflammatory markers and various clinical and laboratory parameters, MCP-1 (B), IL-6 (C), TGF-β (D), TNF-ɑ (E), VEGF (F). Data are presented as the mean±SD, * p<0.01 vs. Group H; #p<0.05 vs. Group H, #p<0.05 vs. Group HA.")
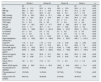
The association of dialysate/serum inflammatory markers with clinical and laboratory parameters was shown in Table 2. There was significantly inversely correlations between dialysate MIF and the level of Total Kt/V (r=−0.25, p=0.03). Additionally, we found that dialysate MCP-1 and IL-6 were inversely correlated with the level of night ultrafiltration volume (NUV) (r=−0.42, p=0.01; r=−0.21, p=0.06, respectively). Whereas the correlation of serum inflammatory markers (MIF, MCP-1, IL-6, TGF-β, TNFα, VEGF) with total Kt/V and NUV were not significant (p>0.05). In this study, we also conducted a Pearson correlation test to determine the relationship between dialysate/serum inflammatory markers and other clinical and laboratory parameters (age, BMI, serum Alb, CRP). As shown in Table 2, we found no significant correlation between these dialysate/serum inflammatory markers and age, BMI, serum Alb, CRP (p>0.05).
Correlation between dialysate/serum inflammatory markers and various laboratory parameters.
| Age | BMI | Serum ALB | CRP | Total Kt/V | D/P Cr | NUV | |
|---|---|---|---|---|---|---|---|
| Dialysate MIF | |||||||
| r | 0.01 | −0.01 | −0.14 | −0.03 | −0.25 | 0.32 | −0.17 |
| p | 0.93 | 0.95 | 0.22 | 0.82 | 0.03 | 0.01 | 0.14 |
| Dialysate MCP-1 | |||||||
| r | −0.09 | 0.18 | −0.22 | 0.01 | 0.11 | 0.47 | −0.42 |
| p | 0.39 | 0.12 | 0.05 | 0.97 | 0.33 | 0.01 | 0.01 |
| Dialysate IL-6 | |||||||
| r | 0.06 | 0.15 | −0.08 | 0.03 | 0.06 | 0.48 | −0.21 |
| p | 0.62 | 0.16 | 0.45 | 0.82 | 0.57 | 0.01 | 0.06 |
| Dialysate TGF-β | |||||||
| r | −0.06 | 0.01 | −0.13 | 0.01 | 0.12 | 0.04 | 0.05 |
| p | 0.61 | 0.94 | 0.24 | 0.91 | 0.28 | 0.70 | 0.63 |
| Dialysate TNF-α | |||||||
| r | 0.17 | −0.13 | 0.01 | −0.12 | 0.08 | 0.22 | −0.16 |
| p | 0.12 | 0.25 | 0.96 | 0.31 | 0.49 | 0.05 | 0.14 |
| Dialysate VEGF | |||||||
| r | −0.04 | −0.04 | −0.14 | 0.04 | 0.03 | 0.02 | −0.04 |
| p | 0.73 | 0.76 | 0.22 | 0.73 | 0.78 | 0.86 | 0.74 |
| Serum MIF | |||||||
| r | 0.03 | 0.14 | 0.03 | 0.03 | −0.02 | 0.04 | 0.04 |
| p | 0.82 | 0.23 | 0.77 | 0.78 | 0.87 | 0.76 | 0.71 |
| Serum MCP-1 | |||||||
| r | −0.02 | −0.11 | −0.04 | 0.08 | −0.16 | 0.01 | −0.11 |
| p | 0.86 | 0.32 | 0.76 | 0.49 | 0.16 | 0.92 | 0.35 |
| Serum IL-6 | |||||||
| r | 0.08 | 0.02 | 0.02 | 0.01 | −0.04 | 0.01 | 0.17 |
| p | 0.45 | 0.88 | 0.83 | 0.92 | 0.69 | 0.92 | 0.13 |
| Serum TGF-β | |||||||
| r | −0.08 | −0.18 | −0.17 | 0.12 | 0.19 | −0.01 | −0.02 |
| p | 0.48 | 0.11 | 0.13 | 0.29 | 0.09 | 0.97 | 0.87 |
| Serum TNF-α | |||||||
| r | 0.34 | −0.12 | 0.02 | −0.08 | −0.02 | 0.03 | −0.03 |
| p | 0.12 | 0.29 | 0.84 | 0.51 | 0.89 | 0.83 | 0.81 |
| Serum VEGF | |||||||
| r | 0.04 | −0.07 | −0.01 | 0.16 | 0.01 | 0.17 | −0.09 |
| p | 0.70 | 0.55 | 0.94 | 0.15 | 0.96 | 0.13 | 0.44 |
Note: NUV, Night ultrafiltration volume; MIF, macrophage migration inhibitory factor; BMI, body mass index; CRP, C-reactive protein; MCP-1, monocyte chemoattractant protein-1; IL-6, interleukin-6; TGF-β, transforming growth factor-β; TNF-α, tumor necrosis factor-α; VEGF, vascular endothelial growth factor.
We conducted a correlation analysis to determine the relationship between PSTR and various dialysate inflammatory parameters. As shown in Table 2, The Pearson correlation test showed that D/P Cr exhibited positive correlations with dialysate MIF (r=0.32, p=0.01), MCP-1 (r=0.47, p=0.01), IL-6 (r=0.48, p=0.01). In contrast to that, no significant correlation was found between D/P Cr and dialysate TGF-β (r=0.04, p=0.70), TNF-ɑ (r=0.22, p=0.05), VEGF (r=0.02, p=0.86). Similarly, there was no obvious correlations between serum inflammatory parameters (MIF, MCP-1, IL-6, TGF-β, TNF-ɑ, VEGF) and D/P Cr (p>0.05).
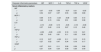
Correlation analysis between serum inflammatory parameters and dialysate inflammatory markersIn this study, we also conducted a Pearson correlation test to explore the relationship between serum inflammatory markers and dialysate inflammatory parameters. As shown in Table 3, the results showed that there was no obvious correlations between serum MIF and dialysate MIF (r=0.07, p=0.54), MCP-1 (r=−0.05, p=0.67), IL-6 (r=0.06, p=0.57), TGF-β (r=−0.07, p=0.55), TNF-ɑ (r=0.01, p=0.96), VEGF (r=−0.05, p=0.68). Furthermore, we found that other serum inflammatory markers (MCP-1, IL-6, TGF-β, TNF-ɑ, VEGF) were not associated with dialysate inflammatory parameters (p>0.05).
Correlation between various serum inflammatory markers and dialysate inflammatory parameters.
| Dialysate inflammatory parameters | MIF | MCP-1 | IL-6 | TGF-β | TNF-α | VEGF |
|---|---|---|---|---|---|---|
| Serum inflammatory markers | ||||||
| MIF | ||||||
| r | 0.07 | −0.05 | 0.06 | −0.07 | 0.01 | −0.05 |
| p | 0.54 | 0.67 | 0.57 | 0.55 | 0.96 | 0.68 |
| MCP-1 | ||||||
| r | 0.08 | 0.16 | −0.24 | −0.08 | 0.05 | 0.10 |
| p | 0.46 | 0.15 | 0.04 | 0.51 | 0.63 | 0.38 |
| IL-6 | ||||||
| r | −0.10 | −0.09 | 0.15 | −0.05 | −0.18 | −0.08 |
| p | 0.37 | 0.40 | 0.16 | 0.67 | 0.12 | 0.48 |
| TGF-β | ||||||
| r | −0.09 | −0.09 | −0.03 | 0.18 | 0.12 | 0.21 |
| p | 0.38 | 0.40 | 0.81 | 0.11 | 0.30 | 0.06 |
| TNF-α | ||||||
| r | 0.13 | 0.07 | −0.08 | 0.11 | 0.15 | 0.15 |
| p | 0.27 | 0.52 | 0.47 | 0.34 | 0.18 | 0.17 |
| VEGF | ||||||
| r | 0.07 | 0.01 | 0.11 | 0.06 | 0.09 | 0.08 |
| p | 0.51 | 0.94 | 0.34 | 0.56 | 0.39 | 0.49 |
Note: MIF, macrophage migration inhibitory factor; MCP-1, monocyte chemoattractant protein-1; IL-6, interleukin-6; TGF-β, transforming growth factor-β; TNF-α, tumor necrosis factor-α; VEGF, vascular endothelial growth factor.
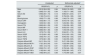
We have performed logistic regression analysis to explore relevant risk factors for the increased PSTR in PD patients. The odds ratios (ORs) for increased PSTR by serum/dialysate inflammatory parameters and various laboratory parameters were shown in Table 4. In the unadjusted regression analysis, dialysis effluent MIF (OR 2.41, 95% CI: 1.39–4.16, p=0.01), dialysis effluent MCP-1 (OR 1.72, 95% CI: 1.26–2.34, p=0.01), Dialysis effluent IL-6 (OR 1.55, 95% CI: 1.12–2.15, p=0.01) were associated with high PSTR condition. While serum inflammatory parameters (serum MIF, MCP-1, IL-6, VEGF, TNFα, TGFβ) and some other parameters (male, age, serum Alb, BMI, blood glucose, serum CRP, hemoglobin, serum PT H) had no significant association with high PSTR condition (p>0.05). After adjusting for age (years), gender (male, female), serum Alb, BMI, blood glucose, serum CRP, hemoglobin, serum PTH and serum inflammatory parameters, the Multivariate logistic regression analysis identified one independent predictive factor of high PSTR condition: dialysis effluent MIF (OR 2.47, 95% CI: 1.08–5.64, p=0.03) (Table 4).
Odds ratios for high peritoneal solute transport rate by MIF and various laboratory parameters.
| Unadjusted | Multivariate-adjusteda | |||
|---|---|---|---|---|
| OR(95%CI) | p | OR(95%CI) | p | |
| Male | 0.91(0.38–2.20) | 0.84 | 0.62(0.15–2.63) | 0.52 |
| Age | 0.99(0.72–1.35) | 0.94 | 1.16(0.71–1.89) | 0.56 |
| Serum Alb | 0.56(0.28–1.15) | 0.12 | 0.86(0.31–2.44) | 0.77 |
| BMI | 1.19(0.70–2.01) | 0.52 | 0.79(0.32–1.99) | 0.63 |
| Blood glucose | 1.00(0.77–1.29) | 0.98 | 1.04(0.70–1.53) | 0.86 |
| Serum CRP | 1.00(0.86–1.17) | 0.99 | 0.97(0.76–1.24) | 0.81 |
| Hemoglobin | 1.23(0.94–1.60) | 0.13 | 1.24(0.84–1.84) | 0.28 |
| Serum PTH | 0.89(0.62–1.29) | 0.55 | 1.03(0.58–1.83) | 0.93 |
| Serum MIF | 0.99(0.99–1.01) | 0.39 | 0.65(0.33–1.30) | 0.23 |
| Serum MCP-1 | 0.88(0.56–1.38) | 0.58 | 1.03(0.48–2.24) | 0.94 |
| Serum IL-6 | 1.07(0.73–1.59) | 0.71 | 0.94(0.51–1.73) | 0.84 |
| Serum VEGF | 1.01(0.69–1.45) | 0.98 | 0.91(0.55–1.50) | 0.69 |
| Serum TNFα | 1.00(0.76–1.31) | 0.99 | 0.84(0.52–1.33) | 0.45 |
| Serum TGFβ | 1.07(0.82–1.38) | 0.64 | 1.34(0.56–3.20) | 0.51 |
| Dialysis effluent MIF | 2.41(1.39–4.16) | 0.01 | 2.47(1.08–5.64) | 0.03 |
| Dialysis effluent MCP-1 | 1.72(1.26–2.34) | 0.01 | 1.52(0.96–2.38) | 0.07 |
| Dialysis effluent IL-6 | 1.55(1.12–2.15) | 0.01 | 1.43(0.81–2.52) | 0.22 |
| Dialysis effluent VEGF | 0.99(0.72–1.37) | 0.97 | 0.79(0.48–1.28) | 0.34 |
| Dialysis effluent TNFα | 1.16(0.94–1.43) | 0.16 | 0.93(0.60–1.43) | 0.73 |
| Dialysis effluent TGFβ | 1.48(0.99–2.21) | 0.06 | 1.77(0.96–3.26) | 0.07 |
The present study showed that dialysis effluent inflammatory factors was associated with high PSTR condition. Furthermore, elevated dialysis effluent MIF level was an independent risk factor for high PSTR in subjects with PD treatment. Conversely, we found that serum inflammatory factors had no impact on the PSTR status in PD patients.
ESRD was a serious public health problem with very high mortality and morbidity. PD was a common type of renal replacement therapy way, an estimated 11% of patients receiving longterm dialysis worldwide were treated with PD.13 Favorable PD therapy could effectively enhance their quality of life. Based on the result of PET, four different types of PSTR has been divided. For these subjects with high PSTR, they quickly absorbed glucose with a rapid loss of osmotic gradients, this would lead to less effective clearance fluid and metabolic toxin.2
Ultrafiltration failure (UFF) was a serious complication of PD that may lead to technique failure. The risk of developing a UFF was assumed to be approximately 35% after 6 years PD therapy. The most common reason for the mechanisms of UFF was an increase in PSTR, ultimately leading to a rapid loss of the osmotic gradient.14 It was speculated that low pH, high glucose, and the formation of advanced glycosylation end products in PD solution could damage peritoneal membrane and influence transcellular and transcapillary water transport in PD patients.15 Previous research has demonstrated that high PSRT was associated with poor clinical outcomes, which was due to fluid overload, inflammation and malnutrition. A meta-analysis including 6648 PD patients showed that a higher peritoneal small-solute transport rate was associated with a significantly higher mortality and a trend of higher technique failure.16 Therefore the exploration of the mechanisms and methods to prevent patient from to be high transporters, thus preserving peritoneal function could provide very important clinic significance.
Recent research has revealed the relationship between PSTR and intraperitoneal cytokines. Cho et al. found that PD solution IL-6 but not serum IL-6 was associated with high PSTR.17 In line with this, we found that there was no association between serum inflammatory factors and PSTR status in PD patients, it suggested a possible link between PSTR and peritoneal local inflammation, rather than systemic inflammation. It has been verified that the bioincompatible PD dialysate itself could cause peritoneal membrane inflammation, leading to peritoneal functional decline and ultrafiltration failure. Many cytokines were involved in these processes. Such as IL-6, TGF-β, VEGF and MCP-1. Cho et al. found that dialysate IL-6 concentration increased with longer PD duration and was a significant, independent predictor of high PSTR.18 Similarly, changes in peritoneal transport rate on PD was found to be related to be linked with inflammation.19 An important novel finding of our study was that, after controlling by confounders such as gender, blood glucose, blood pressure, hemoglobin and serum inflammatory markers, multivariate logistic regression analysis showed that elevated dialysis effluent MIF increased the risk of developing for high PSTR in PD patients.
MIF was discovered almost 40 years ago, a rapidly growing amount of evidence supported the notion that MIF was an integral component of host inflammatory responses. Investigators have provided evidence that MIF could directly or indirectly promote the production or expression of a large panel of inflammatory factors (e.g. TNFα, IL-2, IL-6).10 Previous studies in mice and in humans demonstrated the therapeutic potential of MIF inhibition for chronic inflammatory autoimmune disease (such as systemic lupus erythematosus).20 Additionally, the impact of MIF on renal injury has been gaining prominence. Li et al. found that MIF might be pathogenic in AKI and the levels of plasma and urinary MIF correlated with the progression and regression of AKI.21 Conversely, a study performed by Stoppe et al. provided a renoprotective role of MIF in experimental ischemia-reperfusion renal injury, and high MIF in cardiac surgery patients was associated with a reduced incidence of AKI.22 The association between MIF and PD so far has not received adequate research. In this study, we have confirmed for the first time that dialysis effluent MIF mediating local microinflammation increased the risk of developing for high PSTR in PD patients.
The detailed mechanistic aspects that underlie the relationship between dialysis effluent inflammatory markers and increased PSTR was not completely clear. Some reasons might account for this. During the PD process, repeatedly exposure to inflammatory stimuli such as peritonitis and advanced glycation end products might lead to the increase of PSTR, and dialysis effluent MIF and MCP-1 were important markers of inflammation. It suggested that control of inflammation might be favorable to peritoneal transport rate maintenance. On the other side, recently study reported that MIF possessed significant angiogenic effect.23 it suggested that dialysis effluent MIF might promote angiogenesis, which in turn result in an increased peritoneal vascular surface area and a larger small pore area in the local peritoneal cavity, ultimately lead to the increase of PSTR.
This study has several potential limitations. Firstly, the included subjects were limited number and from a single PD center. Second, the cross-sectional design of our study limited the power to infer the relationship between PD effluent inflammatory factors and PSTR. Thirdly, the relationships between inflammatory cytokines and peritoneal function has been studied previously while the results was inconsistent with our study, such as dialysis effluent IL-6, TNFα and TGFβ. In future study, more inflammatory factors both in PD effluent and plasma should be examined.
ConclusionOur study indicated that elevated dialysis effluent MIF, MCP-1 and IL-6 levels were associated with increased PSTR. Additionally, we found that elevated dialysis effluent MIF level was an independent risk factor for high PSTR in PD patients. However, the specific mechanisms between peritoneal local microinflammation and increased PSTR was still obscure, multicenter prospective study should be performed in future study.
Compliance with ethical standardsNone of the authors is in any condition that may represent a potential conflict of interest.
Data availabilityThe data used to support the findings of this study are available from the first author and corresponding author upon request.
Authors’ contributionX.R.L., X.C.L. and S.K.Y. conceived of the study, X.R.L., B.G.Z. and J.T. performed the data collection and data entry. S.K.Y., W.L. and X.R.L. analyzed the data and wrote the manuscript. All authors read and approved the final manuscript.
Competing interestsNone of the authors is in any condition that may represent a potential conflict of interest.
This study was supported by the Scientific Research Project of Education Department of Hunan Province (17C1427), the Hunan Provincial Health Commission Project (202103050178). Hunan Provincial Clinical medical technology innovation guide project (2020SK53601).


