


Patients awaiting kidney transplantation are recommended to undergo systematic oral glucose tolerance tests (OGTT) to detect glucose metabolic alterations (GMA) that heighten the risk of posttransplant diabetes.
Aims(a) To determine GMA prevalence and metabolic phenotypes; (b) assess optimal screening strategies for abnormal OGTT detection; and (c) evaluate one-year GMA trajectory through repeated OGTT during the waiting list period.
MethodsOGTTs were conducted on 182 wait-listed patients without diabetes, with 46 undergoing a repeat test after one year.
ResultsImpaired glucose tolerance (IGT) was most common (23.1%). Undiagnosed diabetes (uDM) and isolated impaired fasting glucose (IFG) were observed in 6% and 4.4%, respectively. Patients with IGT/uDM exhibited decreased insulin secretion, while isolated IFG patients showed reduced insulin sensitivity. Abnormal OGTT correlated with statin therapy [OR 2.4 (1.17–4.9); P=0.02], fasting glucose [OR 1.03 (1.01–1.06); P=.02], and age [OR 1.03 (1–1.06); P=0.048]. Patients below age (51 years) and fasting glucose (100mg/dL) thresholds, not on statins, had lower odds of abnormal OGTT potentially reducing routine testing needs by 26%. Transition from normal to abnormal OGTT after one year correlated with higher baseline BMI [27.5kg/m2 (IQR 25.6–31.7) vs. 24.1kg/m2 (IQR 21.3–25.8); P=0.04], lower insulin sensitivity [Matsuda index 15.7 (IQR 11.4–24.5) vs. 22.9 (IQR 15.5–37); P=0.049], and statin use (75% vs. 32%; P=0.047).
ConclusionsOne-third of wait-listed patients without manifest diabetes exhibit abnormal OGTT. Age, fasting glucose, and statin use increase risk. Patients below age and fasting glucose thresholds, without statins, have low abnormal OGTT likelihood, potentially reducing routine testing. Annual OGTT may benefit patients initially with normal results, if overweight/obese, or on statins.
Se recomienda que los pacientes en lista de espera de trasplante renal se sometan sistemáticamente a una sobrecarga oral de glucosa (SOG) para detectar alteraciones del metabolismo de la glucosa (AMG), que aumentan el riesgo de diabetes postrasplante.
Objetivosa) Determinar la prevalencia de las AMG y los fenotipos metabólicos; b) evaluar las estrategias óptimas de cribado para la detección de alteraciones mediante la SOG, y c) analizar la evolución de AMG al año mediante SOG repetidas durante el período en lista de espera.
MétodosSe realizó SOG a 182 pacientes en lista de espera sin diabetes; en 46 de ellos se repitió al año.
ResultadosLa intolerancia a la glucosa (IGT) fue la alteración más frecuente (23,1%). Se detectó diabetes oculta (DMoc) y glucemia basal alterada (GBA) aislada en el 6% y el 4,4% de los pacientes, respectivamente. Los pacientes con IGT/DMoc mostraron una menor secreción de insulina, mientras que aquellos con GBA aislada presentaron menor sensibilidad a la insulina. Una SOG patológica se asoció con tratamiento con estatinas (OR: 2,4; IC95%: 1,17-4,9; p=0,02), glucosa en ayunas (OR: 1,03; IC95%: 1,01-1,06; p=0,02) y edad (OR: 1,03; IC95%: 1-1,06; p=0,048). Los pacientes de menor edad (51años), glucosa en ayunas (<100mg/dl) y sin tratamiento con estatinas presentaron menor probabilidad de SOG patológica, lo que podría reducir pruebas rutinarias en un 26%. La transición de SOG normal a patológica al año se asoció con mayor IMC basal (27,5kg/m2 [RIC: 25,6-31,7] frente a 24,1kg/m2 [RIC: 21,3-25,8]; p=0,04), menor sensibilidad a la insulina (índice de Matsuda: 15,7 [RIC: 11,4-24,5] vs. 22,9 [RIC: 15,5-37]; p=0,049) y uso de estatinas (75% vs. 32%; p=0,047).
ConclusionesUn tercio de los pacientes sin diabetes manifiesta en lista de espera presentan una SOG patológica. La edad, la glucemia en ayunas y el uso de estatinas aumentan el riesgo. Los pacientes más jóvenes, con menor glucemia en ayunas y sin estatinas tienen una baja probabilidad de SOG patológica, lo que podría reducir pruebas de rutina. Una SOG anual podría resultar útil en pacientes inicialmente normales que presenten sobrepeso/obesidad o reciben estatinas.
Post-transplant diabetes and prediabetes are common occurrences following kidney transplantation, significantly increasing the risk of cardiovascular events and mortality.1–4 Identifying at-risk patients prior to transplantation is essential as it allows for informed risk counseling, targeted interventions to address modifiable risk factors, and the customization of immunosuppressive therapy without compromising efficacy.1,2
In patients with end-stage renal disease, fasting glucose is less reliable than in the general population due to reduced renal gluconeogenesis, and HbA1c levels may be falsely low.2,5 Oral glucose tolerance test (OGTT)-based studies performed during pretransplant workup6 have reported a prevalence of undiagnosed diabetes mellitus (uDM) between 3% and 8%, and impaired glucose tolerance (IGT) ranging from 20% to 30%,7,9–12 both associated with higher post-transplant glucose metabolic alterations (GMA).7–10 Therefore, the International Consensus on Post-transplant Diabetes2 and the 2020 KDIGO Guidelines5 recommend OGTT screening during pretransplant evaluation. Nevertheless, a recent survey by the ERA Descartes Group revealed significant variability in screening, prevention, and treatment of GMA among transplant centers, with only 13% routinely performing the recommended OGTT prior to transplantation.13
Limited research has investigated the phenotypic characterization of glucose metabolism in non-diabetic transplant candidates. Compared to those with normal glucose tolerance, patients with GMA frequently demonstrate reduced insulin sensitivity and impaired β-cell function.11 Moreover, post-transplant GMA are often observed in individuals who already exhibit inefficient insulin secretion while on the transplant waiting list (WL).7 These findings highlight a potential window for pre-transplant interventions aimed at mitigating both pre- and post-transplant metabolic risk.
Few studies have explored how clinical data might guide OGTT screening in transplant candidates. A Norwegian study found that OGTT in patients with fasting glucose 92–125mg/dL identified 90% of diabetes cases,12 while an Australian study showed poor predictive value of fasting glucose alone (AUC 0.66).10 Moreover, no data currently inform how to monitor glucose abnormalities over time in waitlisted patients.13
The objectives of this study, conducted in a cohort of patients without established diabetes and undergoing OGTT during kidney transplant evaluation, were as follows: (a) to determine the prevalence and metabolic phenotypes of GMA; (b) to identify clinical and biochemical predictors of abnormal OGTT results and assess optimal screening strategies; and (c) to evaluate the one-year trajectory of glucose metabolism abnormalities through repeated OGTT assessments.
MethodsStudy designBetween 22 November 2011 and 29 July 2019, non-diabetic renal transplant candidates at Hospital Universitario de Canarias underwent a routine OGTT annually until transplantation. A total of 182 patients were initially screened and 46 underwent a repeat OGTT after one year in the WL. A total of 115 patients from this cohort underwent a follow-up OGTT one year after transplantation to evaluate risk factors associated with post-transplant GMA, as previously reported.7
Adult patients (≥18 years) in the WL without manifest diabetes were included. All included patients were on renal replacement therapy except for two who were preemptively included in the WL. Exclusion criteria were patients on hypoglycemic agents, with a diagnosis of manifest diabetes defined according to ADA criteria (fasting glucose≥126mg/dL on two determinations; or glycated hemoglobin (HbA1c)≥6.5%),6 or on the multi-organ transplant WL. Patients who lost their graft were not included in the study upon returning to WL due to the modifying effect of immunosuppressive treatment.
Study variablesA standard OGTT was performed using a 75g glucose load following a minimum 8-h fast. Plasma glucose and insulin levels were measured at 0, 30, and 120min. Based on the results, patients were categorized into the following groups: normal; isolated impaired fasting glucose (IFG), defined as fasting glucose ≥100 and <126mg/dL; IGT, defined as 120-min glucose ≥140 and <200mg/dL; or uDM, defined as 120-min glucose ≥200mg/dL, in accordance with the ADA criteria.6 Patients who presented both IFG and IGT were classified within the IGT group.
Beta-cell function and insulin sensitivity were evaluated using the following indices:
- 1.
Insulin sensitivity indices:
- -
HOMA-IR (Homeostatic Model Assessment of Insulin Resistance): Calculated as (Glc0×Ins0)/22.5 where Glc0 and Ins0 refer to glucose and insulin fasting values.14
- -
Matsuda Insulin Sensitivity Index: Calculated as 10,000/√[(Glc0×Ins0)×(mean OGTT plasma glucose×mean OGTT plasma insulin)].15
- 2.
Insulin secretion indices:
- -
Insulinogenic index (IGI; First-Phase Insulin Secretion): Calculated as (Ins30−Ins0)/(Glc30−Glc0)16 where Glc0 and Ins0 refer to glucose and insulin fasting values and Glc30 and Ins30 to 30min after OGTT.
- -
Disposition Index: Calculated as Matsuda Insulin Sensitivity Index×Insulinogenic Index. This index assesses the relationship between insulin sensitivity and secretion; a low value indicates that insulin secretion is insufficient to compensate for existing insulin resistance.7,11
Clinical, laboratory, and treatment-related variables were collected from the patients’ medical records. Additionally, cardiovascular events such as ischemic heart disease, stroke, and peripheral vascular disease were documented.
Statistical analysisCategorical variables were expressed as percentages, while quantitative variables were presented as median [interquartile range (IQR)] or mean±standard deviation, as appropriate.
Comparisons between two groups were performed using the Student's t-test or the Mann–Whitney U test, depending on the distribution of the data. Categorical variables were compared using the Chi-square test or Fisher's exact test, as appropriate.
Comparisons among more than two groups were conducted using ANOVA or the Kruskal–Wallis test, as appropriate. Post hoc analysis was performed using Scheffé’s method or Dunn's test, respectively.
A multivariate binary logistic regression analysis was conducted to identify independent factors associated with a pathological OGTT. Variables with a P value of <0.2 in univariate analysis were included as predictors. A backward stepwise selection method was applied, and model calibration was assessed using the Hosmer–Lemeshow goodness-of-fit test. ROC curves were constructed, and the area under the curve (AUC) was estimated to evaluate the predictive performance of significant variables. The best discriminatory threshold was determined using the Youden Index (sensitivity+specificity−1).
The evolution of GMA was described in patients who underwent a repeated OGTT after one year in the WL. Patients who had normal glucose metabolism at baseline and showed worsening toward GMA were compared to those who remained stable.
All statistical analyses were performed using SPSS software, version 29.01 (IBM SPSS Statistics). A P value of <0.05 was considered statistically significant.
The study was conducted in accordance with the principles of the Helsinki Declaration and received approval from the Hospital Universitario de Canarias Ethics Committee (CEIm). Informed consent was obtained from all patients included in the study.
ResultsOf the total 199 patients, 182 were included, of whom 46 had a repeated OGTT after one year in the WL (Fig. 1).

As shown in Fig. 2, one-third of the patients presented with some form of GMA at study entry, the majority of whom had IGT (23.1%), followed by uDM (6%), and isolated IFG (4.4%). Among the 42 patients with IGT, 7 (16.7%) also exhibited IFG.

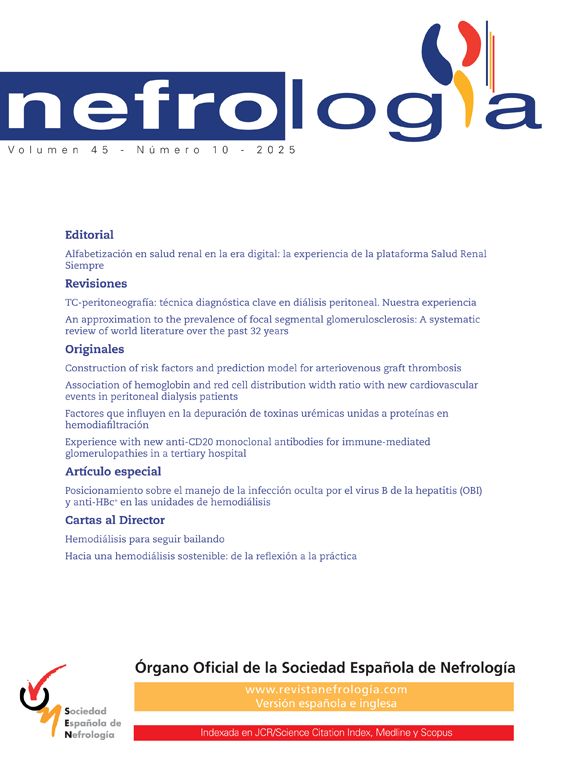
Baseline characteristics are presented in Table 1. Chronic hemodialysis was the predominant modality of renal replacement therapy across all groups; however, patients with uDM tended to receive peritoneal dialysis more frequently. The use of statins was significantly higher among patients with any GMA compared with those with normal glucose tolerance.
Baseline characteristics of patients distributed across the four glucose metabolic alterations groups.
| Normal(n=121) | IFG(n=8) | IGT(n=42) | uDM(n=11) | Total(n=182) | P value | |
|---|---|---|---|---|---|---|
| Age (years) | 49 (40.5–59) | 49.5 (40.8–65.8) | 54 (43.8–65.3) | 58 (40–64) | 51 (42–62) | 0.215 |
| Male gender (%) | 82 (67.8%) | 6 (75%) | 29 (69%) | 6 (54.5%) | 123 (67.6%) | 0.8 |
| Race | 112C; 3H; 1NWA; 3I; 2BA | 8C | 38C; 3H; 1BA | 11C | 169C; 6H; 1NWA; 3I; 3BA | 0.95 |
| Family history of DM | 37 (30.6%) | 3 (37.5%) | 9 (21.4%) | 4 (36.4%) | 53 (29.1%) | 0.6 |
| HD/PD/Preemptive | 95/25/1 | 5; 3; 0 | 37/5/0 | 5; 5; 1 | 142/38/2 | 0.07 |
| Time on dialysis (months) | 25 (15–44.5) | 50 (14–65) | 27.5 (17.3–47) | 16.5 (2.8–33.8) | 26 (15–47) | 0.239 |
| CKD-EPI (ml/min/1.73m2) | 7 (5.6–8.8) | 7 (5.4–8.5) | 7.1(5–8.8) | 6.5 (5–10) | 7 (5.5–8.7) | 0.988 |
| BMI (kg/m2) | 26,1±4.8 | 29.8±3.1 | 27.4±5 | 27.2±5.8 | 26.6±4.9 | 0.1 |
| Total cholesterol (mg/dL) | 161.3±36.1 | 145.4±21.2 | 161±41 | 164.2±26.5 | 160.7±36.2 | 0.669 |
| Triglycerides (mg/dL) | 117 (85–164) | 158 (135.8–235.8) | 125 (83.3–166.5) | 199 (138–223) | 126 (86.8–174.2) | 0.052 |
| HDL cholesterol (mg/dL) | 43 (34–57) | 32 (30–46) | 46.5 (35–57.3) | 49 (37–56) | 43 (34–56.3) | 0.16 |
| LDL cholesterol (mg/dL) | 83 (64–104) | 76.5 (60.3–81.3) | 85 (68.5–98.3) | 67 (63–93) | 82.5 (65.3–103) | 0.421 |
| Statins (%) | 50 (41.3%) | 8 (100%) | 28 (66.7%) | 9 (81.8%) | 95 (52.2%) | <0.001 |
| Smoking (%) | 16 (13.2%) | 0 (0%) | 9 (21.4%) | 3 (27.3%) | 18 (15.4%) | 0.24 |
| SBP (mmHg) | 132.5 (120–140) | 138 (127–141) | 128 (119–140) | 131 (120–155) | 131 (120–140) | 0.545 |
| DBP (mmHg) | 76 (65–83) | 70 (64–90) | 70 (64–83) | 77 (70–80) | 76 (65–83) | 0.983 |
| VHC (%) | 6/115 (5.2%) | 0/8 (0%) | 2/38 (5.3%) | 0/10 (0%) | 8/171 (4.7%) | 0.8 |
| CV events (%) | 12/119 (10.1%) | 0/8 (0%) | 9/42 (21.4%) | 1/10 (10%) | 22/179 (12.3%) | 0.2 |
IFG: impaired fasting glucose; IGT: impaired glucose tolerance; uDM: unknown diabetes; HD: hemodialysis; PD: peritoneal dialysis; BMI: body mass index; SBP: systolic blood pressure; DBP: diastolic blood pressure; VHC: C virus hepatitis. Race: C: Caucasian; H: Hispanic; NWA: North West African; I: Indian; BA: Black African.
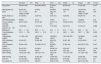
OGTT-derived parameters of glucose metabolism are shown in Table 2 and Fig. 3. Isolated IFG was mainly associated with reduced insulin sensitivity (Fig 3A, B), whereas IGT and uDM were characterized by impaired insulin secretion (Fig. 3C). Despite these differences, all GMA categories exhibited a significant reduction in the disposition index (Fig. 3D), indicating and overall imbalance between insulin secretion and sensitivity. HbA1c values were comparable among groups. BMI correlated inversely with insulin sensitivity (ρ=−0.49 for Matsuda index; P<0.001) but not with insulin secretion (ρ=0.15; P=0.053).
Parameters of glucose metabolism in the fasting state and following an OGTT across different glucose metabolic alterations groups.
| Normal (n=121) | IFG (n=8) | IGT (n=42) | uDM (n=11) | Total (n=182) | P value | |
|---|---|---|---|---|---|---|
| HbA1c (%) | 5 (4.9–5.2) | 5.4 (5.1–5.6) | 5.1 (4.9–5.4) | 5.3 (4.8–6) | 5.1 (4.9–5.3) | 0.087 |
| Glucose 0 (mg/dL) | 82 (76–88) | 103 (100–111.3) | 85 (78.8–93.3) | 89 (79–110) | 83 (77–90) | <0.001a; 0.053c; 0.003d |
| Glucose 30 (mg/dL) | 132 (116.5–149) | 174 (152.8–193) | 152 (134.8 –173.8) | 171 (161–195) | 139 (121–162) | 0.001a,b; <0.001c |
| Glucose 120 (mg/dL) | 114 (93.5–128) | 119 (98.5–132.75) | 157 (144.8–170.5) | 249 (221–272) | 126 (103–144) | <0.001b,c,e; 0.001d |
| Insulin 0 (μU/mL) | 7.4 (5.3–7.4) | 14 (12.3–23) | 7.4 (5.3–11.2) | 7.1 (5.7–10.3) | 7.6 (5.3–11.4) | 0.002a; 0.004d; 0.018e |
| Insulin 30 (μU/mL) | 42.6 (26.2–62.2) | 75.8 (43.7–100) | 36.4 (24.1–58.3) | 22.3 (12.5–42.7) | 41.4 (24.9–61.6) | 0.045d; 0.002e |
| Insulin 120 (μU/mL) | 33.5 (21.9–54.5) | 83.6 (34.1–138.8) | 44.3 (34.5–92.5) | 49.3 (24.8–84.9) | 38.7 (25.2–61.4) | 0.034a; 0.007b |
| HOMA-IR | 1.4 (1–2.1) | 3.4 (3.2–6.2) | 1.5 (1–2.3) | 1.7 (1.1–2.8) | 1.5 (1–2.3) | <0.001a; 0.003d; 0.028e |
| Insulinogenic Index | 12.1 (7.2–21.9) | 15 (10.3–25.6) | 7.4 (4.8–13) | 3.4 (2.2–7.3) | 10.2 (6.4–17.8) | <0.001c; 0.012b; 0.002e |
| Matsuda Insulin Sensitivity Index | 17.6 (12.6 –25.7) | 7.2 (6.8–9) | 16.1 (10.1–22) | 12.6 (10.1–23.5) | 16.4 (11.4–24.1) | <0.001a; 0.012d |
| Disposition Index | 223.7 (141.8–320.9) | 119.4 (95.4–137.5) | 124.9 (78.2–175.7) | 46.3 (32.7–79.2) | 168.4 (110.2–268) | 0.018a; <0.001b,c; 0.043f |
IFG: impaired fasting glucose; IGT: impaired glucose tolerance; uDM: unknown diabetes. Glucose 0, Gluc 30, Glucose 120, Insulin 0, Insulin 30 and Insulin 120: fasting, and 30- and 120-min plasma glucose and insulin levels after an OGTT: oral glucose tolerance tests.

Table 3 compares the group with pathological OGTT (IGT or uDM) against those exhibiting normal OGTT (Normal glucose metabolism plus isolated IFG). Individuals with a pathological OGTT were older, had higher baseline glucose levels, lower insulin secretion (as measured by the Insulinogenic Index) and were more frequently receiving statin therapy. Furthermore, this group showed a trend toward an increased incidence of cardiovascular events.
Comparison of patients with abnormal OGTT (glucose intolerance or unknown diabetes), with those with normal OGTT.
| Normal OGTT(n=129) | Abnormal OGTT(n=53) | P value | |
|---|---|---|---|
| Age (years) | 49 (40.5–59) | 55 (43.5–64.5) | 0.035 |
| Male gender (%) | 88/129 (68.2) | 35/53 (66) | 0.8 |
| Time on dialysis (months) | 26 (15–47.6) | 26.5 (14.8–47) | 0.7 |
| PD (%) | 28/128 (21.9) | 10/53 (18.9) | 0.7 |
| Family history of DM (%) | 40/129 (31) | 13/53 (24.5) | 0.5 |
| BMI (kg/m2) | 25.8 (23.4–29) | 26.7 (23.3–31.3) | 0.26 |
| Fasting glucose (mg/dL) | 83 (76–89) | 86 (79–95) | 0.03 |
| 30mn glucose (mg/dL) | 135 (118–151) | 158 (139–175) | <0.001 |
| 120mn glucose (mg/dL) | 114 (94–128) | 160 (147–196.5) | <0.001 |
| HOMA-IR | 1.52 (1.05–2.49) | 1.56 (1–2.3) | 0.9 |
| Insulinogenic Index | 12.06 (7.5–21.9) | 7.1 (3.65–11.5) | <0.001 |
| Matsuda Insulin Sensitivity Index | 16.8 (11.7–25.2) | 16 (10.1–22.2) | 0.1 |
| Disposition Index | 203 (138.2–311.97) | 105.1 (70–170.7) | <0.001 |
| HbA1c (%) | 5.1 (4.9–5.3) | 5.1 (4.9–5.4) | 0.2 |
| Total cholesterol (mg/dL) | 162 (134–185) | 157.5 (142.3–171.5) | 0.7 |
| Triglycerides (mg/dL) | 122 (86.5–166.5) | 139 (88–185) | 0.4 |
| HDL cholesterol (mg/dL) | 42 (34–56.5) | 47 (35–56.5) | 0.3 |
| LDL cholesterol (mg/dL) | 82 (63.8–104) | 84 (66–96.5) | 0.8 |
| Statins (%) | 58/129 (45) | 37/53 (69.3) | 0.003 |
| CKD-EPI (ml/min/1.73m2) | 7 (5.6–8.6) | 7 (5–8.8) | 0.97 |
| CV events | 12/127 (9.4%) | 10/53 (18.9%) | 0.09 |
OGTT: oral glucose tolerance tests; PD: peritoneal dialysis; DM: diabetes mellitus; BMI: body mass index; Fasting, and 30- and 120-min plasma glucose and insulin levels after an OGTT; CV events: cardiovascular events.
After adjustment for potential confounders in the multivariate model (Model 1, Table 4), statin therapy was the only independent predictor of abnormal OGTT. However, statin users were older, had higher BMI, and higher fasting glucose levels (Supplementary Table 1), suggesting potential prescription bias. When statin therapy was excluded, age and fasting glucose remained significantly associated with abnormal OGTT (Model 2, Table 4).
Dichotomous logistic regression analysis. Dependent variable: Normal or abnormal OGTT. Adjusted by BMI and HbA1c.
| OR | 95% CI | P value | |
|---|---|---|---|
| Model 1 | |||
| Age (years) | 1.025 | 0.996–1.053 | 0.088 |
| Therapy with statins | 2.405 | 1.169–4.947 | 0.017 |
| Fasting glucose (mg/dL) | 1.025 | 0.997–1.054 | 0.080 |
| Model 2 | |||
| Age (years) | 1.028 | 1.000–1.056 | 0.048 |
| Fasting glucose (mg/dL) | 1.032 | 1.005–1.061 | 0.021 |
OGTT: oral glucose tolerance test; BMI: body mass index.
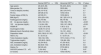
Diagnostic performance was modest for age and fasting glucose (AUC 0.61 for both; Table 5). Patients below the identified thresholds (age<51 years and fasting glucose<100mg/dL) and not receiving statins had a markedly lower probability of abnormal OGTT (7.7% vs. 38.5%; OR 0.13; 95% CI 0.05–0.40). This risk-based approach could potentially reduce the need for routine OGTT in approximately 26% of wait-listed candidates.
Diagnostic tests of age and fasting glucose to predict abnormal OGTT.
| TEST | AUC | Sensitivity | Especificity | PPV | NPV | Youden index | NND |
|---|---|---|---|---|---|---|---|
| AGE (cut-off 51.5 years) | 0.61 (0.52–0.7) | 0.65 | 0.58 | 0.61 | 0.62 | 0.22 | 4.42 |
| FASTING GLUCOSE (cut-off 100.5mg/dL) | 0.61 (0.52–0.7) | 0.24 | 0.98 | 0.91 | 0.56 | 0.22 | 4.6 |
OGTT: oral glucose tolerance test.
The progression of glucose metabolism abnormalities (GMA) over one year was assessed using a repeat OGTT (Fig. 4). Although the overall distribution of GMA categories at one year showed minimal change, 17 patients (37%) exhibited transitions: 10 experienced deterioration, whereas 7 showed improvement. None of the patients with normal glucose tolerance progressed to overt diabetes (uDM); however, 8 developed a prediabetic state (7 IGT and 1 isolated IFG). Those who progressed (n=8) had a significantly higher baseline BMI (27.5kg/m2 [IQR 25.6–31.7] vs. 24.1kg/m2 [IQR 21.3–25.8]; P=0.04), lower insulin sensitivity (Matsuda index 15.7 [IQR 11.4–24.5] vs. 22.9 [IQR 15.5–37]; P=0.049), and a higher proportion were treated with statins (75% vs. 32%; P=0.047) compared to those who remained with normal glucose metabolism (n=17).
 after one year on the kidney transplant waiting list. Those who progressed are indicated with red arrows, whereas those who improved are marked with green arrows. N; normal; IFG: impaired fasting glucose; IGT: impaired glucose tolerance, uDM: undiagnosed diabetes mellitus.")
Evolution glucose metabolism abnormalities (GMA) after one year on the kidney transplant waiting list. Those who progressed are indicated with red arrows, whereas those who improved are marked with green arrows. N; normal; IFG: impaired fasting glucose; IGT: impaired glucose tolerance, uDM: undiagnosed diabetes mellitus.
The majority of patients with isolated IFG or IGT showed reversion to normal tolerance at one year. There were no significant differences in any of the evaluated risk parameters between patients who reverted (n=7) and those who did not (n=5). Only one patient progressed to uDM, which occurred in an individual with baseline IGT.
DiscussionIn this cohort of non-diabetic patients on the kidney transplant WL, we found that approximately one in three patients had some form of GMA (Fig. 1). Among these, only 4% exhibited IFG, while the remaining 29% showed abnormalities on the OGTT: 23% had IGT and 6% met criteria for uDM. These findings are consistent with previous studies in this population, falling within the reported prevalence range.9–12 Importantly, the presence of IGT or uDM during pre-transplant evaluation is linked to a higher risk of developing post-transplant GMA.7–10 Given their potential reversibility, these results emphasize the importance of initiating preventive measures against post-transplant GMA prior to transplantation.
We employed OGTT with plasma insulin level determination for more accurate individual assessment of insulin sensitivity and secretion compared to single-point fasting values.11 These indices help delineate pathomechanisms of disturbed glucose metabolism useful for interventions and risk reduction. Patients with IGT or uDM exhibited a similar phenotype characterized by significantly lower insulin secretion compared to those with normal tolerance (Fig. 3C). Notably, urea and other uremic toxins decrease insulin secretion by increasing oxidative stress in beta cells.17 Patients with isolated IFG demonstrated normal insulin secretion (Fig. 3C) with markedly lower insulin sensitivity (Fig. 3A and B), consistent with insulin resistance at the hepatic level leading to elevated fasting plasma glucose.18 Lastly, all groups with GMA showed a significant decrease in the disposition index, indicating inefficient insulin secretion relative to insulin resistance which is common in the uremic state.19 Therefore, interventions enhancing insulin sensitivity, such as therapeutic exercise20 and weight control, may help prevent post-transplant GMA.
Owing to the limited diagnostic sensitivity of fasting glucose and HbA1c, the OGTT is recommended as a screening tool during pre-transplant evaluation.2,5 However, its implementation increases logistical complexity and resource utilization, and in a European survey was routinely performed in only 13% of centers.13 Thus, studies focusing on clinical and laboratory data that can potentially obviate the need for routine OGTT would streamline pre-transplant assessments. Patients with abnormal OGTT results (IGT or uDM) tended to be older, exhibited higher fasting plasma glucose levels, and were more frequently treated with statins (Table 3). Notably, in multivariate analysis, statin therapy emerged as the only variable significantly associated with an increased risk of abnormal OGTT (Table 4). The potential diabetogenic effect of statins, though outweighed by their cardiovascular benefits, has been extensively investigated. Two recent meta-analyses reported an increased risk of developing diabetes of 9–12% in randomized clinical trials21 and up to 44% in observational studies.22 In a prospective study, statin therapy was associated with a 46% increased risk of type 2 diabetes, attributed to reduced insulin sensitivity and impaired insulin secretion.23 In murine models, β-cell-specific deletion of HMG-CoA reductase led to decreased β-cell mass and impaired insulin secretion.24 However, in the present study, differences in age and BMI between statin users and non-users (Supplementary Table 1) limit the ability to draw definitive conclusions about the independent diabetogenic effect of statins. Given that statin therapy independently increases the risk of post-transplant diabetes,25 routine OGTT screening may be warranted in statin-treated patients awaiting transplantation to enable timely non-pharmacological and/or pharmacological interventions. In all cases, patients identified with GMA should be advised to initiate non-pharmacological interventions, including dietary modification and increased physical activity.
Excluding statin therapy from the logistic regression model, age and fasting glucose remained significantly associated with abnormal OGTT (Table 4, Model 2), showing modest diagnostic accuracy in the ROC curve analysis (Table 5). However, patients who lacked all three risk factors (age and fasting glucose below optimal cut-offs, and no statin therapy) had substantially lower odds of abnormal OGTT (0.13; 95% CI: 0.05–0.4). This risk-stratified approach could potentially reduce the need for routine OGTT in 26% of waitlisted patients in our study.
According to ERA Descartes survey data, 57% of centers repeat some screening method annually, and there is little data on the longitudinal course of glucose metabolism in waitlisted patients.2,13 In our study, only 22% showed worsening after one year, mainly to prediabetes (Fig. 4). Notably, worsening among patients initially with normal metabolism was associated with BMI, reduced insulin sensitivity, and statin use. These findings suggest that annual OGTT screening may be justified in patients with an initially normal OGTT who are overweight or obese, or on statin therapy. Conversely, most patients with prediabetes (IFG or IGT) reverted to normal glucose tolerance, without any accompanying differences in the study's risk factors. Given the small sample size (n=12; Fig. 4), additional studies are warranted in a larger population.
This study has limitations, including its cross-sectional design, which precludes causal inference between clinical predictors and abnormal OGTT. Moreover, the high transplantation rate limited follow-up OGTT availability, warranting cautious interpretation. Additionally, the reproducibility of OGTT is limited, as repeated test in the same individual may yield discordant results.26 Lastly, the predominantly Caucasian patient cohort limits generalizability to other racial groups.
In conclusion, one-third of waitlisted patients without diabetes exhibit abnormal OGTT results. Age, fasting glucose levels, and statin therapy were identified as independent risk factors. Patients younger than the optimal discriminatory age threshold (51 years), with fasting glucose levels below 100mg/dL, and not receiving statin therapy (representing one in four patients) have a low likelihood of abnormal OGTT results, and routine testing may therefore be unnecessary. Conversely, annual OGTT screening may be warranted in patients with an initially normal OGTT particularly if they are overweight, obese, or undergoing statin therapy.
Authors’ contributionsE.T-G., A.T., and E.P. designed the study; E.T.-G., A.T., L.P.-T., and E.P. revised and approved the analytical protocol; E.T.-G., L.P.-T., C.R.R.-L., A.F.- H., E.P.-C., A.M.d.V.G., A.G.-D, D.M.-M., C.A.-S., A.E.R.-R., A.M.R.-G., M.M., S.G.-R., A.A.-G., A.G.-R., C.R.-A., A.P.R.-H., E.d.B.-R. and D.H.-M. collected the data; E.T-G., A.T., and E.P. analyzed the data; E.T.-G. and A.T. made the tables and figures; E.T.-G. and A.T. wrote the first draft of the manuscript; E.P. and D.H.-M. revised and amended the manuscript; all authors approved the final version of the manuscript.
FundingThis study was supported by grants from Instituto de Salud Carlos III (PI16-02151, PI19/01187, ICI21/00042, RD16/0009/0031 and RICORS2040 RD24/0004/0025).
Conflict of interestThe authors declare that no financial or personal relationships with other people or organizations influenced the work reported in this manuscript. A.T. received support for attending the 2023 Spanish Society of Nephrology Congress and honoraria for educational lectures from Alnylam and Chiesi. All other authors declare no conflicts of interest.
Data availability statementThe data that support the tables and plots within this manuscript and other findings of this study are available from the corresponding author upon reasonable request.
We are grateful to the nursing team of the Nephrology Service and to the Research Unit at the Hospital Universitario de Canarias for their valuable support.
The followings are the supplementary data to this article:


