

To describe the epidemiology, clinical profile, treatments, and to determine cardiovascular and renal outcomes after two years of follow-up in a contemporary chronic kidneay disease (CKD) population in Spain. This was also analyzed among the DAPA-CKD-like population (patients who met most inclusion criteria of DAPA-CKD trial).
MethodsObservational, retrospective, population-based study using BIG-PAC database. The CKD population was defined as patients ≥18 years, with at least one diagnostic code of CKD prior to the index date (January 1st, 2018). CKD was defined as estimated glomerular filtration rate (eGFR) <60mL/min/1.73m2 (CKD-EPI), or albuminuria >30mg/g.
ResultsWe identified 56,435 CKD patients after exclusions (76.4 years, 52.2% men, urine albumin-to-creatinine ratio 390.8mg/g, eGFR 49.7mL/min/1.73m2). CKD prevalence was 4.91% and incidence 2.10 per 1000 patient-years. Regarding treatments, 69.2% were taking renin-angiotensin system inhibitors (only 4.2% at maximal doses) and 3.5% of diabetic patients SGLT-2 inhibitors. During the two years of follow-up, rates of heart failure, all-cause death, myocardial infarction, stroke, and CKD were 17.9, 12.1, 7.2, 6.3, and 5.9 events per 100 patient-years, respectively. During this period, 44% of patients were hospitalized, and 6.8% died during hospitalization. Cardiovascular outcomes were more common in the DAPA-CKD-like population.
ConclusionsIn Spain, CKD population is older and comorbidities, including diabetes and heart failure, are common. Cardiovascular and renal outcomes are frequent. There is room for improvement in CKD management, particularly through the use of drugs with proven cardiovascular and renal benefit.
Describir la epidemiología, el perfil clínico, los tratamientos y los eventos cardiovasculares y renales, tras 2 años de seguimiento en una población contemporánea con enfermedad renal crónica (ERC) en España. También se analizó en la población tipo DAPA-CKD (pacientes que cumplían la mayoría de criterios del estudio DAPA-CKD).
MétodosEstudio observacional, retrospectivo, poblacional, empleando la base de datos BIG-PAC. La población con ERC se definió como pacientes ≥18 años, con al menos un código diagnóstico de ERC antes de la fecha índice (01/01/2018). La ERC se definió como filtrado glomerular estimado (FGe)<60ml/min/1,73m2 (CKD-EPI) o albuminuria >30mg/g.
ResultadosSe identificaron 56.435 pacientes con ERC, tras exclusiones (76,4 años, 52,2% varones, cociente albúmina-creatinina 390,8mg/g, FGe 49,7ml/min/1,73m2). La prevalencia fue del 4,91% y la incidencia 2,10/1.000 pacientes/año. El 69,2% tomaba inhibidores del sistema renina-angiotensina (solo el 4,2% a dosis máximas) y el 3,5% de los diabéticos inhibidores SGLT-2. Tras 2 años, las tasas de insuficiencia cardiaca, muerte, infarto de miocardio, ictus y ERC fueron 17,9; 12,1; 7,2; 6,3; 5,9 eventos/100 pacientes/año, respectivamente. Además, el 44% hospitalizaron y el 6,8% murieron durante la hospitalización. Los eventos cardiovasculares fueron más frecuentes en la población tipo DAPA-CKD.
ConclusionesEn España, la población con ERC es mayor, y las comorbilidades, incluyendo diabetes e insuficiencia cardiaca, comunes. Los eventos cardiovasculares y renales son frecuentes. Hay margen de mejora en el manejo de la ERC, especialmente a través del empleo de fármacos con beneficio cardiovascular y renal.
Chronic kidney disease (CKD) has a major effect on global health, increasing both, morbidity and mortality.1 CKD significantly reduces lifespan, increases the risk of cardiovascular disease and may evolve into end-stage renal disease.2 In addition, it has been estimated that in 2017, nearly 700 million persons had CKD, 1.2 million people died from CKD, and CKD resulted in 35.8 million DALYs (disability-adjusted life-years) worldwide, being diabetic nephropathy responsible for almost a third of DALYs.1,3 Overall, life expectancy is markedly reduced as renal function declines or albuminuria develops.1–4 Of note, it is expected that these numbers will increase in the following years due to the aging of population, and the increased prevalence of hypertension and diabetes.5 Despite all these data, the awareness about the impact of CKD in real-world is low among patients and health-care providers.6
Fortunately, the development of CKD complications can be delayed or prevented with the apropriate treatment.7 Until recently, the only classes of drugs with proven benefit on slowing the decline of renal function were renin angiotensin system inhibitors, including angiotensin-converting enzyme inhibitors (ACEi) and angiotensin-receptor blockers (ARBs).8,9 However, in the last years, several sodium-glucose cotransporter-2 (SGLT-2) inhibitors have shown a positive impact on renal outcomes among patients with CKD,10,11 even in the absence of type 2 diabetes (T2D).10 In DAPA-CKD trial, patients with and without T2D, an eGFR of 25 to 75mL/min/1.73m2 and a urinary albumin-to-creatinine ratio (UACR) of 200 to 5000mg/g were included.10 As a result, this is an unique population in which nephroprotection with SGLT-2 inhibitors has been demonstrated, regardless the presence with T2D.
Despite the fact that healthcare system planning requires careful assessment of CKD epidemiology,1 and some data from Spain were published some years ago,12–14 current data for prevalence, morbidity, mortality and management of CKD are scarce, and more information is warranted.
The aims of this study were to describe the epidemiology, clinical characteristics and the therapeutic management of the CKD population in a recent cohort of patients in Spain, stratified by the presence of T2D and CKD stage, and to determine cardiovascular and renal outcomes during two years of follow-up. This was also analyzed in a population who met the most relevant inclusion criteria of the DAPA-CKD (Dapagliflozin and Prevention of Adverse Outcomes in Chronic Kidney Disease) trial10 (DAPA-CKD like population) with the aim of understanding the study population in real-world settings, in terms of baseline characteristics and cardiorenal events.
MethodsThis was an observational cohort study, comprising cross-sectional and longitudinal retrospective analyses using secondary data captured in electronic health records from seven Spanish regions, from the BIG-PAC® database. BIG-PAC® database included information from non-selected 1.8 million persons of primary health centers and referral hospitals within the Spanish national health system. Before export to BIG-PAC®, data were rigorously anonymized and dissociated, making not possible individual identification. Previous studies have demonstrated its representativeness of the Spanish population.15 The study was approved by the Investigation Ethics Committee of Consorci Sanitari from Terrassa. No informed consent was provided, as this was a secondary data study and data were fully anonymized and dissociated from patients.
The study population was defined as all patients ≥18 years of age with at least one diagnostic code of CKD (Supplementary Table 1) or having laboratory results meeting the definition of any stage of CKD prior to the index date (January 1st, 2018). CKD stages 1–5 were defined according to the eGFR (calculated by the CKD-Epidemiology Collaboration equation) and the urine albumin-to-creatinine ratio (UACR) criteria: CKD stage 1: eGFR ≥90mL/min/1.73m2 and UACR ≥30mg/g (3–30mg/mmol) or ICD (International Classification of Diseases)-10 N18.1; CKD stage 2 (mild): eGFR 60–89mL/min/1.73m2 and UACR ≥30mg/g (3–30mg/mmol) or ICD-10 N18.2; CKD stage 3a (mild to moderate): eGFR 45–59mL/min/1.73m2 or ICD-10 N18.3; CKD stage 3b (moderate to severe): eGFR 30–44mL/min/1.73m2 or ICD-10 N18.3; CKD stage 4 (severe): eGFR 15–29mL/min/1.73m2 or ICD-10 N18.4; CKD stage 5 (kidney failure): eGFR <15mL/min/1.73m2 or ICD-10 N18.1; CKD unspecified: no eGFR data available and ICD code N18.9.16 In addition, CKD was classified as hypertensive and diabetic CKD.
T2D was defined as all patients filling a prescription of any antidiabetic medication, T2D diagnostic code or HbA1c>7% prior to index date, excluding type 1 diabetes. The DAPA-CKD like population included those patients ≥18 years, with or without T2D, but not type 1 diabetes, who had an eGFR of 25 to 75mL/min/1.73m2 and a UACR of 200 to 5000mg/g, on stable treatment with ACEi or ARBs for at least 4 weeks.10
Comorbidities were searched for in all available data prior to index date, and a minimum of 1 year of data before index date was required. The main comorbidities included myocardial infarction (MI), heart failure (HF), atrial fibrillation (AF), stroke, peripheral artery disease (PAD), diabetes, hyperkalemia, and gout. ICD-9 and ICD-10 codes (https://eciemaps.mscbs.gob.es) were considered for the diagnosis of comorbidities (Supplementary Table 1).
The information about treatment was recorded from the registries for dispensing medicines, according to the Anatomical Therapeutic Chemical Classification System (Supplementary Table 1).17 Treatment for hypertension (ACEi, ARBs, direct renin inhibitors, aldosterone antagonists, sacubitril/valsartan, beta blockers, diuretics, calcium channel blockers), antidiabetic medications (SGLT-2 inhibitors, metformin, sulfonylureas, DPP-4 [dipeptidyl peptidase 4] inhibitors, GLP-1 [glucagon-like peptide-1] receptor agonists, meglitinides, glitazones, acarbose, miglitol, insulin), antithrombotic therapy (warfarin, aspirin, P2Y12 receptor antagonists) and statins were recorded. The prescription of a drug in a specific patient was based only on medical criteria (routine practice).
Baseline characteristics (total CKD population and by T2D status and CKD stage), including demographics, comorbidities and medications were determined at index date (January 1st, 2018). In addition, prevalence and incidence of CKD was calculated in the overall population and according to T2D status. Incidence was calculated as all newly diagnosed patients during 2018 divided by the number of patients without CKD in the population at the beginning of 2018 and expressed in cases per 1000 patient-years. Prevalence was calculated as all patients with a CKD diagnosis at the end of 2018, divided by all individuals in the total population covered by the database at that time.
Cardiovascular events were defined as a main diagnosis during a hospital visit or stay occurred during 2 years after index date (i.e. at any time during 2018 or 2019) (Supplementary Table 1). Outcomes included all-cause death and hospitalizations due to MI, stroke, HF, CKD, and PAD, or CKD complications. In the case of CKD, these were hospitalizations due to CKD complications that were defined as decline of eGFR ≥50% at any time during follow-up, kidney transplantation or dialysis. All-cause death was defined as death of any cause. Since the cause of death was not available in the database, cardiovascular death was not reported. Outcomes were calculated in the overall CKD population and in the DAPA-CKD-like population, according to the presence of T2D, and were stratified by CKD stage. In addition, the following variables were also assessed for the total CKD group and by the presence of T2D: hospitalization rates, hospital readmission rates, mortality rates during hospitalization and mortality rates after first hospitalization.
Statistical analysisCategorical variables were described by their absolute (n) and relative frequencies (%). Continuous variables were described using the mean and standard deviation. Event rates were presented as events and events per 100 patient-years. Categorical variables were compared with the Chi-square test or the Fisher exact test when appropriate. When two means were compared, the t-student test was used. Analyses of events were performed for the index date of 1st January 2018 with 2 years of follow-up. Time to first event was analyzed with the contrast t-student test for independent samples. Follow-up was censored at observation period, or death end unless an event has occurred. A level of statistical significance of 0.05 was applied in all the statistical tests. The data were analyzed using the statistical package SPSS v25.0 (SPSS Inc., Chicago, Illinois, USA).
ResultsOut of 1.827.435 persons included in the BIG-PAC® database in 2018, 1,405,746 people were attended during the 2015–2017 period, of whom 1,175,426 were 18 years or older. At index date, 57,860 patients had CKD. As 1425 patients were excluded due to inconsistent data, 56,435 patients (97.6%) comprised the CKD study population (75% with a diagnostic code, 25% based on laboratory values, Fig. 1). The incidence of CKD in 2018 was 2.10 per 1000 patient-years and the prevalence was 4.91%. T2D patients had a CKD prevalence about 19 fold that of those without T2D (55.3% vs. 2.9%).
.")
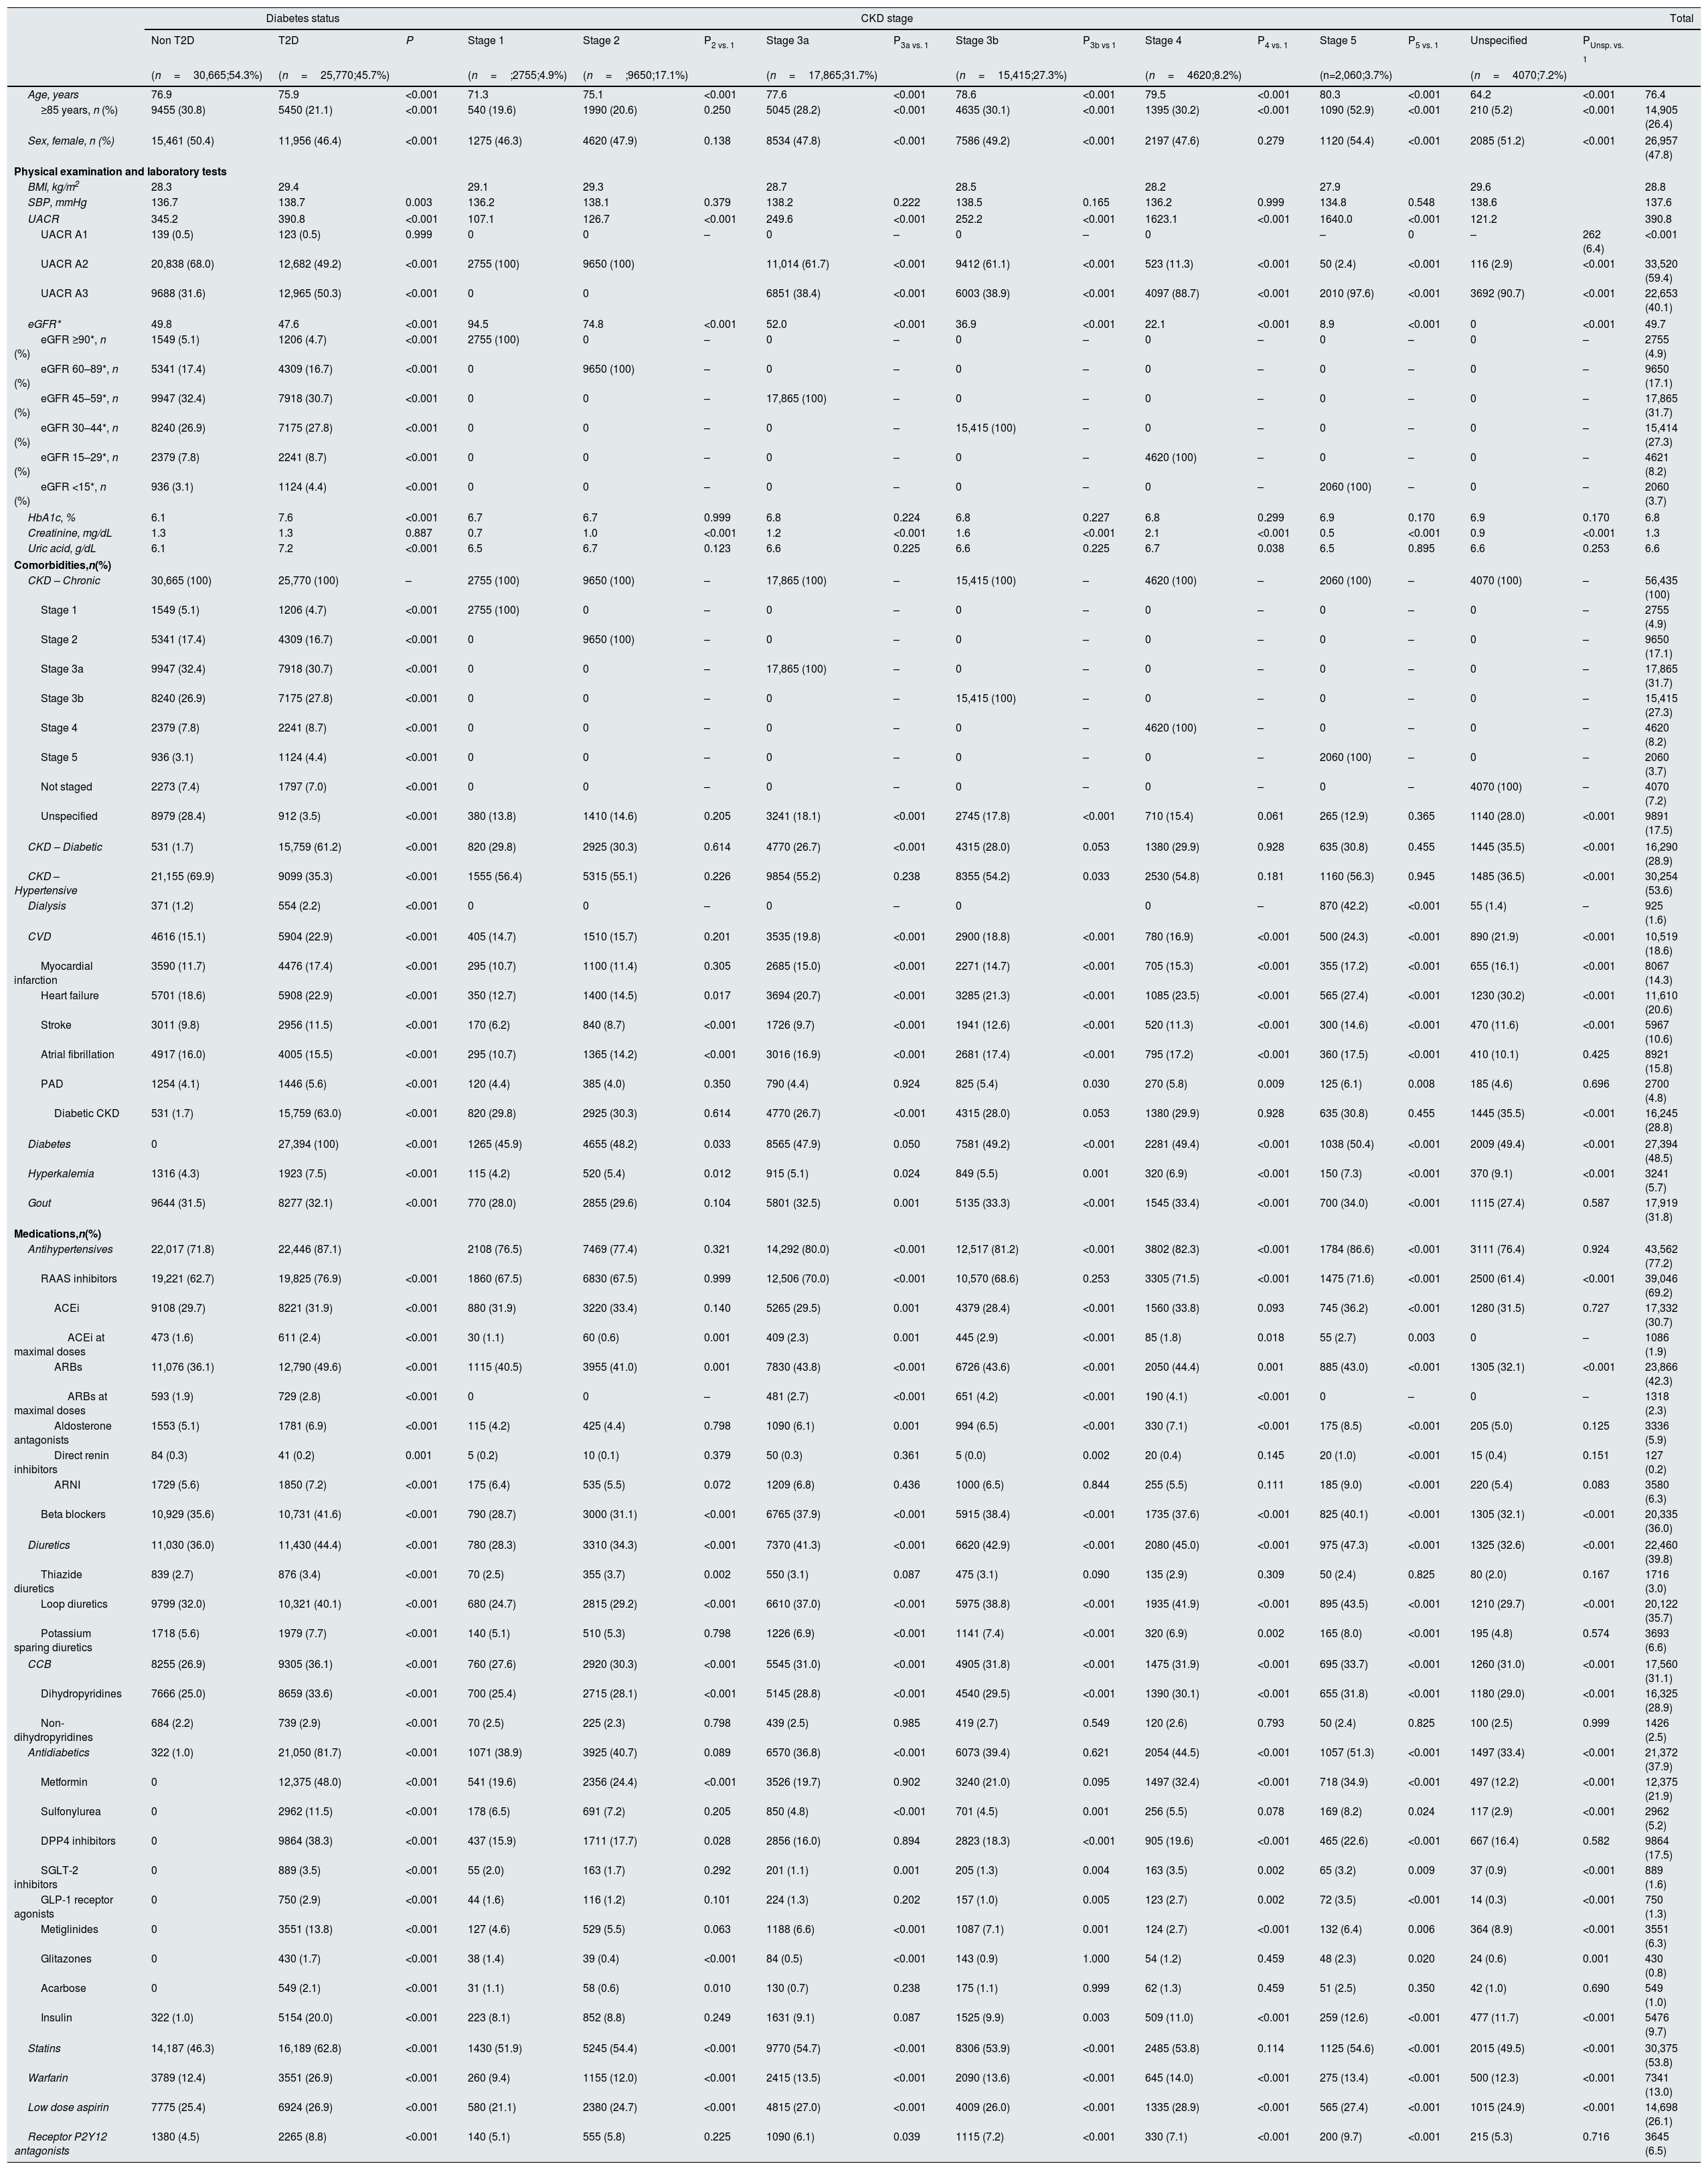
The baseline clinical characteristics of the CKD population according to the presence of T2D and CKD stage are presented in Table 1. Overall, mean age was 76.4 years, 52.2% of patients were men, mean UACR was 390.8mg/g and mean eGFR 49.7mL/min/1.73m2. Overall, 20.6% of patients had a history of HF, 14.3% MI, and 10.6% stroke. With regard to treatments, 69.2% were taking renin angiotensin system inhibitors, but only 4.2% of patients at maximal doses. A total of 25,770 (45.7%) patients had T2D. Patients with T2D were younger (75.9 vs. 76.9 years; P<0.001), but UACR (390.8 vs. 345.2mg/g, P<0.001), and HbA1c (7.6 vs. 6.1%; P<0.001) were higher and eGFR lower (47.6 vs. 49.8mL/min/1.73m2, P<0.001) compared to those without T2D. In addition, comorbidities were more common among patients with T2D. Moreover, more T2D patients were taking renin-angiotensin system inhibitors (76.9% vs. 62.7%; P<0.001) (Table 1).
Baseline clinical characteristics of the CKD population at index date (1st January 2018) and according to the presence of type 2 diabetes and CKD stage.
| Diabetes status | CKD stage | Total | |||||||||||||||
|---|---|---|---|---|---|---|---|---|---|---|---|---|---|---|---|---|---|
| Non T2D | T2D | P | Stage 1 | Stage 2 | P2 vs. 1 | Stage 3a | P3a vs. 1 | Stage 3b | P3b vs 1 | Stage 4 | P4 vs. 1 | Stage 5 | P5 vs. 1 | Unspecified | PUnsp. vs. 1 | ||
| (n=30,665;54.3%) | (n=25,770;45.7%) | (n=;2755;4.9%) | (n=;9650;17.1%) | (n=17,865;31.7%) | (n=15,415;27.3%) | (n=4620;8.2%) | (n=2,060;3.7%) | (n=4070;7.2%) | |||||||||
| Age, years | 76.9 | 75.9 | <0.001 | 71.3 | 75.1 | <0.001 | 77.6 | <0.001 | 78.6 | <0.001 | 79.5 | <0.001 | 80.3 | <0.001 | 64.2 | <0.001 | 76.4 |
| ≥85 years, n (%) | 9455 (30.8) | 5450 (21.1) | <0.001 | 540 (19.6) | 1990 (20.6) | 0.250 | 5045 (28.2) | <0.001 | 4635 (30.1) | <0.001 | 1395 (30.2) | <0.001 | 1090 (52.9) | <0.001 | 210 (5.2) | <0.001 | 14,905 (26.4) |
| Sex, female, n (%) | 15,461 (50.4) | 11,956 (46.4) | <0.001 | 1275 (46.3) | 4620 (47.9) | 0.138 | 8534 (47.8) | <0.001 | 7586 (49.2) | <0.001 | 2197 (47.6) | 0.279 | 1120 (54.4) | <0.001 | 2085 (51.2) | <0.001 | 26,957 (47.8) |
| Physical examination and laboratory tests | |||||||||||||||||
| BMI, kg/m2 | 28.3 | 29.4 | 29.1 | 29.3 | 28.7 | 28.5 | 28.2 | 27.9 | 29.6 | 28.8 | |||||||
| SBP, mmHg | 136.7 | 138.7 | 0.003 | 136.2 | 138.1 | 0.379 | 138.2 | 0.222 | 138.5 | 0.165 | 136.2 | 0.999 | 134.8 | 0.548 | 138.6 | 137.6 | |
| UACR | 345.2 | 390.8 | <0.001 | 107.1 | 126.7 | <0.001 | 249.6 | <0.001 | 252.2 | <0.001 | 1623.1 | <0.001 | 1640.0 | <0.001 | 121.2 | 390.8 | |
| UACR A1 | 139 (0.5) | 123 (0.5) | 0.999 | 0 | 0 | – | 0 | – | 0 | – | 0 | – | 0 | – | 262 (6.4) | <0.001 | |
| UACR A2 | 20,838 (68.0) | 12,682 (49.2) | <0.001 | 2755 (100) | 9650 (100) | 11,014 (61.7) | <0.001 | 9412 (61.1) | <0.001 | 523 (11.3) | <0.001 | 50 (2.4) | <0.001 | 116 (2.9) | <0.001 | 33,520 (59.4) | |
| UACR A3 | 9688 (31.6) | 12,965 (50.3) | <0.001 | 0 | 0 | 6851 (38.4) | <0.001 | 6003 (38.9) | <0.001 | 4097 (88.7) | <0.001 | 2010 (97.6) | <0.001 | 3692 (90.7) | <0.001 | 22,653 (40.1) | |
| eGFR* | 49.8 | 47.6 | <0.001 | 94.5 | 74.8 | <0.001 | 52.0 | <0.001 | 36.9 | <0.001 | 22.1 | <0.001 | 8.9 | <0.001 | 0 | <0.001 | 49.7 |
| eGFR ≥90*, n (%) | 1549 (5.1) | 1206 (4.7) | <0.001 | 2755 (100) | 0 | – | 0 | – | 0 | – | 0 | – | 0 | – | 0 | – | 2755 (4.9) |
| eGFR 60–89*, n (%) | 5341 (17.4) | 4309 (16.7) | <0.001 | 0 | 9650 (100) | – | 0 | – | 0 | – | 0 | – | 0 | – | 0 | – | 9650 (17.1) |
| eGFR 45–59*, n (%) | 9947 (32.4) | 7918 (30.7) | <0.001 | 0 | 0 | – | 17,865 (100) | – | 0 | – | 0 | – | 0 | – | 0 | – | 17,865 (31.7) |
| eGFR 30–44*, n (%) | 8240 (26.9) | 7175 (27.8) | <0.001 | 0 | 0 | – | 0 | – | 15,415 (100) | – | 0 | – | 0 | – | 0 | – | 15,414 (27.3) |
| eGFR 15–29*, n (%) | 2379 (7.8) | 2241 (8.7) | <0.001 | 0 | 0 | – | 0 | – | 0 | – | 4620 (100) | – | 0 | – | 0 | – | 4621 (8.2) |
| eGFR <15*, n (%) | 936 (3.1) | 1124 (4.4) | <0.001 | 0 | 0 | – | 0 | – | 0 | – | 0 | – | 2060 (100) | – | 0 | – | 2060 (3.7) |
| HbA1c, % | 6.1 | 7.6 | <0.001 | 6.7 | 6.7 | 0.999 | 6.8 | 0.224 | 6.8 | 0.227 | 6.8 | 0.299 | 6.9 | 0.170 | 6.9 | 0.170 | 6.8 |
| Creatinine, mg/dL | 1.3 | 1.3 | 0.887 | 0.7 | 1.0 | <0.001 | 1.2 | <0.001 | 1.6 | <0.001 | 2.1 | <0.001 | 0.5 | <0.001 | 0.9 | <0.001 | 1.3 |
| Uric acid, g/dL | 6.1 | 7.2 | <0.001 | 6.5 | 6.7 | 0.123 | 6.6 | 0.225 | 6.6 | 0.225 | 6.7 | 0.038 | 6.5 | 0.895 | 6.6 | 0.253 | 6.6 |
| Comorbidities,n(%) | |||||||||||||||||
| CKD – Chronic | 30,665 (100) | 25,770 (100) | – | 2755 (100) | 9650 (100) | – | 17,865 (100) | – | 15,415 (100) | – | 4620 (100) | – | 2060 (100) | – | 4070 (100) | – | 56,435 (100) |
| Stage 1 | 1549 (5.1) | 1206 (4.7) | <0.001 | 2755 (100) | 0 | – | 0 | – | 0 | – | 0 | – | 0 | – | 0 | – | 2755 (4.9) |
| Stage 2 | 5341 (17.4) | 4309 (16.7) | <0.001 | 0 | 9650 (100) | – | 0 | – | 0 | – | 0 | – | 0 | – | 0 | – | 9650 (17.1) |
| Stage 3a | 9947 (32.4) | 7918 (30.7) | <0.001 | 0 | 0 | – | 17,865 (100) | – | 0 | – | 0 | – | 0 | – | 0 | – | 17,865 (31.7) |
| Stage 3b | 8240 (26.9) | 7175 (27.8) | <0.001 | 0 | 0 | – | 0 | – | 15,415 (100) | – | 0 | – | 0 | – | 0 | – | 15,415 (27.3) |
| Stage 4 | 2379 (7.8) | 2241 (8.7) | <0.001 | 0 | 0 | – | 0 | – | 0 | – | 4620 (100) | – | 0 | – | 0 | – | 4620 (8.2) |
| Stage 5 | 936 (3.1) | 1124 (4.4) | <0.001 | 0 | 0 | – | 0 | – | 0 | – | 0 | – | 2060 (100) | – | 0 | – | 2060 (3.7) |
| Not staged | 2273 (7.4) | 1797 (7.0) | <0.001 | 0 | 0 | – | 0 | – | 0 | – | 0 | – | 0 | – | 4070 (100) | – | 4070 (7.2) |
| Unspecified | 8979 (28.4) | 912 (3.5) | <0.001 | 380 (13.8) | 1410 (14.6) | 0.205 | 3241 (18.1) | <0.001 | 2745 (17.8) | <0.001 | 710 (15.4) | 0.061 | 265 (12.9) | 0.365 | 1140 (28.0) | <0.001 | 9891 (17.5) |
| CKD – Diabetic | 531 (1.7) | 15,759 (61.2) | <0.001 | 820 (29.8) | 2925 (30.3) | 0.614 | 4770 (26.7) | <0.001 | 4315 (28.0) | 0.053 | 1380 (29.9) | 0.928 | 635 (30.8) | 0.455 | 1445 (35.5) | <0.001 | 16,290 (28.9) |
| CKD – Hypertensive | 21,155 (69.9) | 9099 (35.3) | <0.001 | 1555 (56.4) | 5315 (55.1) | 0.226 | 9854 (55.2) | 0.238 | 8355 (54.2) | 0.033 | 2530 (54.8) | 0.181 | 1160 (56.3) | 0.945 | 1485 (36.5) | <0.001 | 30,254 (53.6) |
| Dialysis | 371 (1.2) | 554 (2.2) | <0.001 | 0 | 0 | – | 0 | – | 0 | 0 | – | 870 (42.2) | <0.001 | 55 (1.4) | – | 925 (1.6) | |
| CVD | 4616 (15.1) | 5904 (22.9) | <0.001 | 405 (14.7) | 1510 (15.7) | 0.201 | 3535 (19.8) | <0.001 | 2900 (18.8) | <0.001 | 780 (16.9) | <0.001 | 500 (24.3) | <0.001 | 890 (21.9) | <0.001 | 10,519 (18.6) |
| Myocardial infarction | 3590 (11.7) | 4476 (17.4) | <0.001 | 295 (10.7) | 1100 (11.4) | 0.305 | 2685 (15.0) | <0.001 | 2271 (14.7) | <0.001 | 705 (15.3) | <0.001 | 355 (17.2) | <0.001 | 655 (16.1) | <0.001 | 8067 (14.3) |
| Heart failure | 5701 (18.6) | 5908 (22.9) | <0.001 | 350 (12.7) | 1400 (14.5) | 0.017 | 3694 (20.7) | <0.001 | 3285 (21.3) | <0.001 | 1085 (23.5) | <0.001 | 565 (27.4) | <0.001 | 1230 (30.2) | <0.001 | 11,610 (20.6) |
| Stroke | 3011 (9.8) | 2956 (11.5) | <0.001 | 170 (6.2) | 840 (8.7) | <0.001 | 1726 (9.7) | <0.001 | 1941 (12.6) | <0.001 | 520 (11.3) | <0.001 | 300 (14.6) | <0.001 | 470 (11.6) | <0.001 | 5967 (10.6) |
| Atrial fibrillation | 4917 (16.0) | 4005 (15.5) | <0.001 | 295 (10.7) | 1365 (14.2) | <0.001 | 3016 (16.9) | <0.001 | 2681 (17.4) | <0.001 | 795 (17.2) | <0.001 | 360 (17.5) | <0.001 | 410 (10.1) | 0.425 | 8921 (15.8) |
| PAD | 1254 (4.1) | 1446 (5.6) | <0.001 | 120 (4.4) | 385 (4.0) | 0.350 | 790 (4.4) | 0.924 | 825 (5.4) | 0.030 | 270 (5.8) | 0.009 | 125 (6.1) | 0.008 | 185 (4.6) | 0.696 | 2700 (4.8) |
| Diabetic CKD | 531 (1.7) | 15,759 (63.0) | <0.001 | 820 (29.8) | 2925 (30.3) | 0.614 | 4770 (26.7) | <0.001 | 4315 (28.0) | 0.053 | 1380 (29.9) | 0.928 | 635 (30.8) | 0.455 | 1445 (35.5) | <0.001 | 16,245 (28.8) |
| Diabetes | 0 | 27,394 (100) | <0.001 | 1265 (45.9) | 4655 (48.2) | 0.033 | 8565 (47.9) | 0.050 | 7581 (49.2) | <0.001 | 2281 (49.4) | <0.001 | 1038 (50.4) | <0.001 | 2009 (49.4) | <0.001 | 27,394 (48.5) |
| Hyperkalemia | 1316 (4.3) | 1923 (7.5) | <0.001 | 115 (4.2) | 520 (5.4) | 0.012 | 915 (5.1) | 0.024 | 849 (5.5) | 0.001 | 320 (6.9) | <0.001 | 150 (7.3) | <0.001 | 370 (9.1) | <0.001 | 3241 (5.7) |
| Gout | 9644 (31.5) | 8277 (32.1) | <0.001 | 770 (28.0) | 2855 (29.6) | 0.104 | 5801 (32.5) | 0.001 | 5135 (33.3) | <0.001 | 1545 (33.4) | <0.001 | 700 (34.0) | <0.001 | 1115 (27.4) | 0.587 | 17,919 (31.8) |
| Medications,n(%) | |||||||||||||||||
| Antihypertensives | 22,017 (71.8) | 22,446 (87.1) | 2108 (76.5) | 7469 (77.4) | 0.321 | 14,292 (80.0) | <0.001 | 12,517 (81.2) | <0.001 | 3802 (82.3) | <0.001 | 1784 (86.6) | <0.001 | 3111 (76.4) | 0.924 | 43,562 (77.2) | |
| RAAS inhibitors | 19,221 (62.7) | 19,825 (76.9) | <0.001 | 1860 (67.5) | 6830 (67.5) | 0.999 | 12,506 (70.0) | <0.001 | 10,570 (68.6) | 0.253 | 3305 (71.5) | <0.001 | 1475 (71.6) | <0.001 | 2500 (61.4) | <0.001 | 39,046 (69.2) |
| ACEi | 9108 (29.7) | 8221 (31.9) | <0.001 | 880 (31.9) | 3220 (33.4) | 0.140 | 5265 (29.5) | 0.001 | 4379 (28.4) | <0.001 | 1560 (33.8) | 0.093 | 745 (36.2) | <0.001 | 1280 (31.5) | 0.727 | 17,332 (30.7) |
| ACEi at maximal doses | 473 (1.6) | 611 (2.4) | <0.001 | 30 (1.1) | 60 (0.6) | 0.001 | 409 (2.3) | 0.001 | 445 (2.9) | <0.001 | 85 (1.8) | 0.018 | 55 (2.7) | 0.003 | 0 | – | 1086 (1.9) |
| ARBs | 11,076 (36.1) | 12,790 (49.6) | <0.001 | 1115 (40.5) | 3955 (41.0) | 0.001 | 7830 (43.8) | <0.001 | 6726 (43.6) | <0.001 | 2050 (44.4) | 0.001 | 885 (43.0) | <0.001 | 1305 (32.1) | <0.001 | 23,866 (42.3) |
| ARBs at maximal doses | 593 (1.9) | 729 (2.8) | <0.001 | 0 | 0 | – | 481 (2.7) | <0.001 | 651 (4.2) | <0.001 | 190 (4.1) | <0.001 | 0 | – | 0 | – | 1318 (2.3) |
| Aldosterone antagonists | 1553 (5.1) | 1781 (6.9) | <0.001 | 115 (4.2) | 425 (4.4) | 0.798 | 1090 (6.1) | 0.001 | 994 (6.5) | <0.001 | 330 (7.1) | <0.001 | 175 (8.5) | <0.001 | 205 (5.0) | 0.125 | 3336 (5.9) |
| Direct renin inhibitors | 84 (0.3) | 41 (0.2) | 0.001 | 5 (0.2) | 10 (0.1) | 0.379 | 50 (0.3) | 0.361 | 5 (0.0) | 0.002 | 20 (0.4) | 0.145 | 20 (1.0) | <0.001 | 15 (0.4) | 0.151 | 127 (0.2) |
| ARNI | 1729 (5.6) | 1850 (7.2) | <0.001 | 175 (6.4) | 535 (5.5) | 0.072 | 1209 (6.8) | 0.436 | 1000 (6.5) | 0.844 | 255 (5.5) | 0.111 | 185 (9.0) | <0.001 | 220 (5.4) | 0.083 | 3580 (6.3) |
| Beta blockers | 10,929 (35.6) | 10,731 (41.6) | <0.001 | 790 (28.7) | 3000 (31.1) | <0.001 | 6765 (37.9) | <0.001 | 5915 (38.4) | <0.001 | 1735 (37.6) | <0.001 | 825 (40.1) | <0.001 | 1305 (32.1) | <0.001 | 20,335 (36.0) |
| Diuretics | 11,030 (36.0) | 11,430 (44.4) | <0.001 | 780 (28.3) | 3310 (34.3) | <0.001 | 7370 (41.3) | <0.001 | 6620 (42.9) | <0.001 | 2080 (45.0) | <0.001 | 975 (47.3) | <0.001 | 1325 (32.6) | <0.001 | 22,460 (39.8) |
| Thiazide diuretics | 839 (2.7) | 876 (3.4) | <0.001 | 70 (2.5) | 355 (3.7) | 0.002 | 550 (3.1) | 0.087 | 475 (3.1) | 0.090 | 135 (2.9) | 0.309 | 50 (2.4) | 0.825 | 80 (2.0) | 0.167 | 1716 (3.0) |
| Loop diuretics | 9799 (32.0) | 10,321 (40.1) | <0.001 | 680 (24.7) | 2815 (29.2) | <0.001 | 6610 (37.0) | <0.001 | 5975 (38.8) | <0.001 | 1935 (41.9) | <0.001 | 895 (43.5) | <0.001 | 1210 (29.7) | <0.001 | 20,122 (35.7) |
| Potassium sparing diuretics | 1718 (5.6) | 1979 (7.7) | <0.001 | 140 (5.1) | 510 (5.3) | 0.798 | 1226 (6.9) | <0.001 | 1141 (7.4) | <0.001 | 320 (6.9) | 0.002 | 165 (8.0) | <0.001 | 195 (4.8) | 0.574 | 3693 (6.6) |
| CCB | 8255 (26.9) | 9305 (36.1) | <0.001 | 760 (27.6) | 2920 (30.3) | <0.001 | 5545 (31.0) | <0.001 | 4905 (31.8) | <0.001 | 1475 (31.9) | <0.001 | 695 (33.7) | <0.001 | 1260 (31.0) | <0.001 | 17,560 (31.1) |
| Dihydropyridines | 7666 (25.0) | 8659 (33.6) | <0.001 | 700 (25.4) | 2715 (28.1) | <0.001 | 5145 (28.8) | <0.001 | 4540 (29.5) | <0.001 | 1390 (30.1) | <0.001 | 655 (31.8) | <0.001 | 1180 (29.0) | <0.001 | 16,325 (28.9) |
| Non-dihydropyridines | 684 (2.2) | 739 (2.9) | <0.001 | 70 (2.5) | 225 (2.3) | 0.798 | 439 (2.5) | 0.985 | 419 (2.7) | 0.549 | 120 (2.6) | 0.793 | 50 (2.4) | 0.825 | 100 (2.5) | 0.999 | 1426 (2.5) |
| Antidiabetics | 322 (1.0) | 21,050 (81.7) | <0.001 | 1071 (38.9) | 3925 (40.7) | 0.089 | 6570 (36.8) | <0.001 | 6073 (39.4) | 0.621 | 2054 (44.5) | <0.001 | 1057 (51.3) | <0.001 | 1497 (33.4) | <0.001 | 21,372 (37.9) |
| Metformin | 0 | 12,375 (48.0) | <0.001 | 541 (19.6) | 2356 (24.4) | <0.001 | 3526 (19.7) | 0.902 | 3240 (21.0) | 0.095 | 1497 (32.4) | <0.001 | 718 (34.9) | <0.001 | 497 (12.2) | <0.001 | 12,375 (21.9) |
| Sulfonylurea | 0 | 2962 (11.5) | <0.001 | 178 (6.5) | 691 (7.2) | 0.205 | 850 (4.8) | <0.001 | 701 (4.5) | 0.001 | 256 (5.5) | 0.078 | 169 (8.2) | 0.024 | 117 (2.9) | <0.001 | 2962 (5.2) |
| DPP4 inhibitors | 0 | 9864 (38.3) | <0.001 | 437 (15.9) | 1711 (17.7) | 0.028 | 2856 (16.0) | 0.894 | 2823 (18.3) | <0.001 | 905 (19.6) | <0.001 | 465 (22.6) | <0.001 | 667 (16.4) | 0.582 | 9864 (17.5) |
| SGLT-2 inhibitors | 0 | 889 (3.5) | <0.001 | 55 (2.0) | 163 (1.7) | 0.292 | 201 (1.1) | 0.001 | 205 (1.3) | 0.004 | 163 (3.5) | 0.002 | 65 (3.2) | 0.009 | 37 (0.9) | <0.001 | 889 (1.6) |
| GLP-1 receptor agonists | 0 | 750 (2.9) | <0.001 | 44 (1.6) | 116 (1.2) | 0.101 | 224 (1.3) | 0.202 | 157 (1.0) | 0.005 | 123 (2.7) | 0.002 | 72 (3.5) | <0.001 | 14 (0.3) | <0.001 | 750 (1.3) |
| Metiglinides | 0 | 3551 (13.8) | <0.001 | 127 (4.6) | 529 (5.5) | 0.063 | 1188 (6.6) | <0.001 | 1087 (7.1) | 0.001 | 124 (2.7) | <0.001 | 132 (6.4) | 0.006 | 364 (8.9) | <0.001 | 3551 (6.3) |
| Glitazones | 0 | 430 (1.7) | <0.001 | 38 (1.4) | 39 (0.4) | <0.001 | 84 (0.5) | <0.001 | 143 (0.9) | 1.000 | 54 (1.2) | 0.459 | 48 (2.3) | 0.020 | 24 (0.6) | 0.001 | 430 (0.8) |
| Acarbose | 0 | 549 (2.1) | <0.001 | 31 (1.1) | 58 (0.6) | 0.010 | 130 (0.7) | 0.238 | 175 (1.1) | 0.999 | 62 (1.3) | 0.459 | 51 (2.5) | 0.350 | 42 (1.0) | 0.690 | 549 (1.0) |
| Insulin | 322 (1.0) | 5154 (20.0) | <0.001 | 223 (8.1) | 852 (8.8) | 0.249 | 1631 (9.1) | 0.087 | 1525 (9.9) | 0.003 | 509 (11.0) | <0.001 | 259 (12.6) | <0.001 | 477 (11.7) | <0.001 | 5476 (9.7) |
| Statins | 14,187 (46.3) | 16,189 (62.8) | <0.001 | 1430 (51.9) | 5245 (54.4) | <0.001 | 9770 (54.7) | <0.001 | 8306 (53.9) | <0.001 | 2485 (53.8) | 0.114 | 1125 (54.6) | <0.001 | 2015 (49.5) | <0.001 | 30,375 (53.8) |
| Warfarin | 3789 (12.4) | 3551 (26.9) | <0.001 | 260 (9.4) | 1155 (12.0) | <0.001 | 2415 (13.5) | <0.001 | 2090 (13.6) | <0.001 | 645 (14.0) | <0.001 | 275 (13.4) | <0.001 | 500 (12.3) | <0.001 | 7341 (13.0) |
| Low dose aspirin | 7775 (25.4) | 6924 (26.9) | <0.001 | 580 (21.1) | 2380 (24.7) | <0.001 | 4815 (27.0) | <0.001 | 4009 (26.0) | <0.001 | 1335 (28.9) | <0.001 | 565 (27.4) | <0.001 | 1015 (24.9) | <0.001 | 14,698 (26.1) |
| Receptor P2Y12 antagonists | 1380 (4.5) | 2265 (8.8) | <0.001 | 140 (5.1) | 555 (5.8) | 0.225 | 1090 (6.1) | 0.039 | 1115 (7.2) | <0.001 | 330 (7.1) | <0.001 | 200 (9.7) | <0.001 | 215 (5.3) | 0.716 | 3645 (6.5) |
ACEi: angiotensin-converting enzyme inhibitors; ARBs: angiotensin receptor blockers; ARNI: angiotensin receptor and neprilysin inhibition; BMI: body mass index; CCB: Calcium channel blockers; CVD: cardiovascular disease; CKD: chronic kidney disease; DPP4: dipeptidyl peptidase 4; eGFR: estimated glomerular filtration rate; * mL/min/1.73m2; GLP-1: glucagon-like peptide-1; PAD: peripheral artery disease; RAAS: renin angiotensin system; SBP: systolic blood pressure; SGLT-2: sodium-glucose Cotransporter-2; UACR: Urine albumin-to-Creatinine Ratio.
Overall, 70.8% of patients had stage ≥3 CKD. Age increased as renal function worsened (from 71.3 years in patients with stage 1 CKD to 80.3 years among stage 5 CKD patients; P<0.001), as well as UACR (from 107.1mg/g to 1640.0mg/g; P<0.001) and the proportion of patients treated with renin-angiotensin system inhibitors (from 67.5% to 71.6%; P<0.001). Similarly, comorbidities increased as renal function decreased (Table 1).
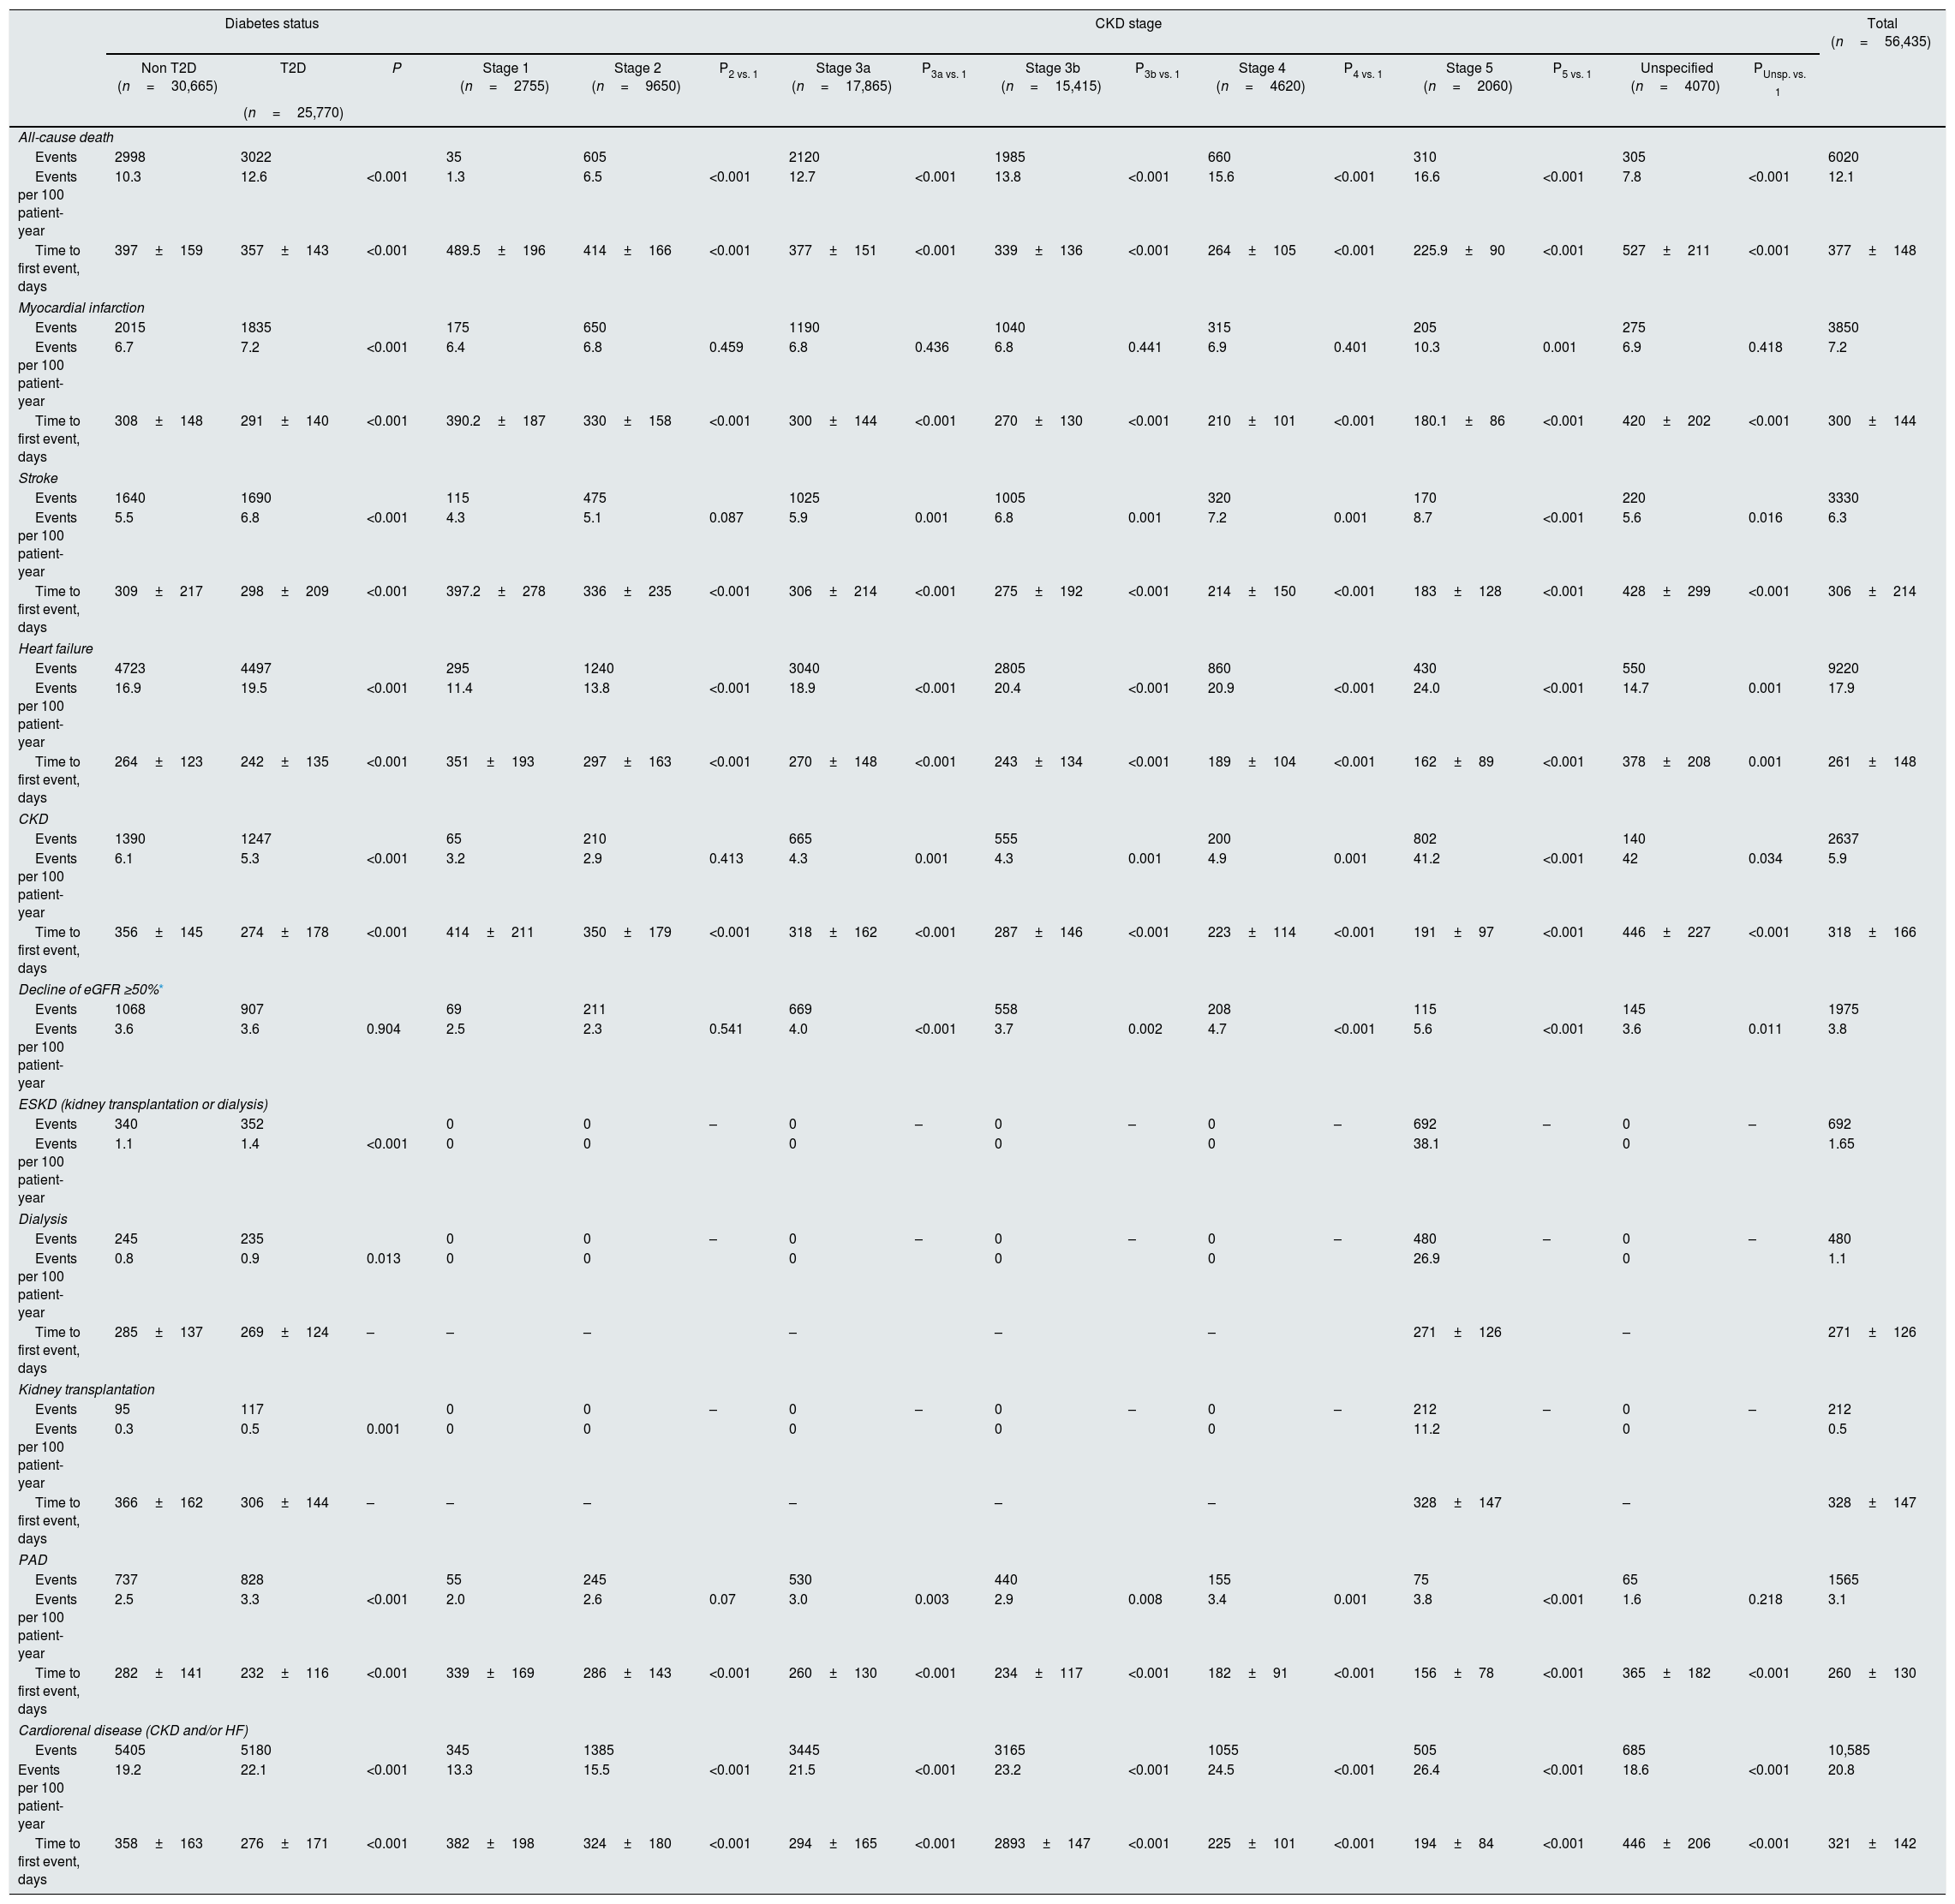
After 2 years of follow-up, eGFR was 49.5±12.4mL/min/1.73m2 and UACR 401.8±195.6mg/g, 1.1% of patients underwent dialysis and 0.5% kidney transplantation. During this period, rates of hospitalizations due to HF, all-cause death, MI, stroke, CKD and PAD were 17.9, 12.1, 7.2, 6.3, 5.9 and 3.1 events per 100 patient-years, respectively. With regard to CKD endpoints, rates of decline of eGFR ≥50%, end-stage kidney disease, dialysis, and kidney transplantation were 3.8, 1.7, 1.1 and 0.5 events per 100 patient-years, respectively. Rates of the combined endpoint of CKD and/or HF were 20.8 events per 100 patient-years. Rates of all-cause death, cardiovascular and renal outcomes were significantly higher, and time to first HF hospitalization shorter, among patients with T2D, compared to those without T2D. Similarly, rates of all-cause death, cardiovascular and renal outcomes increased as CKD stage worsened. For instance, rates of combined endpoint of CKD and/or HF increased from 13.3 events per 100 patient-years in patients with stage 1 CKD to 26.4 events per 100 patient-years among stage 5 CKD patients (Table 2).
Event rates after 2 years of follow-up in the overall population and according to the presence of type 2 diabetes and CKD stage.
| Diabetes status | CKD stage | Total (n=56,435) | |||||||||||||||
|---|---|---|---|---|---|---|---|---|---|---|---|---|---|---|---|---|---|
| Non T2D (n=30,665) | T2D | P | Stage 1 (n=2755) | Stage 2 (n=9650) | P2 vs. 1 | Stage 3a (n=17,865) | P3a vs. 1 | Stage 3b (n=15,415) | P3b vs. 1 | Stage 4 (n=4620) | P4 vs. 1 | Stage 5 (n=2060) | P5 vs. 1 | Unspecified (n=4070) | PUnsp. vs. 1 | ||
| (n=25,770) | |||||||||||||||||
| All-cause death | |||||||||||||||||
| Events | 2998 | 3022 | 35 | 605 | 2120 | 1985 | 660 | 310 | 305 | 6020 | |||||||
| Events per 100 patient-year | 10.3 | 12.6 | <0.001 | 1.3 | 6.5 | <0.001 | 12.7 | <0.001 | 13.8 | <0.001 | 15.6 | <0.001 | 16.6 | <0.001 | 7.8 | <0.001 | 12.1 |
| Time to first event, days | 397±159 | 357±143 | <0.001 | 489.5±196 | 414±166 | <0.001 | 377±151 | <0.001 | 339±136 | <0.001 | 264±105 | <0.001 | 225.9±90 | <0.001 | 527±211 | <0.001 | 377±148 |
| Myocardial infarction | |||||||||||||||||
| Events | 2015 | 1835 | 175 | 650 | 1190 | 1040 | 315 | 205 | 275 | 3850 | |||||||
| Events per 100 patient-year | 6.7 | 7.2 | <0.001 | 6.4 | 6.8 | 0.459 | 6.8 | 0.436 | 6.8 | 0.441 | 6.9 | 0.401 | 10.3 | 0.001 | 6.9 | 0.418 | 7.2 |
| Time to first event, days | 308±148 | 291±140 | <0.001 | 390.2±187 | 330±158 | <0.001 | 300±144 | <0.001 | 270±130 | <0.001 | 210±101 | <0.001 | 180.1±86 | <0.001 | 420±202 | <0.001 | 300±144 |
| Stroke | |||||||||||||||||
| Events | 1640 | 1690 | 115 | 475 | 1025 | 1005 | 320 | 170 | 220 | 3330 | |||||||
| Events per 100 patient-year | 5.5 | 6.8 | <0.001 | 4.3 | 5.1 | 0.087 | 5.9 | 0.001 | 6.8 | 0.001 | 7.2 | 0.001 | 8.7 | <0.001 | 5.6 | 0.016 | 6.3 |
| Time to first event, days | 309±217 | 298±209 | <0.001 | 397.2±278 | 336±235 | <0.001 | 306±214 | <0.001 | 275±192 | <0.001 | 214±150 | <0.001 | 183±128 | <0.001 | 428±299 | <0.001 | 306±214 |
| Heart failure | |||||||||||||||||
| Events | 4723 | 4497 | 295 | 1240 | 3040 | 2805 | 860 | 430 | 550 | 9220 | |||||||
| Events per 100 patient-year | 16.9 | 19.5 | <0.001 | 11.4 | 13.8 | <0.001 | 18.9 | <0.001 | 20.4 | <0.001 | 20.9 | <0.001 | 24.0 | <0.001 | 14.7 | 0.001 | 17.9 |
| Time to first event, days | 264±123 | 242±135 | <0.001 | 351±193 | 297±163 | <0.001 | 270±148 | <0.001 | 243±134 | <0.001 | 189±104 | <0.001 | 162±89 | <0.001 | 378±208 | 0.001 | 261±148 |
| CKD | |||||||||||||||||
| Events | 1390 | 1247 | 65 | 210 | 665 | 555 | 200 | 802 | 140 | 2637 | |||||||
| Events per 100 patient-year | 6.1 | 5.3 | <0.001 | 3.2 | 2.9 | 0.413 | 4.3 | 0.001 | 4.3 | 0.001 | 4.9 | 0.001 | 41.2 | <0.001 | 42 | 0.034 | 5.9 |
| Time to first event, days | 356±145 | 274±178 | <0.001 | 414±211 | 350±179 | <0.001 | 318±162 | <0.001 | 287±146 | <0.001 | 223±114 | <0.001 | 191±97 | <0.001 | 446±227 | <0.001 | 318±166 |
| Decline of eGFR ≥50%* | |||||||||||||||||
| Events | 1068 | 907 | 69 | 211 | 669 | 558 | 208 | 115 | 145 | 1975 | |||||||
| Events per 100 patient-year | 3.6 | 3.6 | 0.904 | 2.5 | 2.3 | 0.541 | 4.0 | <0.001 | 3.7 | 0.002 | 4.7 | <0.001 | 5.6 | <0.001 | 3.6 | 0.011 | 3.8 |
| ESKD (kidney transplantation or dialysis) | |||||||||||||||||
| Events | 340 | 352 | 0 | 0 | – | 0 | – | 0 | – | 0 | – | 692 | – | 0 | – | 692 | |
| Events per 100 patient-year | 1.1 | 1.4 | <0.001 | 0 | 0 | 0 | 0 | 0 | 38.1 | 0 | 1.65 | ||||||
| Dialysis | |||||||||||||||||
| Events | 245 | 235 | 0 | 0 | – | 0 | – | 0 | – | 0 | – | 480 | – | 0 | – | 480 | |
| Events per 100 patient-year | 0.8 | 0.9 | 0.013 | 0 | 0 | 0 | 0 | 0 | 26.9 | 0 | 1.1 | ||||||
| Time to first event, days | 285±137 | 269±124 | – | – | – | – | – | – | 271±126 | – | 271±126 | ||||||
| Kidney transplantation | |||||||||||||||||
| Events | 95 | 117 | 0 | 0 | – | 0 | – | 0 | – | 0 | – | 212 | – | 0 | – | 212 | |
| Events per 100 patient-year | 0.3 | 0.5 | 0.001 | 0 | 0 | 0 | 0 | 0 | 11.2 | 0 | 0.5 | ||||||
| Time to first event, days | 366±162 | 306±144 | – | – | – | – | – | – | 328±147 | – | 328±147 | ||||||
| PAD | |||||||||||||||||
| Events | 737 | 828 | 55 | 245 | 530 | 440 | 155 | 75 | 65 | 1565 | |||||||
| Events per 100 patient-year | 2.5 | 3.3 | <0.001 | 2.0 | 2.6 | 0.07 | 3.0 | 0.003 | 2.9 | 0.008 | 3.4 | 0.001 | 3.8 | <0.001 | 1.6 | 0.218 | 3.1 |
| Time to first event, days | 282±141 | 232±116 | <0.001 | 339±169 | 286±143 | <0.001 | 260±130 | <0.001 | 234±117 | <0.001 | 182±91 | <0.001 | 156±78 | <0.001 | 365±182 | <0.001 | 260±130 |
| Cardiorenal disease (CKD and/or HF) | |||||||||||||||||
| Events | 5405 | 5180 | 345 | 1385 | 3445 | 3165 | 1055 | 505 | 685 | 10,585 | |||||||
| Events per 100 patient-year | 19.2 | 22.1 | <0.001 | 13.3 | 15.5 | <0.001 | 21.5 | <0.001 | 23.2 | <0.001 | 24.5 | <0.001 | 26.4 | <0.001 | 18.6 | <0.001 | 20.8 |
| Time to first event, days | 358±163 | 276±171 | <0.001 | 382±198 | 324±180 | <0.001 | 294±165 | <0.001 | 2893±147 | <0.001 | 225±101 | <0.001 | 194±84 | <0.001 | 446±206 | <0.001 | 321±142 |
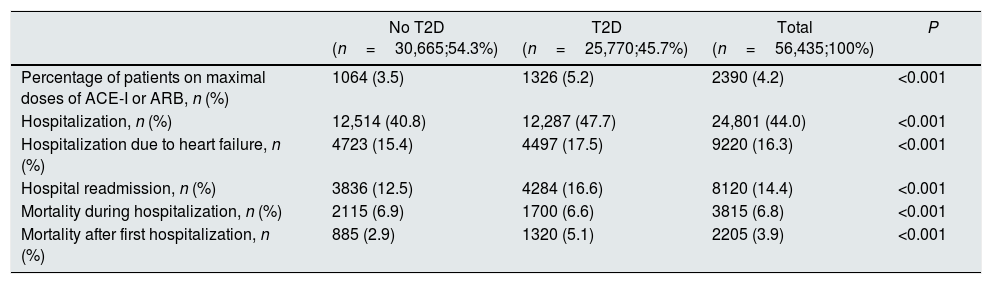
After 2 years of follow-up, 44% of patients were hospitalized, of whom 37.1% were hospitalized due to heart failure, 32.7% were re-hospitalized and 15.4% of patients died during hospitalization (Table 3). The proportion of patients who were hospitalized and that of patients requiring re-hospitalization were higher in T2D patients than in patients without T2D (47.7% vs. 40.8%; P<0.001, and 16.6% vs. 12.5%; P<0.001, respectively). However, mortality during hospitalization was slightly lower among patients with T2D (6.6% vs. 6.9%; P<0.001) (Table 3).
Hospitalization and mortality rates after 2 years of follow-up in the overall CKD population and according to the presence of type 2 diabetes.
| No T2D (n=30,665;54.3%) | T2D (n=25,770;45.7%) | Total (n=56,435;100%) | P | |
|---|---|---|---|---|
| Percentage of patients on maximal doses of ACE-I or ARB, n (%) | 1064 (3.5) | 1326 (5.2) | 2390 (4.2) | <0.001 |
| Hospitalization, n (%) | 12,514 (40.8) | 12,287 (47.7) | 24,801 (44.0) | <0.001 |
| Hospitalization due to heart failure, n (%) | 4723 (15.4) | 4497 (17.5) | 9220 (16.3) | <0.001 |
| Hospital readmission, n (%) | 3836 (12.5) | 4284 (16.6) | 8120 (14.4) | <0.001 |
| Mortality during hospitalization, n (%) | 2115 (6.9) | 1700 (6.6) | 3815 (6.8) | <0.001 |
| Mortality after first hospitalization, n (%) | 885 (2.9) | 1320 (5.1) | 2205 (3.9) | <0.001 |
ACEi: angiotensin-converting enzyme inhibitors; ARBs: angiotensin receptor blockers; CKD: chronic kidney disease; T2D: type 2 diabetes.
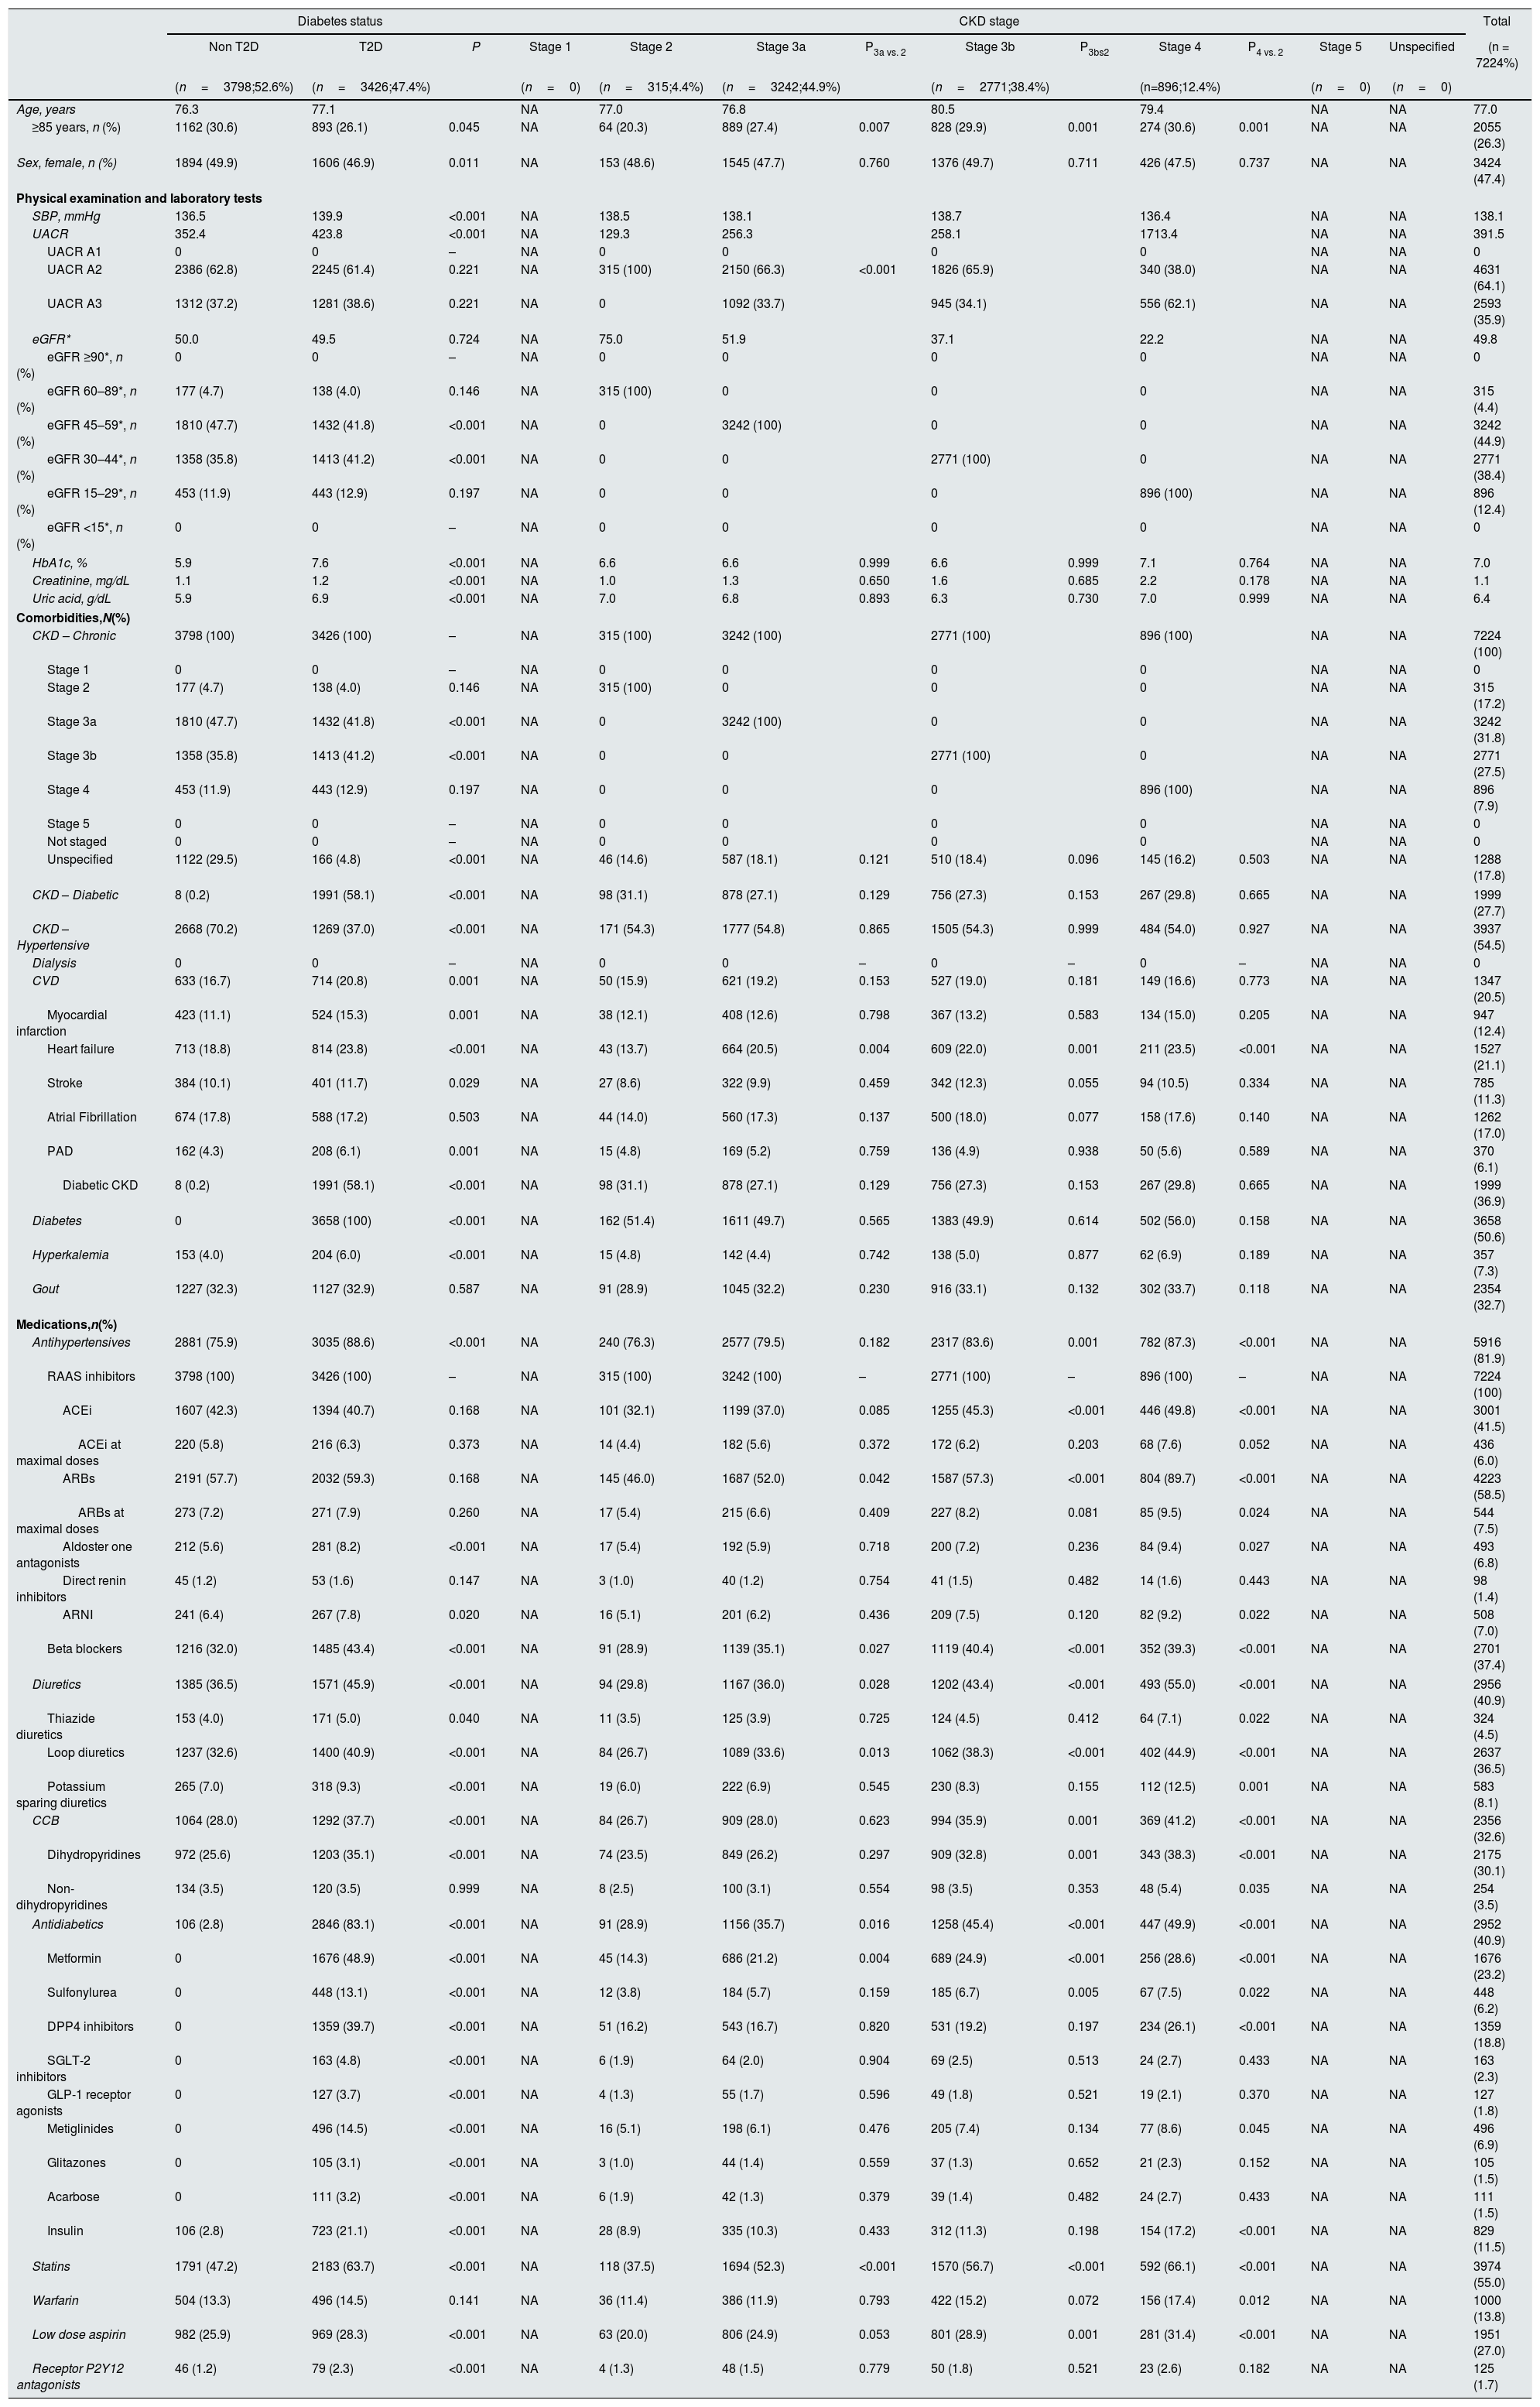
A specific analysis was performed in the DAPA-CKD like population (n=7224). In this subpopulation, mean age was 77.0 years, 52.6% were men, mean UACR was 391.5mg/g and mean eGFR 49.8mL/min/1.73m2. Overall, 21.1% of patients had a history of HF, 12.4% MI, and 11.3% prior stroke. With regard to treatments, all patients were taking renin-angiotensin system inhibitors, but only 13.5% of patients at maximal doses. A total of 3426 (47.4%) patients had T2D. Patients with T2D were older (77.1 vs. 76.3 years; P=0.045), and had higher UACR (423.8 vs. 352.4mg/g), and HbA1c (7.6 vs. 5.9%; P<0.001), but without significant differences in eGFR (49.5 vs. 50.0mL/min/1.73m2). In addition, comorbidities were more common among patients with T2D compared to those without T2D. Overall, in the DAPA-CKD like population, 95.6% had stage 3 or 4 CKD. UACR increased as renal function worsened (from 129.3 in patients with stage 2 CKD to 1713.4mg/g among stage 4 CKD patients; P<0.001), as well as comorbidities. In addition, the proportion of patients at maximal doses of ACEi or ARBs also increased as stage CKD worsened (from 9.8% in patients with stage 2 CKD to 17.1% among stage 4 CKD patients; P<0.001) (Table 4).
Baseline clinical characteristics of the DAPA-CKD population at index date (1st January 2018) and according to the presence of type 2 diabetes and CKD stage.
| Diabetes status | CKD stage | Total | ||||||||||||
|---|---|---|---|---|---|---|---|---|---|---|---|---|---|---|
| Non T2D | T2D | P | Stage 1 | Stage 2 | Stage 3a | P3a vs. 2 | Stage 3b | P3bs2 | Stage 4 | P4 vs. 2 | Stage 5 | Unspecified | (n = 7224%) | |
| (n=3798;52.6%) | (n=3426;47.4%) | (n=0) | (n=315;4.4%) | (n=3242;44.9%) | (n=2771;38.4%) | (n=896;12.4%) | (n=0) | (n=0) | ||||||
| Age, years | 76.3 | 77.1 | NA | 77.0 | 76.8 | 80.5 | 79.4 | NA | NA | 77.0 | ||||
| ≥85 years, n (%) | 1162 (30.6) | 893 (26.1) | 0.045 | NA | 64 (20.3) | 889 (27.4) | 0.007 | 828 (29.9) | 0.001 | 274 (30.6) | 0.001 | NA | NA | 2055 (26.3) |
| Sex, female, n (%) | 1894 (49.9) | 1606 (46.9) | 0.011 | NA | 153 (48.6) | 1545 (47.7) | 0.760 | 1376 (49.7) | 0.711 | 426 (47.5) | 0.737 | NA | NA | 3424 (47.4) |
| Physical examination and laboratory tests | ||||||||||||||
| SBP, mmHg | 136.5 | 139.9 | <0.001 | NA | 138.5 | 138.1 | 138.7 | 136.4 | NA | NA | 138.1 | |||
| UACR | 352.4 | 423.8 | <0.001 | NA | 129.3 | 256.3 | 258.1 | 1713.4 | NA | NA | 391.5 | |||
| UACR A1 | 0 | 0 | – | NA | 0 | 0 | 0 | 0 | NA | NA | 0 | |||
| UACR A2 | 2386 (62.8) | 2245 (61.4) | 0.221 | NA | 315 (100) | 2150 (66.3) | <0.001 | 1826 (65.9) | 340 (38.0) | NA | NA | 4631 (64.1) | ||
| UACR A3 | 1312 (37.2) | 1281 (38.6) | 0.221 | NA | 0 | 1092 (33.7) | 945 (34.1) | 556 (62.1) | NA | NA | 2593 (35.9) | |||
| eGFR* | 50.0 | 49.5 | 0.724 | NA | 75.0 | 51.9 | 37.1 | 22.2 | NA | NA | 49.8 | |||
| eGFR ≥90*, n (%) | 0 | 0 | – | NA | 0 | 0 | 0 | 0 | NA | NA | 0 | |||
| eGFR 60–89*, n (%) | 177 (4.7) | 138 (4.0) | 0.146 | NA | 315 (100) | 0 | 0 | 0 | NA | NA | 315 (4.4) | |||
| eGFR 45–59*, n (%) | 1810 (47.7) | 1432 (41.8) | <0.001 | NA | 0 | 3242 (100) | 0 | 0 | NA | NA | 3242 (44.9) | |||
| eGFR 30–44*, n (%) | 1358 (35.8) | 1413 (41.2) | <0.001 | NA | 0 | 0 | 2771 (100) | 0 | NA | NA | 2771 (38.4) | |||
| eGFR 15–29*, n (%) | 453 (11.9) | 443 (12.9) | 0.197 | NA | 0 | 0 | 0 | 896 (100) | NA | NA | 896 (12.4) | |||
| eGFR <15*, n (%) | 0 | 0 | – | NA | 0 | 0 | 0 | 0 | NA | NA | 0 | |||
| HbA1c, % | 5.9 | 7.6 | <0.001 | NA | 6.6 | 6.6 | 0.999 | 6.6 | 0.999 | 7.1 | 0.764 | NA | NA | 7.0 |
| Creatinine, mg/dL | 1.1 | 1.2 | <0.001 | NA | 1.0 | 1.3 | 0.650 | 1.6 | 0.685 | 2.2 | 0.178 | NA | NA | 1.1 |
| Uric acid, g/dL | 5.9 | 6.9 | <0.001 | NA | 7.0 | 6.8 | 0.893 | 6.3 | 0.730 | 7.0 | 0.999 | NA | NA | 6.4 |
| Comorbidities,N(%) | ||||||||||||||
| CKD – Chronic | 3798 (100) | 3426 (100) | – | NA | 315 (100) | 3242 (100) | 2771 (100) | 896 (100) | NA | NA | 7224 (100) | |||
| Stage 1 | 0 | 0 | – | NA | 0 | 0 | 0 | 0 | NA | NA | 0 | |||
| Stage 2 | 177 (4.7) | 138 (4.0) | 0.146 | NA | 315 (100) | 0 | 0 | 0 | NA | NA | 315 (17.2) | |||
| Stage 3a | 1810 (47.7) | 1432 (41.8) | <0.001 | NA | 0 | 3242 (100) | 0 | 0 | NA | NA | 3242 (31.8) | |||
| Stage 3b | 1358 (35.8) | 1413 (41.2) | <0.001 | NA | 0 | 0 | 2771 (100) | 0 | NA | NA | 2771 (27.5) | |||
| Stage 4 | 453 (11.9) | 443 (12.9) | 0.197 | NA | 0 | 0 | 0 | 896 (100) | NA | NA | 896 (7.9) | |||
| Stage 5 | 0 | 0 | – | NA | 0 | 0 | 0 | 0 | NA | NA | 0 | |||
| Not staged | 0 | 0 | – | NA | 0 | 0 | 0 | 0 | NA | NA | 0 | |||
| Unspecified | 1122 (29.5) | 166 (4.8) | <0.001 | NA | 46 (14.6) | 587 (18.1) | 0.121 | 510 (18.4) | 0.096 | 145 (16.2) | 0.503 | NA | NA | 1288 (17.8) |
| CKD – Diabetic | 8 (0.2) | 1991 (58.1) | <0.001 | NA | 98 (31.1) | 878 (27.1) | 0.129 | 756 (27.3) | 0.153 | 267 (29.8) | 0.665 | NA | NA | 1999 (27.7) |
| CKD – Hypertensive | 2668 (70.2) | 1269 (37.0) | <0.001 | NA | 171 (54.3) | 1777 (54.8) | 0.865 | 1505 (54.3) | 0.999 | 484 (54.0) | 0.927 | NA | NA | 3937 (54.5) |
| Dialysis | 0 | 0 | – | NA | 0 | 0 | – | 0 | – | 0 | – | NA | NA | 0 |
| CVD | 633 (16.7) | 714 (20.8) | 0.001 | NA | 50 (15.9) | 621 (19.2) | 0.153 | 527 (19.0) | 0.181 | 149 (16.6) | 0.773 | NA | NA | 1347 (20.5) |
| Myocardial infarction | 423 (11.1) | 524 (15.3) | 0.001 | NA | 38 (12.1) | 408 (12.6) | 0.798 | 367 (13.2) | 0.583 | 134 (15.0) | 0.205 | NA | NA | 947 (12.4) |
| Heart failure | 713 (18.8) | 814 (23.8) | <0.001 | NA | 43 (13.7) | 664 (20.5) | 0.004 | 609 (22.0) | 0.001 | 211 (23.5) | <0.001 | NA | NA | 1527 (21.1) |
| Stroke | 384 (10.1) | 401 (11.7) | 0.029 | NA | 27 (8.6) | 322 (9.9) | 0.459 | 342 (12.3) | 0.055 | 94 (10.5) | 0.334 | NA | NA | 785 (11.3) |
| Atrial Fibrillation | 674 (17.8) | 588 (17.2) | 0.503 | NA | 44 (14.0) | 560 (17.3) | 0.137 | 500 (18.0) | 0.077 | 158 (17.6) | 0.140 | NA | NA | 1262 (17.0) |
| PAD | 162 (4.3) | 208 (6.1) | 0.001 | NA | 15 (4.8) | 169 (5.2) | 0.759 | 136 (4.9) | 0.938 | 50 (5.6) | 0.589 | NA | NA | 370 (6.1) |
| Diabetic CKD | 8 (0.2) | 1991 (58.1) | <0.001 | NA | 98 (31.1) | 878 (27.1) | 0.129 | 756 (27.3) | 0.153 | 267 (29.8) | 0.665 | NA | NA | 1999 (36.9) |
| Diabetes | 0 | 3658 (100) | <0.001 | NA | 162 (51.4) | 1611 (49.7) | 0.565 | 1383 (49.9) | 0.614 | 502 (56.0) | 0.158 | NA | NA | 3658 (50.6) |
| Hyperkalemia | 153 (4.0) | 204 (6.0) | <0.001 | NA | 15 (4.8) | 142 (4.4) | 0.742 | 138 (5.0) | 0.877 | 62 (6.9) | 0.189 | NA | NA | 357 (7.3) |
| Gout | 1227 (32.3) | 1127 (32.9) | 0.587 | NA | 91 (28.9) | 1045 (32.2) | 0.230 | 916 (33.1) | 0.132 | 302 (33.7) | 0.118 | NA | NA | 2354 (32.7) |
| Medications,n(%) | ||||||||||||||
| Antihypertensives | 2881 (75.9) | 3035 (88.6) | <0.001 | NA | 240 (76.3) | 2577 (79.5) | 0.182 | 2317 (83.6) | 0.001 | 782 (87.3) | <0.001 | NA | NA | 5916 (81.9) |
| RAAS inhibitors | 3798 (100) | 3426 (100) | – | NA | 315 (100) | 3242 (100) | – | 2771 (100) | – | 896 (100) | – | NA | NA | 7224 (100) |
| ACEi | 1607 (42.3) | 1394 (40.7) | 0.168 | NA | 101 (32.1) | 1199 (37.0) | 0.085 | 1255 (45.3) | <0.001 | 446 (49.8) | <0.001 | NA | NA | 3001 (41.5) |
| ACEi at maximal doses | 220 (5.8) | 216 (6.3) | 0.373 | NA | 14 (4.4) | 182 (5.6) | 0.372 | 172 (6.2) | 0.203 | 68 (7.6) | 0.052 | NA | NA | 436 (6.0) |
| ARBs | 2191 (57.7) | 2032 (59.3) | 0.168 | NA | 145 (46.0) | 1687 (52.0) | 0.042 | 1587 (57.3) | <0.001 | 804 (89.7) | <0.001 | NA | NA | 4223 (58.5) |
| ARBs at maximal doses | 273 (7.2) | 271 (7.9) | 0.260 | NA | 17 (5.4) | 215 (6.6) | 0.409 | 227 (8.2) | 0.081 | 85 (9.5) | 0.024 | NA | NA | 544 (7.5) |
| Aldoster one antagonists | 212 (5.6) | 281 (8.2) | <0.001 | NA | 17 (5.4) | 192 (5.9) | 0.718 | 200 (7.2) | 0.236 | 84 (9.4) | 0.027 | NA | NA | 493 (6.8) |
| Direct renin inhibitors | 45 (1.2) | 53 (1.6) | 0.147 | NA | 3 (1.0) | 40 (1.2) | 0.754 | 41 (1.5) | 0.482 | 14 (1.6) | 0.443 | NA | NA | 98 (1.4) |
| ARNI | 241 (6.4) | 267 (7.8) | 0.020 | NA | 16 (5.1) | 201 (6.2) | 0.436 | 209 (7.5) | 0.120 | 82 (9.2) | 0.022 | NA | NA | 508 (7.0) |
| Beta blockers | 1216 (32.0) | 1485 (43.4) | <0.001 | NA | 91 (28.9) | 1139 (35.1) | 0.027 | 1119 (40.4) | <0.001 | 352 (39.3) | <0.001 | NA | NA | 2701 (37.4) |
| Diuretics | 1385 (36.5) | 1571 (45.9) | <0.001 | NA | 94 (29.8) | 1167 (36.0) | 0.028 | 1202 (43.4) | <0.001 | 493 (55.0) | <0.001 | NA | NA | 2956 (40.9) |
| Thiazide diuretics | 153 (4.0) | 171 (5.0) | 0.040 | NA | 11 (3.5) | 125 (3.9) | 0.725 | 124 (4.5) | 0.412 | 64 (7.1) | 0.022 | NA | NA | 324 (4.5) |
| Loop diuretics | 1237 (32.6) | 1400 (40.9) | <0.001 | NA | 84 (26.7) | 1089 (33.6) | 0.013 | 1062 (38.3) | <0.001 | 402 (44.9) | <0.001 | NA | NA | 2637 (36.5) |
| Potassium sparing diuretics | 265 (7.0) | 318 (9.3) | <0.001 | NA | 19 (6.0) | 222 (6.9) | 0.545 | 230 (8.3) | 0.155 | 112 (12.5) | 0.001 | NA | NA | 583 (8.1) |
| CCB | 1064 (28.0) | 1292 (37.7) | <0.001 | NA | 84 (26.7) | 909 (28.0) | 0.623 | 994 (35.9) | 0.001 | 369 (41.2) | <0.001 | NA | NA | 2356 (32.6) |
| Dihydropyridines | 972 (25.6) | 1203 (35.1) | <0.001 | NA | 74 (23.5) | 849 (26.2) | 0.297 | 909 (32.8) | 0.001 | 343 (38.3) | <0.001 | NA | NA | 2175 (30.1) |
| Non-dihydropyridines | 134 (3.5) | 120 (3.5) | 0.999 | NA | 8 (2.5) | 100 (3.1) | 0.554 | 98 (3.5) | 0.353 | 48 (5.4) | 0.035 | NA | NA | 254 (3.5) |
| Antidiabetics | 106 (2.8) | 2846 (83.1) | <0.001 | NA | 91 (28.9) | 1156 (35.7) | 0.016 | 1258 (45.4) | <0.001 | 447 (49.9) | <0.001 | NA | NA | 2952 (40.9) |
| Metformin | 0 | 1676 (48.9) | <0.001 | NA | 45 (14.3) | 686 (21.2) | 0.004 | 689 (24.9) | <0.001 | 256 (28.6) | <0.001 | NA | NA | 1676 (23.2) |
| Sulfonylurea | 0 | 448 (13.1) | <0.001 | NA | 12 (3.8) | 184 (5.7) | 0.159 | 185 (6.7) | 0.005 | 67 (7.5) | 0.022 | NA | NA | 448 (6.2) |
| DPP4 inhibitors | 0 | 1359 (39.7) | <0.001 | NA | 51 (16.2) | 543 (16.7) | 0.820 | 531 (19.2) | 0.197 | 234 (26.1) | <0.001 | NA | NA | 1359 (18.8) |
| SGLT-2 inhibitors | 0 | 163 (4.8) | <0.001 | NA | 6 (1.9) | 64 (2.0) | 0.904 | 69 (2.5) | 0.513 | 24 (2.7) | 0.433 | NA | NA | 163 (2.3) |
| GLP-1 receptor agonists | 0 | 127 (3.7) | <0.001 | NA | 4 (1.3) | 55 (1.7) | 0.596 | 49 (1.8) | 0.521 | 19 (2.1) | 0.370 | NA | NA | 127 (1.8) |
| Metiglinides | 0 | 496 (14.5) | <0.001 | NA | 16 (5.1) | 198 (6.1) | 0.476 | 205 (7.4) | 0.134 | 77 (8.6) | 0.045 | NA | NA | 496 (6.9) |
| Glitazones | 0 | 105 (3.1) | <0.001 | NA | 3 (1.0) | 44 (1.4) | 0.559 | 37 (1.3) | 0.652 | 21 (2.3) | 0.152 | NA | NA | 105 (1.5) |
| Acarbose | 0 | 111 (3.2) | <0.001 | NA | 6 (1.9) | 42 (1.3) | 0.379 | 39 (1.4) | 0.482 | 24 (2.7) | 0.433 | NA | NA | 111 (1.5) |
| Insulin | 106 (2.8) | 723 (21.1) | <0.001 | NA | 28 (8.9) | 335 (10.3) | 0.433 | 312 (11.3) | 0.198 | 154 (17.2) | <0.001 | NA | NA | 829 (11.5) |
| Statins | 1791 (47.2) | 2183 (63.7) | <0.001 | NA | 118 (37.5) | 1694 (52.3) | <0.001 | 1570 (56.7) | <0.001 | 592 (66.1) | <0.001 | NA | NA | 3974 (55.0) |
| Warfarin | 504 (13.3) | 496 (14.5) | 0.141 | NA | 36 (11.4) | 386 (11.9) | 0.793 | 422 (15.2) | 0.072 | 156 (17.4) | 0.012 | NA | NA | 1000 (13.8) |
| Low dose aspirin | 982 (25.9) | 969 (28.3) | <0.001 | NA | 63 (20.0) | 806 (24.9) | 0.053 | 801 (28.9) | 0.001 | 281 (31.4) | <0.001 | NA | NA | 1951 (27.0) |
| Receptor P2Y12 antagonists | 46 (1.2) | 79 (2.3) | <0.001 | NA | 4 (1.3) | 48 (1.5) | 0.779 | 50 (1.8) | 0.521 | 23 (2.6) | 0.182 | NA | NA | 125 (1.7) |
ACEi: angiotensin-converting enzyme inhibitors; ARBs: angiotensin receptor blockers; ARNI: angiotensin receptor and neprilysin inhibition; BMI: body mass index; CCB: Calcium channel blockers; CVD: cardiovascular disease; CKD: chronic kidney disease; DPP4: dipeptidyl peptidase 4; eGFR: estimated glomerular filtration rate; * mL/min/1.73m2; GLP-1: glucagon-like peptide-1; NA: not applicable; PAD: peripheral artery disease; RAAS: renin angiotensin system; SBP: systolic blood pressure; SGLT-2: sodium-glucose Cotransporter-2; UACR: Urine albumin-to-Creatinine Ratio.
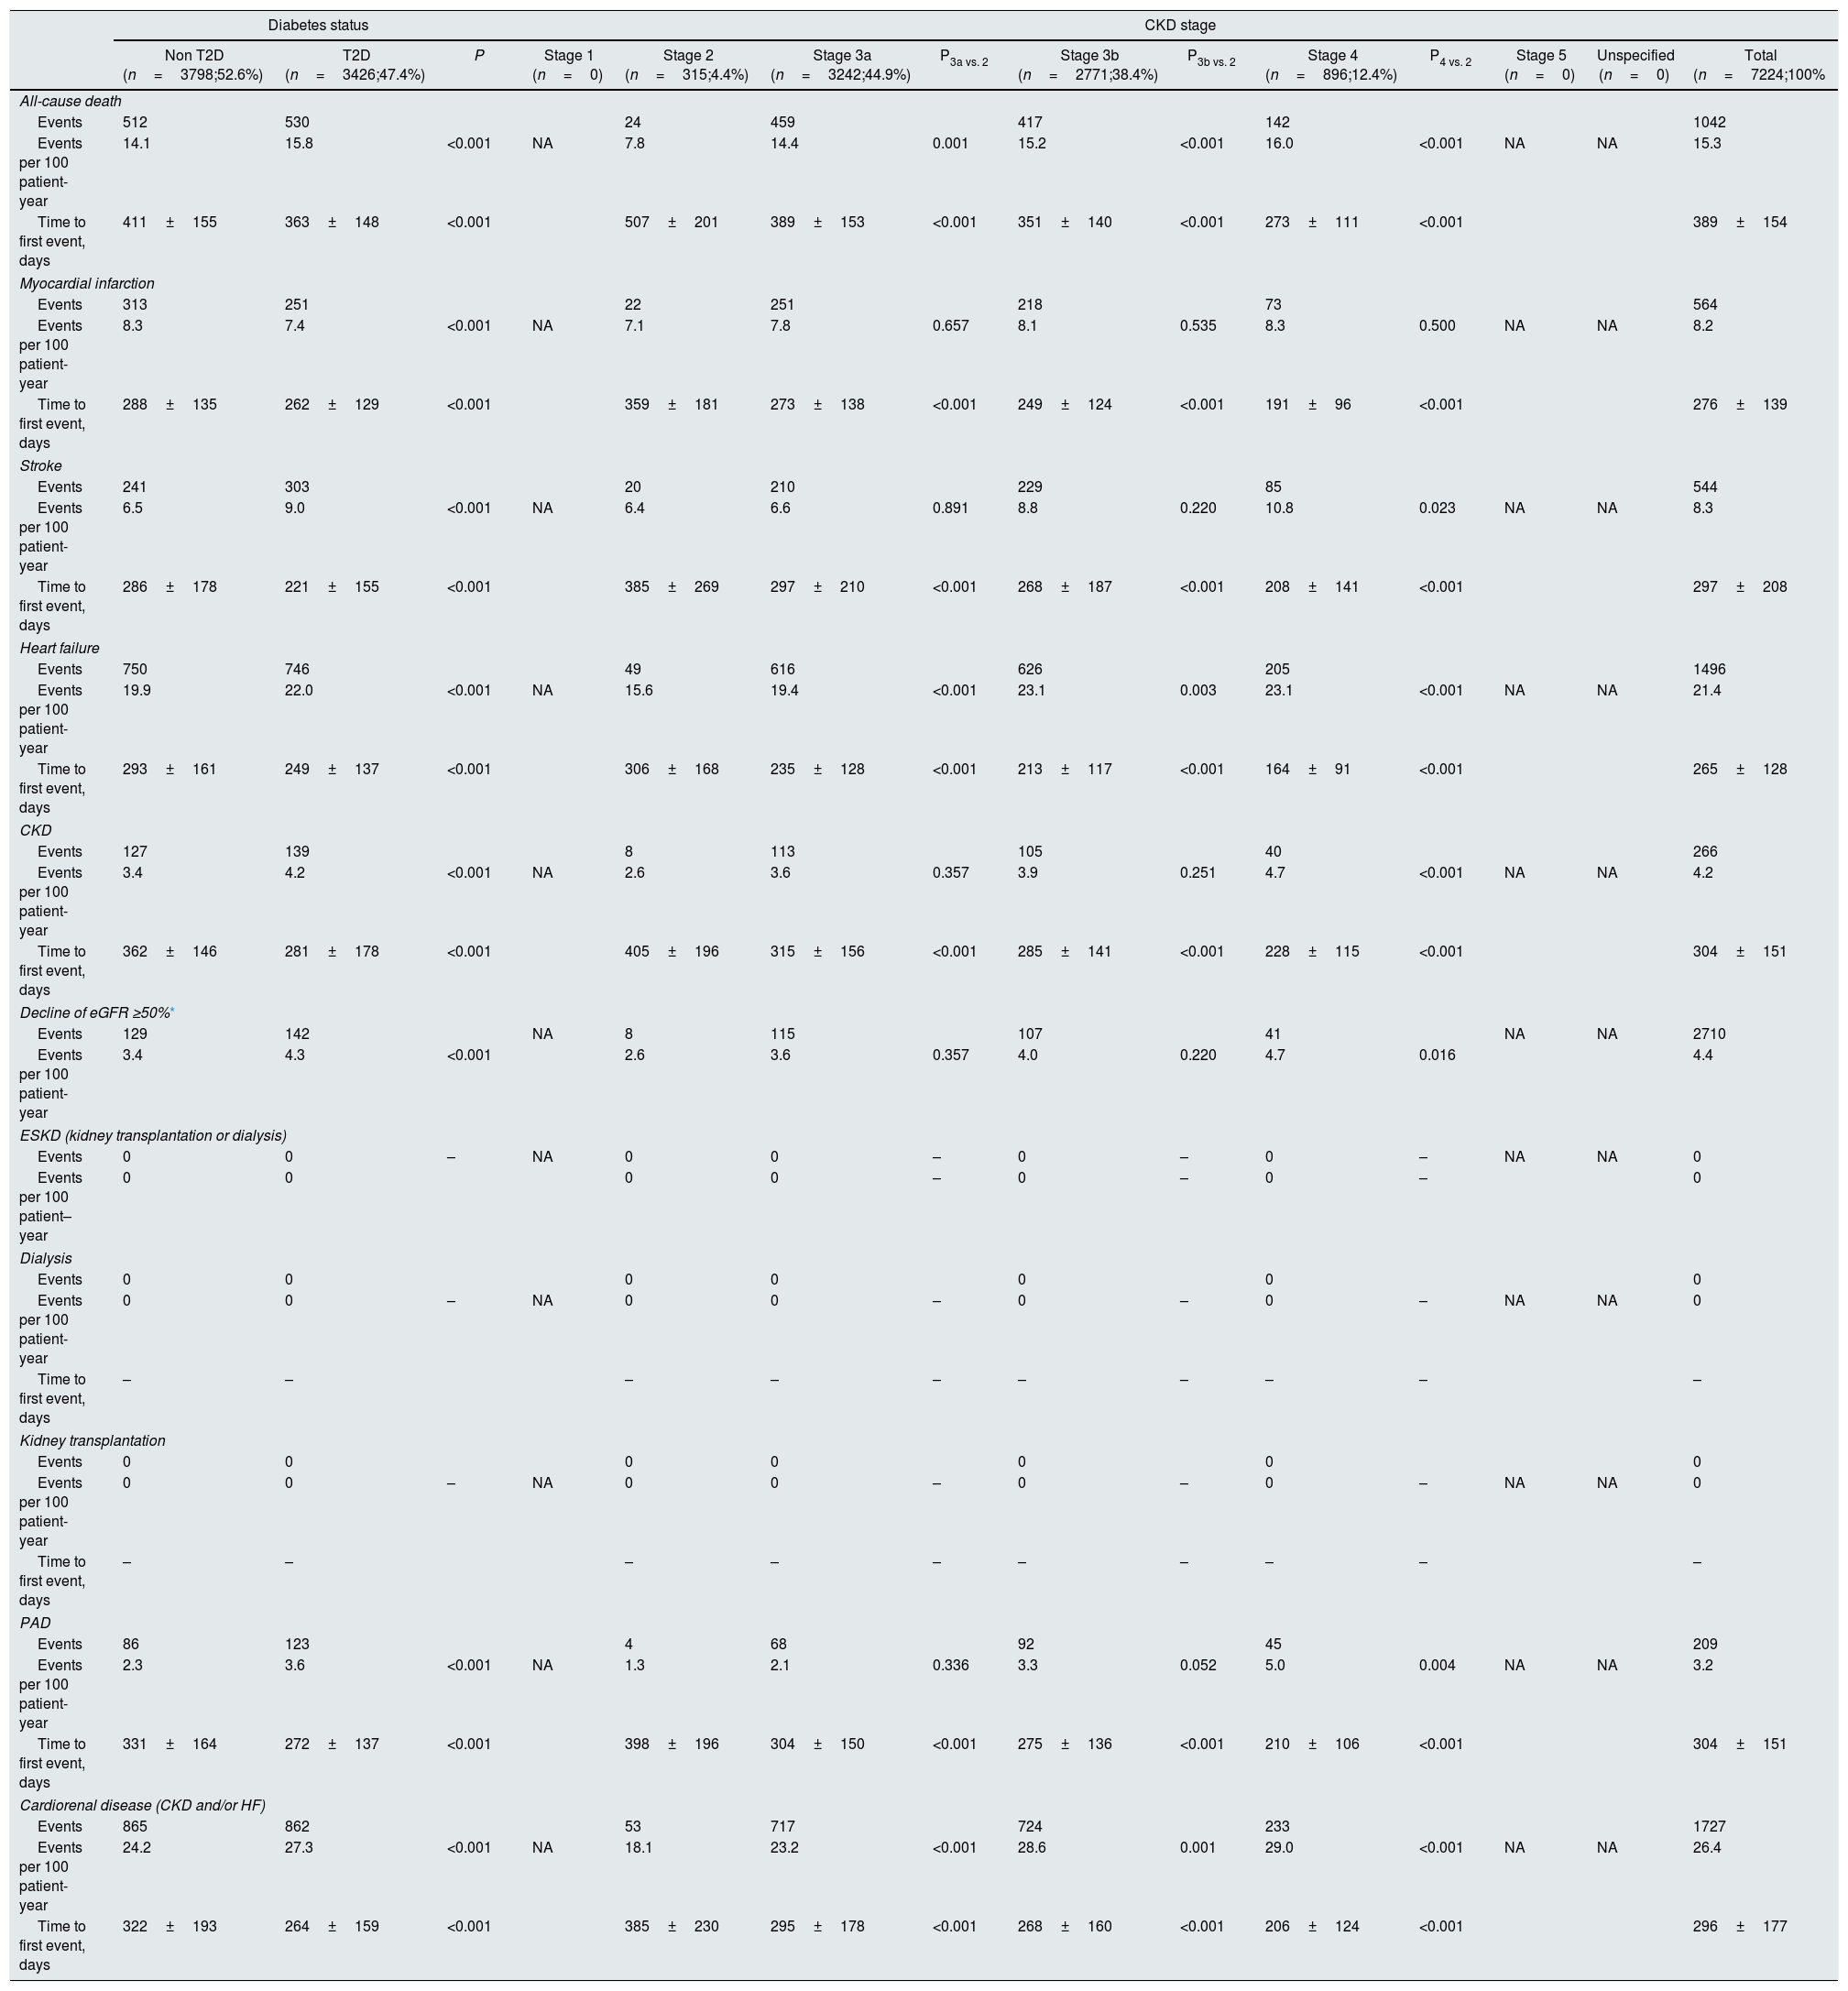
In the DAPA-CKD-like population, after 2 years of follow-up, rates of HF, all-cause death, MI, stroke, CKD and PAD were 21.4, 15.3, 8.2, 8.3, 4.2 and 3.2 events per 100 patient-years, respectively. With regard to CKD endpoints, rates of decline of eGFR ≥50% were 4.4 events per 100 patient-years, but no cases of end-stage kidney disease, dialysis, and kidney transplantation were reported. Rates of the combined endpoint of CKD and/or HF were 26.4 events per 100 patient-years. Except for MI, rates of all-cause death, cardiovascular and renal outcomes were significantly higher among patients with T2D, compared to those without T2D. Similarly, rates of all-cause death, cardiovascular and renal outcomes increased as CKD stage worsened. For example, rates of combined endpoint of CKD and/or HF increased from 18.1 events per 100 patient-years in patients with stage 2 CKD to 29.0 events per 100 patient-years among stage 4 CKD patients (Table 5).
Event rates after 2 years of follow-up in the DAPA-CKD population and according to the presence of type 2 diabetes and CKD stage.
| Diabetes status | CKD stage | |||||||||||||
|---|---|---|---|---|---|---|---|---|---|---|---|---|---|---|
| Non T2D (n=3798;52.6%) | T2D (n=3426;47.4%) | P | Stage 1 (n=0) | Stage 2 (n=315;4.4%) | Stage 3a (n=3242;44.9%) | P3a vs. 2 | Stage 3b (n=2771;38.4%) | P3b vs. 2 | Stage 4 (n=896;12.4%) | P4 vs. 2 | Stage 5 (n=0) | Unspecified (n=0) | Total (n=7224;100% | |
| All-cause death | ||||||||||||||
| Events | 512 | 530 | 24 | 459 | 417 | 142 | 1042 | |||||||
| Events per 100 patient-year | 14.1 | 15.8 | <0.001 | NA | 7.8 | 14.4 | 0.001 | 15.2 | <0.001 | 16.0 | <0.001 | NA | NA | 15.3 |
| Time to first event, days | 411±155 | 363±148 | <0.001 | 507±201 | 389±153 | <0.001 | 351±140 | <0.001 | 273±111 | <0.001 | 389±154 | |||
| Myocardial infarction | ||||||||||||||
| Events | 313 | 251 | 22 | 251 | 218 | 73 | 564 | |||||||
| Events per 100 patient-year | 8.3 | 7.4 | <0.001 | NA | 7.1 | 7.8 | 0.657 | 8.1 | 0.535 | 8.3 | 0.500 | NA | NA | 8.2 |
| Time to first event, days | 288±135 | 262±129 | <0.001 | 359±181 | 273±138 | <0.001 | 249±124 | <0.001 | 191±96 | <0.001 | 276±139 | |||
| Stroke | ||||||||||||||
| Events | 241 | 303 | 20 | 210 | 229 | 85 | 544 | |||||||
| Events per 100 patient-year | 6.5 | 9.0 | <0.001 | NA | 6.4 | 6.6 | 0.891 | 8.8 | 0.220 | 10.8 | 0.023 | NA | NA | 8.3 |
| Time to first event, days | 286±178 | 221±155 | <0.001 | 385±269 | 297±210 | <0.001 | 268±187 | <0.001 | 208±141 | <0.001 | 297±208 | |||
| Heart failure | ||||||||||||||
| Events | 750 | 746 | 49 | 616 | 626 | 205 | 1496 | |||||||
| Events per 100 patient-year | 19.9 | 22.0 | <0.001 | NA | 15.6 | 19.4 | <0.001 | 23.1 | 0.003 | 23.1 | <0.001 | NA | NA | 21.4 |
| Time to first event, days | 293±161 | 249±137 | <0.001 | 306±168 | 235±128 | <0.001 | 213±117 | <0.001 | 164±91 | <0.001 | 265±128 | |||
| CKD | ||||||||||||||
| Events | 127 | 139 | 8 | 113 | 105 | 40 | 266 | |||||||
| Events per 100 patient-year | 3.4 | 4.2 | <0.001 | NA | 2.6 | 3.6 | 0.357 | 3.9 | 0.251 | 4.7 | <0.001 | NA | NA | 4.2 |
| Time to first event, days | 362±146 | 281±178 | <0.001 | 405±196 | 315±156 | <0.001 | 285±141 | <0.001 | 228±115 | <0.001 | 304±151 | |||
| Decline of eGFR ≥50%* | ||||||||||||||
| Events | 129 | 142 | NA | 8 | 115 | 107 | 41 | NA | NA | 2710 | ||||
| Events per 100 patient-year | 3.4 | 4.3 | <0.001 | 2.6 | 3.6 | 0.357 | 4.0 | 0.220 | 4.7 | 0.016 | 4.4 | |||
| ESKD (kidney transplantation or dialysis) | ||||||||||||||
| Events | 0 | 0 | – | NA | 0 | 0 | – | 0 | – | 0 | – | NA | NA | 0 |
| Events per 100 patient–year | 0 | 0 | 0 | 0 | – | 0 | – | 0 | – | 0 | ||||
| Dialysis | ||||||||||||||
| Events | 0 | 0 | 0 | 0 | 0 | 0 | 0 | |||||||
| Events per 100 patient-year | 0 | 0 | – | NA | 0 | 0 | – | 0 | – | 0 | – | NA | NA | 0 |
| Time to first event, days | – | – | – | – | – | – | – | – | – | – | ||||
| Kidney transplantation | ||||||||||||||
| Events | 0 | 0 | 0 | 0 | 0 | 0 | 0 | |||||||
| Events per 100 patient-year | 0 | 0 | – | NA | 0 | 0 | – | 0 | – | 0 | – | NA | NA | 0 |
| Time to first event, days | – | – | – | – | – | – | – | – | – | – | ||||
| PAD | ||||||||||||||
| Events | 86 | 123 | 4 | 68 | 92 | 45 | 209 | |||||||
| Events per 100 patient-year | 2.3 | 3.6 | <0.001 | NA | 1.3 | 2.1 | 0.336 | 3.3 | 0.052 | 5.0 | 0.004 | NA | NA | 3.2 |
| Time to first event, days | 331±164 | 272±137 | <0.001 | 398±196 | 304±150 | <0.001 | 275±136 | <0.001 | 210±106 | <0.001 | 304±151 | |||
| Cardiorenal disease (CKD and/or HF) | ||||||||||||||
| Events | 865 | 862 | 53 | 717 | 724 | 233 | 1727 | |||||||
| Events per 100 patient-year | 24.2 | 27.3 | <0.001 | NA | 18.1 | 23.2 | <0.001 | 28.6 | 0.001 | 29.0 | <0.001 | NA | NA | 26.4 |
| Time to first event, days | 322±193 | 264±159 | <0.001 | 385±230 | 295±178 | <0.001 | 268±160 | <0.001 | 206±124 | <0.001 | 296±177 | |||
In our study, the prevalence of CKD was nearly 5% with an older population than in previous studies. Comorbidities such as HF and T2D were common, meaning that these greatly increase the risk of having CKD. In the last years, a number of studies have analyzed the prevalence of CKD worldwide. For instance, a study that estimated CKD prevalence in the European adult general population showed considerable differences between countries, from 3% to 17%, when considering CKD stages 1–5 and from 1% to 6%, when considering CKD stages 3–5. It is important to emphasize that the CKD prevalence stratified by diabetes, hypertension, and obesity status followed the same pattern as the overall prevalence.2 As a result, to understand differences in CKD prevalence between countries, not only age, but also the distribution of risk factors should be considered. In Spain, the Hortega study was a cross-sectional study that collected data from 1997 to 2000 and showed that the prevalence of stage 2 CKD affected at least one third of the general population whereas stage 3 CKD ranged from 3% to almost 9% of individuals.12 The EPIRCE study was an epidemiologic, general population-based, cross-sectional study that included a randomly selected Spanish sample aged 20 years or older from January 2004 to January 2008. In this study, the overall prevalence of CKD stages 3–5 was 6.8%, but when the UACR was added to the diagnostic criteria, the prevalence rose to 9.2%.13 A more recent study performed in 11,505 individuals representative of the Spanish adult population and recruited from June 2008 to October 2010, showed a prevalence of CKD of 15%. The prevalence of CKD increased with age, and the presence of previous cardiovascular disease of cardiovascular risk factors.14 On the other hand, underdiagnosis is a commonly observed issue in the early detection of CKD, as shown in a cross-sectional study performed in the Basic Health Area of Balaguer (Lleida), in which an initial prevalence of 3.98% was increased up to 6.00% after performing a review of CKD diagnostic criteria, denoting the existence of diagnostic and coding errors.4
Our data were provided by BIG-PAC®. This electronic database has been validated as an information source for studies of epidemiology, therapeutic adaptation and health/non-healthcare resource use and it has been demonstrated its representativeness of the Spanish population.15,18 As a result, our data suggest that the prevalence of CKD could have changed in the last years in Spain. However, there are many reasons that may explain these differences beyond a real change in the CKD prevalence. Among these reasons, differences in the methodology of the studies, not only for the inclusion of patients (i.e. population based study vs. database studies), but also in the way CKD prevalence was determined (i.e. the use of one-off testing for assessment of eGFR or albuminuria to define the prevalence of CKD, the use of CKD-EPI equation vs. other formula, population based study [i.e. EPIRCE] vs. database-based study, etc.) could have played a role.12–14,19–21 Moreover, in our study, due to its retrospective design, some relevant data (i.e. albuminuria) could not be documented in all patients, leading to an underdiagnosis of CKD. In fact, previous studies have also shown an underdiagnosis of CKD of database studies compared to population based studies.4 On the other hand, it is likely that the higher use of CKD prevention treatments have had some impact on changes in CKD prevalence.1 In the EPIRCE study, 11% of patients had diabetes and 5% ischemic heart disease.13 In the work of Gorostidi et al., 17% had diabetes and 6% previous cardiovascular disease.14 In our study, approximately half of patients had T2D, 21% a history of HF, and 14% prior MI. Around 70% of patients were taking renin-angiotensin system inhibitors and this proportion increased as renal function worsened. Different guidelines recommend the use of renin-angiotensin system inhibitors for the prevention or delay of cardiovascular and renal diseases.22–24 Despite the high use of renin angiotensin system inhibitors, only 4% of patients were taking them at maximal doses. It is likely that the risk of hyperkalemia, particularly in those patients with advanced CKD could have played a role.25 However, it is important to mention that different studies have shown that the use of higher-dose compared with lower-dose angiotensin receptor blockers or the use of neprilysin inhibitors may be associated with better cardiovascular and renal outcomes.18,26–28 In addition, it has been reported that the use of guidelines recommended drugs is associated not only with a reduction of morbidity and mortality, but also with a reduction of healthcare costs.18
There is a clear relationship between CKD and HF.24 Fortunately, a number of clinical trials have shown in the last years that among patients with T2D, SGLT-2 inhibitors are associated with a reduction in the risk of major adverse cardiovascular events, and particularly with a decrease in the risk for HF hospitalization and kidney outcomes.29 In DECLARE-TIMI 58 trial, dapagliflozin prevented and reduced progression of kidney disease among T2D patients at high risk for cardiovascular events, in both, patients with normal or impaired renal function.30 In our study, only 3.5% of patients with T2D were taking SGLT-2 inhibitors. As a result, it is very likely that a higher prescription of guidelines recommended drugs would translate into a higher reduction in CKD prevalence. Likewise, the DAPA-CKD trial,10 aimed to assess the long-term efficacy and safety of the SGLT2 inhibitor dapagliflozin in patients with CKD, with or without T2D, was prematurely interrupted due to the beneficial effects on renal outcomes and the composite of death from cardiovascular causes or hospitalization for HF. In the CREDENCE (Canagliflozin and Renal Events in Diabetes with Established Nephropathy Clinical Evaluation) trial,11 canagliflozin reduced the risk of kidney failure and cardiovascular events in patients with T2D and CKD. Therefore, a higher use of SGLT2 inhibitors with proven efficacy among CKD population, regardless the presence of T2D, could delay the progression of renal disease and may reduce the incidence of CKD complications. In our study, cardiovascular outcomes were more common in the DAPA-CKD like subpopulation than in the general CKD population, suggesting that these patients would benefit more from this treatment.
Individuals with CKD are at increased risk of all-cause and cardiovascular premature death, and may progress to end-stage renal disease. In addition, CKD translates into increased health system costs.31–33 In our study, after 2 years of follow-up, rates of cardiovascular and renal outcomes were high, reaching nearly 21 events per 100 patient-years in the combined endpoint of CKD and/or HF. Moreover, during the study period, 44% of patients were hospitalized, 16% were hospitalized due to heart failure, and around 7% of patients died during hospitalization. Furthermore, rates of mortality, cardiovascular, particularly HF, and renal outcomes were significantly higher in the subgroup of patients with T2D. Therefore, it is necessary to implement a comprehensive management to prevent or delay the development of CKD (primary prevention) and its complications (secondary prevention), including end-stage renal disease that implies not only improving cardiovascular risk factors control, but also the use of guidelines recommended drugs, such as renin-angiotensin system blockers and SLGT-2 inhibitors.7–11,22 Unfortunately, our data showed that there is much room for improvement and more efforts are required to enhance the therapeutic approach of these patients.
LimitationsThis was an observational retrospective cohort study that used secondary data from electronic health records. Therefore, only indirect causality may be suggested. Moreover, due to the retrospective design of the study, some relevant data (i.e. albuminuria) could not be documented in all patients, leading to an underdiagnosis of CKD. On the contrary, time of evolution of CKD was not recorded and this could lead to an overdiagnosis of CKD in some individuals, as the definition of CKD requires at least 3 months of functional or structural renal impairment.7 However, although all these limitations could interfere with the prevalence of CKD, the high number of patients included, as well as the robustness of the data may allow to determine the value of the study. On the other hand, although data came from 7 Spanish regions, previous studies have shown that these data are representative of the Spanish population.15
ConclusionsOur data show that CKD in Spain is a relevant clinical condition with poor prognosis and suboptimal treatment. Population was older and comorbidities such as T2D and HF were common. Nearly 30% of patients with CKD are not taking renin angiotensin system blockers, and only 4% at maximal doses. Less than 4% of T2D patients are being treated with SGLT-2 inhibitors. Cardiovascular and renal outcomes are frequent, and markedly increase with the presence of T2D and with renal function decline. As the use of guidelines recommended treatments prevents or delays cardiovascular and renal progression, improving CKD management, particularly through the use of drugs with proven cardiovascular and renal benefit, is mandatory.
FundingThis study was funded by AstraZeneca, Spain. The funding body played no role in the design, data collection, analysis, interpretation of or in writing the manuscript.
Conflict of interestsThe authors declare that they have no conflict of interest.
The following are the supplementary data to this article:


