
Real-world analysis of the clinical profile, treatments, major adverse cardiovascular and renal events (MACE and MARE) in patients with different stages of chronic kidney disease (CKD) as defined by KDIGO guidelines.
MethodsThis was an observational, retrospective study using the BIG-PAC database. Adults with ≥1 measurement of estimated glomerular filtration rate (eGFR) and albumin-to-creatinine ratio (UACR) closest to 1st January 2018 (up to 6 months) were included. Patients were followed for two years.
ResultsAmong 70,385 subjects, 21,127 (30.0%) had CKD based on impaired renal function or increased albuminuria. Age and prevalence of diabetes and cardiovascular disease increased as kidney function decreased, or albuminuria rose. Renin–angiotensin system inhibitors were prescribed in 47.1–76.4% patients classified as G3a–G5 and mildly increased albuminuria (A1), 63.2–79.6% in G1–G5 and moderately increased albuminuria (A2), and 51.2–85.9% in G1–G5 and severely increased albuminuria (A3). The prescription of sodium-glucose cotransporter-2 inhibitors was marginal across KDIGO categories. The incidence rates (per 1000 patient-year) of MACE ranged 102.9–245.2 in patients classified as G3a–G5 A1, 40.7–261.1 in G1–G5 A2, and 69.1–362.3 in G1–G5 A3. Incidence rates of MARE ranged 14.9–454.4 in G3a–G5 A1, 29.8–588.5 in G1–5 A2, and 11.8–637.2 in G1–5 A3.
ConclusionsIn real-world, the risk of cardiovascular and renal complications rises as kidney function declines and albuminuria worsens. Guideline-recommended therapies remain underused.
Analizar el perfil clínico, tratamientos, eventos adversos cardiovasculares y renales mayores (MACE y MARE) en pacientes con enfermedad renal crónica (ERC) según los estadios KDIGO en el mundo real.
MétodosEstudio observacional, retrospectivo utilizando la base de datos BIG-PAC. Se incluyeron adultos con ≥1 medida del filtrado glomerular estimado (FGe) y cociente albúmina/creatinina (CAC) más próximos al 1/enero/2018 (hasta 6 meses). Los pacientes fueron seguidos durante dos años.
ResultadosDe los 70.385 sujetos, 21.127 (30,0%) presentaban ERC por deterioro de función renal o aumento de albuminuria. La edad y la prevalencia de diabetes y enfermedades cardiovasculares aumentaron a medida que disminuía la función renal o aumentaba la albuminuria. Se prescribieron inhibidores del sistema renina-angiotensina en 47.1-76.4% de los pacientes clasificados como G3a a G5 y albuminuria (A1) levemente aumentada, 63,2-79,6% en G1 a G5 y albuminuria moderadamente aumentada (A2), y 51,2-85,9% en G1 a G5 y albuminuria severamente aumentada (A3). La prescripción de inhibidores del cotransportador de sodio-glucosa-2 fue marginal en todas las categorías KDIGO. Las tasas de incidencia (por 1000 pacientes-año) de MACE oscilaron entre 102,9 y 245,2 en los pacientes clasificados como G3a-5 A1, 40,7-261,1 en G1-5 A2 y 69,1-362,3 en G1-5 A3. Las de MARE oscilaron entre 14,9 y 454,4 en G3a-5 A1, 29,8-588,5 en G1-5 A2 y 11,8-637,2 en G1-5 A3.
ConclusionesEn el mundo real, el riesgo de complicaciones cardiovasculares y renales aumenta a medida que la función renal disminuye y la albuminuria empeora. Las terapias recomendadas por las guías siguen estando infrautilizadas.
Chronic kidney disease (CKD) is defined as abnormalities of kidney structure or function, present at least for 3 months, with health consequences. CKD is classified based on etiology, estimated glomerular filtration rate (eGFR) (G1–G5 categories), and urine albumin-to-creatinine ratio (UACR) (A1–A3 categories).1 Different studies have analyzed the prevalence of CKD in the adult population, defined as either eGFR <60ml/min/1.73m2 and/or increased UACR (≥30mg/g, A2–A3), with values that range from 15 to 30%, according to the study population.2–5 CKD is associated with a marked increase in the risk of cardiovascular outcomes and renal disease progression.6–8 As a result, the early detection of CKD seems mandatory to provide the best management to reduce CKD burden.9–13
Most of the evidence on CKD population primarily relies on randomized controlled trials (RCTs), which often exclude high-risk populations attended in real-world settings.9–13 By contrast, real-world data (RWD) provides relevant insights into clinical practice.14,15 For instance, a recent study demonstrated significant differences among diabetic kidney disease patients in RCT and RWD.16 These discrepancies, including differences in patient demographics, treatment patterns, and data completeness, underscore the importance of integrating RWD into clinical research to better reflect real-world treatment outcomes. As a result, RWD studies are changing the landscape of clinical research by shedding light on how therapies operate outside of the controlled context of RCTs.
Unfortunately, there are few RWD studies that have examined both cardiovascular and renal outcomes across the CKD stages defined by the Kidney Disease: Improving Global Outcomes (KDIGO) guidelines, or have addressed the analyses according to eGFR or UACR, but not both simultaneously.6–8 Additionally, a limited number of studies have provided a comprehensive assessment of adherence to guideline-recommended therapies in CKD population across KDIGO stages and how prescription patterns evolve across CKD severity categories in real-world practice.17–21 Furthermore, factors such as demographic and cultural particularities of populations and differences in healthcare practices conditioned by economic or administrative factors might have an influence on the generalizability of RWD study findings.22,23 Therefore, collecting more RWD from diverse geographic regions and populations is essential to better understanding the global landscape of CKD and implementing targeted strategies to improve CKD management, specifically by addressing the gaps identified through local analyses.
In this study, a large population database was used to gain new RWD insights into the complexities and heterogeneity of CKD care in Spain, with a particular focus on the clinical profile, guideline-recommended therapies, major adverse cardiovascular events (MACE), and major adverse renal events (MARE) outcomes across all KDIGO stages.
MethodsWe performed an observational, retrospective, and RWD-based study using the BIG-PAC database. This database includes data of 1.8 million people of primary health centers and referral hospitals from seven Autonomous Communities of Spain. This database contains fully anonymized and dissociated secondary healthcare data and has been shown to be representative of the Spanish population.24 The study was approved by the Investigation Ethics Committee of Consorci Sanitari from Terrassa.
Adults should have at least one measurement of both eGFR and UACR in local laboratory tests close to 1st January 2018 (up to 6 months) separated by a maximum of 3 months to be included. In addition, patients should have at least 12 months of continuous presence in the database prior to the qualifying eGFR. The index date was the date of the eGFR measure closest to 1st January 2018 meeting the criteria. The study population (excluding patients on dialysis [n=356] or renal transplant [n=232], n=70,385) was staged according to KDIGO definitions based on eGFR and UACR values (model 1).1 Patients were followed during a 2-year period to analyze the occurrence of cardiovascular and renal outcomes. Additionally, a sensitivity analysis was performed in adults with at least two consecutive eGFR laboratory tests ≤730 days apart with values within the same stage range, and at least 12 months of continuous presence in the database prior to the first qualifying eGFR. This approach aimed to enhance the reliability of CKD classification by requiring two eGFR measurements over time rather than a single value, thereby reducing the risk of misclassification due to transient eGFR fluctuations. However, this stricter criterion led to a reduction in sample size, as individuals with only one qualifying eGFR measurement were excluded. Despite this trade-off, the consistency of findings across different approaches strengthens the robustness of our results. In this case (model 2), the index date was the date of the second conclusive eGFR measure closest to 1st January 2018. The study population (n=52,796) was staged according to KDIGO definitions based on eGFR and UACR values.1
Baseline characteristics across KDIGO categories, including demographics, comorbidities and medications were determined at index date. Demographics included age, sex, body mass index, and blood pressure. Comorbidities were searched for in all available data prior to the index date. The main baseline comorbidities included cardiovascular disease, coronary ischemic disease, heart failure, stroke, atrial fibrillation, peripheral artery disease (PAD), and diabetes. International Classification of Diseases (ICD)-9 and ICD-10 codes were considered for the diagnosis of comorbidities.25 The information about treatments was recorded from the registries for dispensing medicines, according to the Anatomical Therapeutic Chemical Classification System.26 Treatments were prescribed according to routine practice and included renin–angiotensin system inhibitors (RASi), mineralocorticoid receptor antagonists, angiotensin receptor-neprilysin inhibitors, sodium-glucose cotransporter-2 inhibitors (SGLT2i) in persons with or without diabetes, beta blockers, diuretics, calcium channel blockers, low dose aspirin, statins, and medications for diabetes (metformin, sulfonylureas, dipeptidyl peptidase-4 inhibitors (DPP-4i), glucagon-like peptide-1 receptor agonists (GLP-1 RA), meglitinides, and insulin). Laboratory tests closest to the index date were collected and included the following UACR, eGFR, HbA1c, creatinine, uric acid, potassium, hemoglobin, and lipid profile.
Cardiovascular and renal events were defined as a main diagnosis during a hospital visit or stay occurred during 2 years after index date. Cardiovascular outcomes included myocardial infarction, stroke, heart failure, peripheral artery disease, and MACE composed of any of the following outcomes: stroke, myocardial infarction or all-cause death. Renal outcomes included hospitalization for CKD, reduction of eGFR ≥50% from baseline, dialysis, kidney transplantation, progression from A1/A2 to A3, and a composed MARE of any of the previous renal outcomes. Outcomes were calculated in the population across KDIGO categories.
Statistical analysisCategorical variables were defined by their absolute numbers and proportions, the continuous variables by the mean and standard deviation. Incidence rates were presented as events (N) and rates (events per 1000 patient-years [p-y]). Follow-up was censored at the end of the observation period or death unless an event had occurred. In this study, we focused exclusively on descriptive analyses of RWD, and since no formal hypothesis testing was performed, p-values were not calculated.27 The data were analyzed using the statistical package SPSS v25.0 (SPSS Inc., Chicago, IL, USA), while R (version 4.0.2; R Foundation for Statistical Computing, Vienna, Austria) was employed to generate all data visualizations.
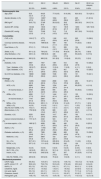
ResultsThe total population covered 70,385 subjects, of whom 49,258 (69.4%) had normal albuminuria (A1) and renal function (G1 or G2) and the remaining 21,127 (30.0%) had CKD by either renal function (CKD stages >G2) or albuminuria criteria.5 Among CKD population, the mean (SD) age ranged from 72.4 (20.1) to 82.6 (9.0) years in categories G3a–5 A1, from 56.6 (11.3) to 82.3 (10.1) years in categories G1–5 A2, and from 55.7 (11.2) to 77.1 (10.7) years in categories G1–5 A3. In these KDIGO categories, the proportion of women ranged from 46.8% to 69.7%, 46.1% to 61.2% and 34.9% to 45.5%, respectively. Regarding comorbidities, type 2 diabetes (T2D) was present in a range from 38.2% to 46.8%, 31.6% to 52.5% and 53.6% to 68.0% of patients, respectively, coronary heart disease in 8.8% to 20.3%, 4.4% to 18.4% and 6.3% to 19.4%, respectively, and heart failure in 10.7% to 27.4%, 3.1% to 31.4% and 3.4% to 32.6%, respectively. In general, an increase in age was associated with a reduction in kidney function or increased albuminuria. The proportion of women was increased as the eGFR decreased, but there were less women in the case of higher albuminuria. Body mass index was lower as kidney function decreased but it was higher among those patients with more albuminuria. Systolic blood pressure increased up to the G3a stage and then decreased; by contrast, diastolic blood pressure decreased as renal function worsened. HbA1c increased with albuminuria levels. LDL cholesterol was lower as renal function and albuminuria worsened. The prevalence of cardiovascular diseases, as well as each of the components, and T2D increased as renal function and albuminuria worsened (Table 1 and supplementary Figs. 1 and 2). The sensitivity analysis (model 2) showed similar results (supplementary Table 1).
Baseline characteristics by KDIGO risk category, n=70,385 subjects (model 1*).
| G1 A1 | G2 A1 | G3a A1 | G3b A1 | G4 A1 | G5 A1 (no dialysis) | |
|---|---|---|---|---|---|---|
| 35.13% | 34.86% | 4.96% | 2.01% | 0.54% | 0.05% | |
| Biodemographic data | ||||||
| Age, years | 52.0 (12.7) | 69.25 (11.2) | 77.0 (9.5) | 81.0 (8.8) | 82.6 (9.0) | 72.4 (20.1) |
| Gender (female), n (%) | 11614 (47.0) | 12307 (50.2) | 1634 (46.8) | 801 (56.6) | 265 (69.7) | 21 (61.8) |
| BMI, kg/m2 | 26.5 (7.2) | 27.68 (6.5) | 28.2 (6.2) | 28.2 (6.21) | 28.2 (6.5) | 24.6 (7.4) |
| Systolic BP, mmHg | 123.22 (24.0) | 129.8 (22.8) | 132.1 (21.6) | 130.9 (21.7) | 129.6 (20.9) | 129.7 (9.0) |
| Diastolic BP, mmHg | 76.51 (12.5) | 75.98 (11.3) | 74.2 (10.3) | 71.2 (10.0) | 69.7 (9.6) | 74.9 (5.2) |
| Comorbidities | ||||||
| CVD, n (%) | 1916 (7.7) | 4773 (19.5) | 1182 (33.9) | 612 (43.3) | 205 (53.9) | 13 (38.2) |
| Coronary ischemic disease, n (%) | 743 (3.0) | 1698 (6.9) | 409 (11.7) | 193 (13.6) | 77 (20.3) | 3 (8.8) |
| Heart failure, n (%) | 274 (1.1) | 1105 (4.5) | 374 (10.7) | 269 (19.0) | 104 (27.4) | 8 (23.5) |
| Stroke, n (%) | 301 (1.2) | 738 (3.0) | 171 (4.9) | 90 (6.4) | 28 (7.4) | 3 (8.8) |
| Atrial fibrillation, n (%) | 349 (1.4) | 1596 (6.5) | 446 (12.8) | 249 (17.6) | 93 (24.5) | 6 (17.6) |
| Peripheral artery disease, n (%) | 565 (2.3) | 968 (3.9) | 241 (6.9) | 119 (8.4) | 20 (5.3) | 0 (0.0) |
| Diabetes, n (%) | 4897 (19.8) | 7407 (30.2) | 1391 (39.8) | 612 (43.3) | 182 (47.9) | 13 (38.2) |
| Type 1 diabetes, n (%) | 182 (0.7) | 88 (0.4) | 13 (0.4) | 11 (0.8) | 4 (1.1) | 0 (0.0) |
| Type 2 diabetes, n (%) | 4715 (19.1) | 7319 (29.8) | 1378 (39.5) | 601 (42.5) | 178 (46.8) | 13 (38.2) |
| No CVD nor diabetes, n (%) | 18830 (76.2) | 14680 (59.8) | 1536 (44.0) | 509 (36.0) | 101 (26.6) | 15 (44.1) |
| CV drugs | ||||||
| RAASi, n (%) | 10455 (42.3) | 14933 (60.9) | 2668 (76.4) | 1045 (73.9) | 250 (65.8) | 16 (47.1) |
| ACEi, n (%) | 6268 (25.4) | 7844 (32.0) | 1234 (35.3) | 444 (31.4) | 95 (25.0) | 4 (11.8) |
| At maximal doses, n (%) | 2736 (43.7) | 3366 (42.9) | 555 (45.0) | 200 (45.0) | 44 (46.3) | 4 (100.0) |
| ARBs, n (%) | 4206 (17.0) | 7117 (29.0) | 1444 (41.4) | 610 (43.1) | 155 (40.8) | 12 (35.3) |
| At maximal doses, n (%) | 1744 (41.5) | 2884 (40.5) | 607 (42.0) | 256 (42.0) | 73 (47.1) | 6 (50.0) |
| MRAs, n (%) | 90 (0.4) | 265 (1.1) | 87 (2.5) | 61 (4.3) | 27 (7.1) | 1 (2.9) |
| ARNI, n (%) | 4 (0.0) | 10 (0.0) | 5 (0.1) | 1 (0.1) | 1 (0.3) | 0 (0.0) |
| SGLT2i (non-T2DM), n (%) | 19 (0.1) | 48 (0.2) | 5 (0.1) | 2 (0.1) | 0 (0.0) | 1 (2.9) |
| Beta blockers, n (%) | 1702 (6.9) | 3738 (15.2) | 828 (23.7) | 418 (29.6) | 128 (33.7) | 4 (11.8) |
| Diuretics, n (%) | 3233 (13.1) | 8242 (33.6) | 1417 (40.6) | 587 (41.5) | 163 (42.9) | 6 (17.6) |
| Calcium channel blockers, n (%) | 1151 (4.7) | 2442 (10.0) | 524 (15.0) | 247 (17.5) | 82 (21.6) | 5 (14.7) |
| Low dose aspirin, n (%) | 1660 (6.7) | 4089 (16.7) | 889 (25.5) | 426 (30.1) | 134 (35.3) | 8 (23.5) |
| Statins, n (%) | 8741 (35.4) | 11784 (48.0) | 1861 (53.3) | 781 (55.2) | 214 (56.3) | 8 (23.5) |
| Diabetes medication, n (%) | 4891 (19.8) | 7385 (30.1) | 1388 (39.8) | 608 (43.0) | 182 (47.9) | 13 (38.2) |
| Metformin, n (%) | 3819 (15.4) | 3864 (15.7) | 723 (20.7) | 223 (15.8) | 14 (3.7) | 1 (2.9) |
| SU, n (%) | 50 7 (2.1) | 1074 (4.4) | 226 (6.5) | 63 (4.5) | 11 (2.9) | 2 (5.9) |
| DPP4i, n (%) | 257 (1.0) | 1111 (4.5) | 335 (9.6) | 243 (17.2) | 104 (27.4) | 6 (17.6) |
| Metiglinides, n (%) | 0 (0.0) | 0 (0.0) | 0 (0.0) | 0 (0.0) | 2 (0.5) | 0 (0.0) |
| GLP-1 RA, n (%) | 140 (0.6) | 295 (1.2) | 50 (1.4) | 18 (1.3) | 14 (3.7) | 4 (11.8) |
| Insulin, n (%) | 1001 (4.0) | 2432 (9.9) | 357 (10.2) | 207 (14.6) | 87 (22.9) | 6 (17.6) |
| SGLT2i (T2DM), n (%) | 229 (0.9) | 643 (2.6) | 76 (2.2) | 12 (0.8) | 4 (1.1) | 0 (0.0) |
| Biochemical parameters | ||||||
| UACR, mg/g | 8.8 (6.0) | 10.5 (6.7) | 12.6 (7.2) | 14.6 (7.4) | 15.0 (7.2) | 10.7 (6.6) |
| eGFR, ml/min/1.73m2 | 99.2 (4.3) | 79.2 (7.9) | 53.0 (4.3) | 37.9 (4.2) | 23.3 (4.2) | 6.6 (4.5) |
| HbA1c, % | 6.3 (1.2) | 6.5 (1.0) | 6.6 (1.1) | 6.7 (1.1) | 6.8 (1.1) | 6.1 (0.9) |
| Creatinine, mg/dL | 0.7 (0.1) | 1.0 (0.2) | 1.5 (0.1) | 1.9 (0.2) | 2.9 (0.5) | 6.2 (1.2) |
| Uric acid, mg/dL | 5.5 (1.0) | 6.0 (1.1) | 6.8 (1.1) | 7.3 (1.2) | 7.7 (1.4) | 6.7 (1.4) |
| Potassium, mmol/L | 4.9 (0.7) | 5.0 (0.7) | 5.1 (1.1) | 5.2 (0.7) | 5.3 (0.7) | 5.3 (0.7) |
| Hemoglobin, g/dL | 14.6 (1.4) | 14.4 (1.4) | 13.9 (1.6) | 13.1 (1.7) | 11.8 (1.5) | 12.3 (1.6) |
| G1 A2 | G2 A2 | G3a A2 | G3b A2 | G4 A2 | G5 A2 (no dialysis) | |
|---|---|---|---|---|---|---|
| 5.10% | 9.13% | 2.67% | 1.85% | 0.71% | 0.05% | |
| Biodemographic data | ||||||
| Age, years | 56.6 (11.3) | 72.9 (10.8) | 77.8 (10.1) | 81.4 (9.2) | 82.3 (10.1) | 78.9 (16.1) |
| Gender (female), n (%) | 1654 (46.1) | 3346 (52.1) | 900 (47.9) | 691 (53.1) | 304 (61.2) | 22 (57.9) |
| BMI, kg/m2 | 29.8 (6.6) | 28.9 (6.0) | 28.9 (6.1) | 28.4 (6.2) | 28.0 (6.9) | 26.4 (7.2) |
| Systolic BP, mmHg | 130.0 (22.1) | 133.2 (22.1) | 133.8 (21.6) | 134.4 (21.7) | 133.4 (20.7) | 126.6 (17.6) |
| Diastolic BP, mmHg | 79.0 (11.2) | 75.3 (10.6) | 73.5 (10.1) | 71.9 (9.9) | 70.5 (9.4) | 68.5 (9.3) |
| Comorbidities | ||||||
| CVD, n (%) | 498 (13.9) | 1942 (30.2) | 815 (43.4) | 653 (50.2) | 277 (55.7) | 22 (57.9) |
| Coronary ischemic disease, n (%) | 158 (4.4) | 614 (9.6) | 256 (13.6) | 218 (16.7) | 85 (17.1) | 7 (18.4) |
| Heart failure, n (%) | 111 (3.1) | 603 (9.4) | 302 (16.1) | 282 (21.7) | 156 (31.4) | 8 (21.1) |
| Stroke, n (%) | 84 (2.3) | 306 (4.8) | 106 (5.6) | 98 (7.5) | 30 (6.0) | 3 (7.9) |
| Atrial fibrillation, n (%) | 131 (3.6) | 751 (11.7) | 365 (19.4) | 269 (20.7) | 127 (25.6) | 10 (26.3) |
| Peripheral artery disease, n (%) | 133 (3.7) | 435 (6.8) | 196 (10.4) | 132 (10.1) | 56 (11.3) | 3 (7.9) |
| Diabetes, n (%) | 1617 (45.0) | 3152 (49.1) | 986 (52.5) | 680 (52.2) | 268 (53.9) | 12 (31.6) |
| Type 1 diabetes, n (%) | 37 (1.0) | 53 (0.8) | 14 (0.7) | 15 (1.2) | 7 (1.4) | 0 (0.0) |
| Type 2 diabetes, n (%) | 1580 (44.0) | 3099 (48.2) | 972 (51.8) | 665 (51.1) | 261 (52.5) | 12 (31.6) |
| No CVD nor diabetes, n (%) | 1852 (51.6) | 2617 (40.7) | 606 (32.3) | 366 (28.1) | 129 (26.0) | 15 (39.5) |
| CV drugs | ||||||
| RAASi, n (%) | 2345 (65.3) | 4584 (71.4) | 1494 (79.6) | 949 (72.9) | 329 (66.2) | 24 (63.2) |
| ACEi, n (%) | 1324 (36.9) | 2226 (34.7) | 609 (32.4) | 377 (29.0) | 110 (22.1) | 7 (18.4) |
| At maximal doses, n (%) | 1087 (82.1) | 1812 (81.4) | 497 (81.6) | 302 (80.1) | 86 (78.2) | 4 (57.1) |
| ARBs, n (%) | 1030 (28.7) | 2373 (36.9) | 891 (47.4) | 575 (44.2) | 220 (44.3) | 17 (44.7) |
| At maximal doses, n (%) | 851 (82.6) | 1952 (82.3) | 731 (82.0) | 475 (82.6) | 178 (80.9) | 16 (94.1) |
| MRAs, n (%) | 30 (0.8) | 129 (2.0) | 72 (3.8) | 51 (3.9) | 18 (3.6) | 2 (5.3) |
| ARNI, n (%) | 1 (0.0) | 12 (0.2) | 6 (0.3) | 3 (0.2) | 0 (0.0) | 0 (0.0) |
| SGLT2i (non-T2DM), n (%) | 12 (0.3) | 22 (0.3) | 7 (0.4) | 3 (0.2) | 3 (0.6) | 0 (0.0) |
| Beta blockers, n (%) | 399 (11.1) | 1367 (21.3) | 546 (29.1) | 408 (31.3) | 167 (33.6) | 9 (23.7) |
| Diuretics, n (%) | 698 (19.4) | 2228 (34.7) | 789 (42.0) | 570 (43.8) | 236 (47.5) | 15 (39.5) |
| Calcium channel blockers, n (%) | 380 (10.6) | 1126 (17.5) | 390 (20.8) | 343 (26.3) | 147 (29.6) | 10 (26.3) |
| Low dose aspirin, n (%) | 489 (13.6) | 1504 (23.4) | 555 (29.6) | 418 (32.1) | 157 (31.6) | 6 (15.8) |
| Statins, n (%) | 1698 (47.3) | 3425 (53.3) | 1065 (56.7) | 706 (54.2) | 276 (55.5) | 13 (34.2) |
| Diabetes medication, n (%) | 1607 (44.8) | 3138 (48.9) | 982 (52.3) | 676 (51.9) | 268 (53.9) | 12 (31.6) |
| Metformin, n (%) | 882 (24.6) | 1690 (26.3) | 506 (26.9) | 264 (20.3) | 11 (2.2) | 0 (0.0) |
| SU, n (%) | 247 (6.9) | 554 (8.6) | 133 (7.1) | 68 (5.2) | 14 (2.8) | 0 (0.0) |
| DPP4i, n (%) | 135 (3.8) | 380 (5.9) | 200 (10.6) | 251 (19.3) | 162 (32.6) | 9 (23.7) |
| Metiglinides, n (%) | 3 (0.1) | 0 (0.0) | 0 (0.0) | 0 (0.0) | 3 (0.6) | 0 (0.0) |
| GLP-1 RA, n (%) | 106 (3.0) | 97 (1.5) | 26 (1.4) | 10 (0.8) | 16 (3.2) | 0 (0.0) |
| Insulin, n (%) | 543 (15.1) | 1107 (17.2) | 352 (18.7) | 265 (20.4) | 142 (28.6) | 5 (13.2) |
| SGLT2i (T2DM), n (%) | 162 (4.5) | 213 (3.3) | 44 (2.3) | 13 (1.0 | 13 (2.6) | 1 2.6 |
| Biochemical parameters | ||||||
| UACR, mg/g | 77.0 (56.1) | 80.7 (58.0) | 89.0 (63.3) | 97.1 (65.8) | 105.4 (70.1) | 113.1 (75.1) |
| eGFR, ml/min/1.73m2 | 98.6 (4.3) | 78.0 (8.1) | 52.7 (4.3) | 37.9 (4.2) | 23.1 (4.5) | 7.4 (4.9) |
| HbA1c, % | 7.0 (1.4) | 6.9 (1.2) | 6.9 (1.2) | 6.9 (1.1) | 7.0 (1.3) | 6.6 (1.3) |
| Creatinine, mg/dL | 0.7 (0.1) | 1.0 (0.2) | 1.5 (0.1) | 1.9 (0.2) | 2.9 (0.5) | 6.0 (1.2) |
| Uric acid, mg/dL | 5.8 (1.8) | 6.1 (1.0) | 7.0 (2.8) | 7.3 (1.2) | 7.6 (1.3) | 7.4 (1.2) |
| Potassium, mmol/L | 4.9 (0.7) | 5 (0.7) | 5.2 (0.7) | 5.2 (0.7) | 5.3 (0.8) | 5.1 (0.7) |
| Hemoglobin, g/dL | 14.6 (1.5) | 14.1 (1.6) | 13.5 (2.0) | 13.1 (2.1) | 11.7 (1.4) | 11.6 (1.6) |
| G1 A3 | G2 A3 | G3a A3 | G3b A3 | G4 A3 | G5 A3 (no dialysis) | |
|---|---|---|---|---|---|---|
| 0.50% | 1.05% | 0.51% | 0.49% | 0.35% | 0.06% | |
| Biodemographic data | ||||||
| Age, years | 55.7 (11.2) | 69.6 (12.6) | 73.8 (10.5) | 77.1 (10.7) | 76.6 (12.5) | 75.9 (13.8) |
| Gender (female), n (%) | 133 (38.1) | 287 (38.9) | 126 (34.9) | 148 (43.0) | 112 (45.5) | 16 (37.2) |
| BMI, kg/m2 | 30.8 (6.7) | 29.8 (6.2) | 29.8 (6.3) | 30.3 (6.1) | 28.9 (6.4) | 26.3 (6.8) |
| Systolic BP, mmHg | 132.2 (21.4) | 136.4 (22.9) | 135.8 (21.9) | 138.3 (22.7) | 133.7 (24.3) | 138.1 (19.4) |
| Diastolic BP, mmHg | 79.0 (10.8) | 76.5 (11.0) | 73.2 (10.1) | 71.9 (10.1) | 71.8 (11.2) | 74.3 (9.6) |
| Comorbidities | ||||||
| CVD, n (%) | 64 (18.3) | 275 (37.3) | 182 (50.4) | 178 (51.7) | 136 (55.3) | 26 (60.5) |
| Coronary ischemic disease, n (%) | 22 (6.3) | 89 (12.1) | 70 (19.4) | 57 (16.6) | 42 (17.1) | 8 (18.6) |
| Heart failure, n (%) | 12 (3.4) | 91 (12.3) | 69 (19.1) | 90 (26.2) | 68 (27.6) | 14 (32.6) |
| Stroke, n (%) | 10 (2.9) | 40 (5.4) | 25 (6.9) | 32 (9.3) | 28 (11.4) | 3 (7.0) |
| Atrial fibrillation, n (%) | 13 (3.7) | 102 (13.8) | 68 (18.8) | 70 (20.3) | 58 (23.6) | 4 (9.3) |
| Peripheral artery disease, n (%) | 22 (6.3) | 75 (10.2) | 46 (12.7) | 45 (13.1) | 25 (10.2) | 7 (16.3) |
| Diabetes, n (%) | 199 (57.0) | 485 (65.8) | 224 (62.0) | 239 (69.5) | 141 (57.3) | 24 (55.8) |
| Type 1 diabetes, n (%) | 12 (3.4) | 8 (1.1) | 4 (1.1) | 5 (1.5) | 6 (2.4) | 0 (0.0) |
| Type 2 diabetes, n (%) | 187 (53.6) | 477 (64.7) | 220 (60.9) | 234 (68.0) | 135 (54.9) | 24 (55.8) |
| No CVD nor diabetes, n (%) | 143 (41.0) | 211 (28.6) | 89 (24.7) | 73 (21.2) | 64 (26.0) | 11 (25.6) |
| CV drugs | ||||||
| RAASi, n (%) | 280 (80.2) | 626 (84.9) | 310 (85.9) | 290 (84.3) | 167 (67.9) | 22 (51.2) |
| ACEi, n (%) | 163 (46.7) | 253 (34.3) | 124 (34.3) | 99 (28.8) | 46 (18.7) | 4 (9.3) |
| At maximal doses, n (%) | 127 (77.9) | 207 (81.8) | 93 (75.0) | 82 (82.8) | 40 (87.0) | 3 (75.0) |
| ARBs, n (%) | 118 (33.8) | 378 (51.3) | 187 (51.8) | 193 (56.1) | 121 (49.2) | 18 (41.9) |
| At maximal doses, n (%) | 90 (76.3) | 312 (82.5) | 154 (82.4) | 156 (80.8) | 100 (82.6) | 14 (77.8) |
| MRAs, n (%) | 4 (1.1) | 32 (4.3) | 23 (6.4) | 18 (5.2) | 13 (5.3) | 1 (2.3) |
| ARNI, n (%) | 0 (0.0) | 1 (0.1) | 0 (0.0) | 0 (0.0) | 1 (0.4) | 0 (0.0) |
| SGLT2i (non-T2DM), n (%) | 2 (0.6) | 2 (0.3) | 4 (1.1) | 0 (0.0) | 0 (0.0) | 0 (0.0) |
| Beta blockers, n (%) | 52 (14.9) | 168 (22.8) | 126 (34.9) | 107 (31.1) | 76 (30.9) | 11 (25.6) |
| Diuretics, n (%) | 76 (21.8) | 285 (38.7) | 154 (42.7) | 182 (52.9) | 130 (52.8) | 17 (39.5) |
| Calcium channel blockers, n (%) | 56 (16.0) | 190 (25.8) | 106 (29.4) | 131 (38.1) | 90 (36.6) | 17 (39.5) |
| Low dose aspirin, n (%) | 62 (17.8) | 220 (29.9) | 125 (34.6) | 130 (37.8) | 93 (37.8) | 13 (30.2) |
| Statins, n (%) | 179 (51.3) | 405 (55.0) | 194 (53.7) | 207 (60.2) | 136 (55.3) | 14 (32.6) |
| Diabetes medication, n (%) | 198 (56.7) | 484 (65.7) | 223 (61.8) | 238 (69.2) | 141 (57.3) | 24 (55.8) |
| Metformin, n (%) | 77 (22.1) | 240 (32.6) | 94 (26.0) | 87 (25.3) | 3 (1.2) | 0 (0.0) |
| SU, n (%) | 21 (6.0) | 76 (10.3) | 27 (7.5) | 16 (4.7) | 7 (2.8) | 1 (2.3) |
| DPP4i, n (%) | 18 (5.2) | 53 (7.2) | 57 (15.8) | 89 (25.9) | 84 (34.1) | 7 (16.3) |
| Metiglinides, n (%) | 0 (0.0) | 0 (0.0) | 0 (0.0) | 0 (0.0) | 0 (0.0) | 0 (0.0) |
| GLP-1 RA, n (%) | 15 (4.3) | 24 (3.3) | 9 (2.5) | 5 (1.5) | 3 (1.2) | 1 (2.3) |
| Insulin, n (%) | 114 (32.7) | 231 (31.3) | 112 (31.0 | 98 (28.5) | 82 (33.3) | 1 (44.2) |
| SGLT2i (T2DM), n (%) | 24 (6.9) | 33 (4.5) | 15 (4.2 | 6 (1.7) | 1 (0.4) | 0 (0.0 |
| Biochemical parameters | ||||||
| UACR, mg/g | 797.2 (325.0) | 847.3 (372.6) | 885.5 (344.5) | 1040.3 (472.7) | 1278.9 (589.4) | 1571.0 (607.4) |
| eGFR, ml/min/1.73m2 | 98.8 (4.4) | 77.3 (8.2) | 52.3 (4.3) | 37.6 (4.2) | 22.7 (4.2) | 6.8 (5.3) |
| HbA1c, % | 7.7 (1.7) | 7.4 (1.4) | 7.4 (1.4) | 7.3 (1.2) | 7.1 (1.4) | 7.2 (1.6) |
| Creatinine, mg/dL | 0.7 (0.1) | 1.0 (0.2) | 1.4 (0.1) | 1.9 (0.2) | 2.9 (0.5) | 6.1 (1.3) |
| Uric acid, mg/dL | 6.1 (1.0) | 6.5 (1.1) | 7.2 (1.2) | 7.2 (1.1) | 7.6 (1.3) | 7.6 (1.0) |
| Potassium, mmol/L | 5.0 (0.7) | 5.0 (0.7) | 5.2 (0.8) | 5.3 (0.8) | 5.4 (0.8) | 5.2 (0.7) |
| Hemoglobin, g/dL | 14.5 (1.7) | 14.1 (1.8) | 13.5 (1.8) | 12.8 (1.7) | 11.7 (1.4) | 11.7 (1.3) |
ACEi: angiotensin-converting enzyme inhibitors; ARB: angiotensin II receptor blockers; ARNI: angiotensin receptor-neprilysin inhibitor; BP: blood pressure; BMI: body mass index; CAT: category; CKD: chronic kidney disease; CVD: cardiovascular disease; DPP4i: dipeptidyl peptidase-4 inhibitors; eGFR: estimated glomerular filtration rate; GLP-1 RA: glucagon-like peptide-1 receptor agonists; HbA1c: glycated hemoglobin; KDIGO: Kidney Disease: Improving Global Outcomes; MRAs: mineralocorticoid receptor antagonists; RAASi: renin–angiotensin–aldosterone system inhibitors; SGLT2 i: sodium-glucose cotransporter-2 inhibitors; SU: sulfonylureas; T2DM: type 2 diabetes mellitus; UACR: urine albumin–creatinine ratio.
Regarding cardiovascular treatments, RASi were prescribed in 47.1–76.4%, 63.2–79.6%, and 51.2–85.9% of patients in G3a–5 A1, G1–5 A2, and G1–5 A3 KDIGO categories, respectively; and statins were used in 23.5–56.3%, 34.2–56.7% and 32.6–60.2%, respectively. The use of RASi was increased among those patients with moderate renal dysfunction, and it was decreased in advanced stages of CKD. In addition, the use of RASi increased with albuminuria levels. Treatment with statins raised as renal function worsened. The prescription of SGLT2i was marginal across KDIGO categories. The use of SGLT2i increased with albuminuria levels (Table 1 and supplementary Fig. 3). These findings remained in the sensitivity analysis (supplementary Table 1).
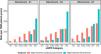
Incidence rates for combined MACE variable during 2 years of follow-up ranged from 102.9 to 245.2 per 1000 p-y in the G3a–5 A1 category, 40.7 to 261.1 per 1000 p-y in G1–5 A2, and 69.1 to 362.3 per 1000 p-y in G1–5 A3. Incidence rates for combined MARE variable during 2 years of follow-up ranged from 14.9 to 454.4 per 1000 p-y, 29.8 to 588.5 per 1000 p-y, and 11.8 to 637.2 per 1000 p-y, respectively (Table 2). Both individual MACEs and MAREs incidence rates increased as renal function worsened and albuminuria levels rose. As shown in Fig. 1, in early CKD, the risk of MACE was predominant, and the rate of MARE was more evident in advanced CKD, but also with high risk of MACE. Mortality increased across eGFR stages, with a sharp acceleration in G4 and G5 (supplementary Fig. 4). The presence of albuminuria increased mortality risk notably, with A3 mortality was 1.5–2 times higher than with A1 in each eGFR category, even at early CKD stages.
Incidence rates of complications by KDIGO risk category during 2 years of follow-up, n=70,385 subjects (model 1**).
| G1 A1 | G2 A1 | G3a A1 | G3b A1 | G4 A1 | G5 A1 (no dialysis) | |||||||
|---|---|---|---|---|---|---|---|---|---|---|---|---|
| 35.13% | 34.86% | 4.96% | 2.01% | 0.54% | 0.05% | |||||||
| N | Rates* | N | Rates* | N | Rates* | N | Rates* | N | Rates* | N | Rates* | |
| Mortality | ||||||||||||
| All-cause death | 174 | 3.53 | 773 | 16.02 | 265 | 39.43 | 179 | 67.70 | 81 | 119.46 | 9 | 150.19 |
| CV outcomes | ||||||||||||
| Myocardial infarction | 317 | 6.48 | 477 | 9.97 | 107 | 16.15 | 60 | 23.06 | 18 | 27.21 | 2 | 34.17 |
| Stroke | 236 | 4.81 | 527 | 11.04 | 103 | 15.55 | 61 | 23.49 | 21 | 31.69 | 2 | 34.42 |
| Heart failure | 258 | 5.27 | 1077 | 22.80 | 334 | 52.12 | 241 | 98.15 | 86 | 139.45 | 8 | 145.12 |
| PAD | 375 | 7.67 | 698 | 14.66 | 170 | 25.90 | 72 | 27.95 | 20 | 30.15 | 3 | 52.87 |
| MACE | 1101 | 22.88 | 2502 | 54.68 | 627 | 102.90 | 378 | 163.64 | 121 | 210.47 | 12 | 245.20 |
| Renal outcomes | ||||||||||||
| Hospitalization for CKD | 4 | 0.08 | 16 | 0.33 | 29 | 4.34 | 57 | 21.96 | 51 | 81.18 | 8 | 161.68 |
| Reduction of eGFR ≥50% | 12 | 0.24 | 54 | 1.12 | 25 | 3.73 | 27 | 10.29 | 35 | 54.07 | 10 | 191.50 |
| Dialysis | 0 | 0.00 | 1 | 0.02 | 0 | 0.00 | 0 | 0.00 | 3 | 4.45 | 2 | 34.22 |
| Kidney transplantation | 1 | 0.02 | 0 | 0.00 | 0 | 0.00 | 0 | 0.00 | 1 | 1.47 | 1 | 17.11 |
| Progression from A1/A2 to A3 | 218 | 4.44 | 274 | 5.71 | 50 | 7.49 | 21 | 8.01 | 13 | 19.60 | 1 | 17.04 |
| MARE | 235 | 4.79 | 336 | 7.01 | 99 | 14.95 | 100 | 39.10 | 91 | 155.54 | 18 | 454.36 |
| G1 A2 | G2 A2 | G3a A2 | G3b A2 | G4 A2 | G5 A2 (no dialysis) | |||||||
|---|---|---|---|---|---|---|---|---|---|---|---|---|
| 5.10% | 9.13% | 2.67% | 1.85% | 0.71% | 0.05% | |||||||
| N | Rates* | N | Rates* | N | Rates* | N | Rates* | N | Rates* | N | Rates* | |
| Mortality | ||||||||||||
| All-cause death | 56 | 7.87 | 434 | 34.99 | 200 | 56.35 | 219 | 91.48 | 135 | 160.02 | 11 | 171.17 |
| CV outcomes | ||||||||||||
| Myocardial infarction | 60 | 8.50 | 180 | 14.73 | 80 | 23.06 | 59 | 25.14 | 32 | 39.24 | 3 | 49.96 |
| Stroke | 59 | 8.36 | 237 | 19.46 | 88 | 25.31 | 74 | 31.73 | 27 | 33.03 | 3 | 47.14 |
| Heart failure | 97 | 13.83 | 585 | 49.17 | 289 | 87.87 | 246 | 111.85 | 114 | 148.67 | 9 | 159.14 |
| PAD | 90 | 12.79 | 338 | 28.03 | 130 | 37.86 | 81 | 34.77 | 30 | 36.17 | 4 | 67.72 |
| MACE | 278 | 40.72 | 1162 | 103.43 | 503 | 164.24 | 399 | 195.32 | 175 | 252.00 | 13 | 261.06 |
| Renal outcomes | ||||||||||||
| Hospitalization for CKD | 2 | 0.28 | 21 | 1.70 | 47 | 13.40 | 88 | 38.20 | 81 | 104.29 | 8 | 130.87 |
| Reduction of eGFR ≥50% | 5 | 0.70 | 46 | 3.72 | 14 | 3.96 | 15 | 6.31 | 62 | 78.80 | 16 | 317.70 |
| Dialysis | 0 | 0.00 | 1 | 0.08 | 1 | 0.28 | 2 | 0.84 | 5 | 5.97 | 2 | 32.26 |
| Kidney transplantation | 0 | 0.00 | 0 | 0.00 | 0 | 0.00 | 0 | 0.00 | 5 | 5.97 | 1 | 15.96 |
| Progression from A1/A2 to A3 | 201 | 29.02 | 369 | 30.66 | 110 | 31.89 | 98 | 42.45 | 77 | 99.50 | 11 | 205.80 |
| MARE | 206 | 29.78 | 400 | 33.35 | 153 | 44.98 | 182 | 82.23 | 169 | 252.11 | 24 | 588.47 |
| G1 A3 | G2 A3 | G3a A3 | G3b A3 | G4 A3 | G5 A3 (no dialysis) | |||||||
|---|---|---|---|---|---|---|---|---|---|---|---|---|
| 0.50% | 1.05% | 0.51% | 0.49% | 0.35% | 0.06% | |||||||
| N | Rates* | N | Rates* | N | Rates* | N | Rates* | N | Rates* | N | Rates* | |
| Mortality | ||||||||||||
| All-cause death | 13 | 18.98 | 63 | 44.71 | 48 | 70.67 | 64 | 103.21 | 68 | 165.17 | 14 | 200.79 |
| CV outcomes | ||||||||||||
| Myocardial infarction | 10 | 14.80 | 32 | 23.20 | 18 | 27.08 | 22 | 36.59 | 18 | 44.97 | 4 | 59.83 |
| Stroke | 11 | 16.32 | 39 | 28.36 | 19 | 28.74 | 25 | 42.08 | 17 | 42.41 | 4 | 60.24 |
| Heart failure | 15 | 22.40 | 75 | 55.99 | 56 | 88.19 | 75 | 133.21 | 59 | 156.03 | 11 | 175.81 |
| PAD | 14 | 20.93 | 49 | 35.84 | 36 | 55.47 | 39 | 65.73 | 30 | 77.11 | 5 | 78.98 |
| MACE | 44 | 69.07 | 172 | 138.23 | 107 | 184.73 | 135 | 270.90 | 101 | 307.50 | 19 | 362.29 |
| Renal outcomes | ||||||||||||
| Hospitalization for CKD | 2 | 2.93 | 20 | 14.40 | 36 | 55.20 | 51 | 87.34 | 80 | 234.84 | 13 | 242.65 |
| Reduction of eGFR ≥50% | 5 | 7.36 | 15 | 10.72 | 11 | 16.40 | 11 | 18.00 | 35 | 91.72 | 19 | 302.94 |
| Dialysis | 1 | 1.46 | 2 | 1.42 | 1 | 1.48 | 6 | 9.74 | 20 | 50.62 | 5 | 76.45 |
| Kidney transplantation | 0 | 0.00 | 0 | 0.00 | 0 | 0.00 | 1 | 1.62 | 7 | 17.27 | 2 | 28.49 |
| Progression from A1/A2 to A3 | 0 | 0.00 | 0 | 0.00 | 0 | 0.00 | 0 | 0.00 | 0 | 0.00 | 0 | 0.00 |
| MARE | 8 | 11.85 | 32 | 23.19 | 45 | 69.97 | 62 | 108.61 | 106 | 352.10 | 28 | 637.20 |
CAT: category; CKD: chronic kidney disease; CV: cardiovascular; eGFR: estimated glomerular filtration rate; KDIGO: Kidney Disease: Improving Global Outcomes; MACE: major adverse cardiovascular events (composed of any of the following outcomes: stroke, myocardial infarction or all-cause death); MARE: major adverse renal events (composed of any of the following renal outcomes: hospitalization for CKD, reduction of eGFR ≥50%; dialysis; kidney transplantation; progression from A1/A2 to A3); PAD: peripheral artery disease.
![MARE and MACE rates across eGFR stages and albuminuria categories (model 1 [adults, with one eGFR laboratory test (index date was the date of the eGFR measure meeting the criteria closest to 01/01/2018) and at least 12 months of continuous presence in the database prior to the qualifying eGFR]). eGFR: estimated glomerular filtration rate; MACE: major adverse cardiovascular events (composed of any of the following outcomes: stroke, myocardial infarction or all-cause death); MARE: major adverse renal events (composed of any of the following renal outcomes: hospitalization for chronic kidney disease, reduction of eGFR ≥50%; dialysis; kidney transplantation; progression from A1/A2 to A3).](https://static.elsevier.es/multimedia/02116995/0000004500000008/v1_202509300436/S0211699525000505/v1_202509300436/en/main.assets/gr1.jpeg?xkr=ue/ImdikoIMrsJoerZ+w92lL8PRnKGMnsiVXV6EVJ5QRkjJZIKj2umwUyY+cL6K8K5wsXqsGbudpf7L6480V9txeKs/6LgP2K0aXtuqOqwK/idjS2tGCZe1YLih7h68uS+NZEdUxKABru9XNoHa/XT/jvD1N27a/7x6RmJ3HSZPAGcrq4XJc92GLIgcrf4bm6s/rOjSz/k9yHVKsJITNx6gxXa9B6iaw4KseykBXF0vVnTv8/jK2jJfPapkozIAU/ax/HiYjRaf4CAryqEYWvw==)
MARE and MACE rates across eGFR stages and albuminuria categories (model 1 [adults, with one eGFR laboratory test (index date was the date of the eGFR measure meeting the criteria closest to 01/01/2018) and at least 12 months of continuous presence in the database prior to the qualifying eGFR]). eGFR: estimated glomerular filtration rate; MACE: major adverse cardiovascular events (composed of any of the following outcomes: stroke, myocardial infarction or all-cause death); MARE: major adverse renal events (composed of any of the following renal outcomes: hospitalization for chronic kidney disease, reduction of eGFR ≥50%; dialysis; kidney transplantation; progression from A1/A2 to A3).
Regarding the type of event, in absolute terms, heart failure had the highest event rates at every stage, with even G5 A1 (145.12 per 1000 p-y) (supplementary Fig. 5), being worse for myocardial infarction (supplementary Fig. 6), stroke (supplementary Fig. 7), and PAD (supplementary Fig. 8). Conversely, stroke had the lowest absolute rates at early CKD stages (4.81 per 1000 p-y in G1 A1) but raised steeply to 60.24 per 1000 p-y in G5 A3, surpassing myocardial infarction and PAD in later CKD stages. Furthermore, heart failure stood out as the event that increased more, with rates increasing 33-fold from G1 A1 (5.27 per 1000 p-y) to G5A3 (175.81 per 1000 p-y). These numbers exceeded the relative increases seen in myocardial infarction (9.2-fold increase, from 6.48 per 1000 p-y to 59.83 per 1000 p-y), stroke (12.5-fold increase, from 4.81 per 1000 p-y to 60.24 per 1000 p-y), and PAD (10.3-fold increase, from 7.67 per 1000 p-y to 78.98 per 1000 p-y).
Regarding the risk of MARE, it increased sharply with declining eGFR and the increase in albuminuria. Reduction of eGFR ≥50% from baseline had the highest rates at G5, but hospitalization for CKD were high across all stages (supplementary Fig. 9) surpassing the peak rates observed for eGFR decline ≥50% in G1–G4 (supplementary Fig. 10), dialysis initiation (supplementary Fig. 11), and kidney transplantation (supplementary Fig. 12). Notably, hospitalization for CKD increased 868-fold from G1 A1 (0.28 per 1000 p-y) to G5 A3 (242.65 per 1000 p-y). These trends remained in the sensitivity analysis (supplementary Table 2).
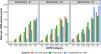
In early CKD stages (G1–G3a), all-cause mortality rates were comparable to or higher than heart failure and hospitalization for CKD. It should be emphasized the significant cardiovascular risk in patients with mild to moderate kidney dysfunction. As CKD advanced from G3b to G5, mortality continued to rise but at more moderate pace compared to the sharp acceleration of hospitalization rates, which surpassed both mortality and heart failure in the most advanced CKD stages, particularly in those with high albuminuria (A3) (Fig. 2).
![All-cause deaths, heart failure and hospitalization for CKD rates across eGFR stages and albuminuria categories (model 1 [adults, with one eGFR laboratory test (index date was the date of the eGFR measure meeting the criteria closest to 01/01/2018) and at least 12 months of continuous presence in the database prior to the qualifying eGFR]). CKD: chronic kidney disease; eGFR: estimated glomerular filtration rate.](https://static.elsevier.es/multimedia/02116995/0000004500000008/v1_202509300436/S0211699525000505/v1_202509300436/en/main.assets/gr2.jpeg?xkr=ue/ImdikoIMrsJoerZ+w92lL8PRnKGMnsiVXV6EVJ5QRkjJZIKj2umwUyY+cL6K8K5wsXqsGbudpf7L6480V9txeKs/6LgP2K0aXtuqOqwK/idjS2tGCZe1YLih7h68uS+NZEdUxKABru9XNoHa/XT/jvD1N27a/7x6RmJ3HSZPAGcrq4XJc92GLIgcrf4bm6s/rOjSz/k9yHVKsJITNx6gxXa9B6iaw4KseykBXF0vVnTv8/jK2jJfPapkozIAU/ax/HiYjRaf4CAryqEYWvw==)
All-cause deaths, heart failure and hospitalization for CKD rates across eGFR stages and albuminuria categories (model 1 [adults, with one eGFR laboratory test (index date was the date of the eGFR measure meeting the criteria closest to 01/01/2018) and at least 12 months of continuous presence in the database prior to the qualifying eGFR]). CKD: chronic kidney disease; eGFR: estimated glomerular filtration rate.
This study was performed in a large number of patients with measurements of eGFR and UACR, as assessed by blood and urine tests collected in Healthcare Information Systems. The results showed that patients with CKD had many comorbidities, particularly T2D and cardiovascular diseases. Even though the rates of cardiovascular and renal events were high, the use of drugs to protect cardiovascular and renal system was substantially low. In addition, although the clinical profile showed that the risk of cardiovascular and renal events worsened as renal function declined and albuminuria increased, this information did not translate into a significant improvement in the management of these patients. Furthermore, the information from patients without CKD in the same healthcare area was also collected to have information of the real impact of CKD on the clinical profile, management and cardiovascular and renal outcomes.
Our study included around 21,000 patients with CKD that were analyzed across KDIGO categories. There were relevant differences in the clinical profile according to renal function and albuminuria levels. In DAPA-CKD trial, the mean age was 62 years, 68% T2D and 38% had cardiovascular disease.11 In EMPA-KIDNEY and FIDELITY trials, these numbers were 64 and 65 years, 97% and 100%, and cardiovascular disease was present in 27% and 46%, respectively.12,13 It should be recognized that considering the inclusion and exclusion criteria of RCTs, not all patients with CKD were represented in these studies, indicating the need for studies with RWD. In addition, although some studies have analyzed the clinical profile of patients with CKD in the real-world population,6–8 our study specifically analyzed the clinical profile, management and outcomes across KDIGO categories, including both eGFR and UACR.
In this context, our study showed that age and comorbidities increased as renal function or albuminuria worsened. Furthermore, according to the values obtained in physical examination and laboratory parameters, our study suggested that a substantial proportion of patients did not attain blood pressure, LDL cholesterol and HbA1c targets recommended at the moment of the study.28,29 Although there were some differences in the management according to renal function and albuminuria, the fact is that there is much room for improvement across all KDIGO categories. Importantly, in the last years, guidelines have strengthened the importance of achieving strict risk factors control in patients with CKD due to the high/very high risk of death and cardiovascular events in this population.30-32
Regarding cardiovascular treatments, despite the use of RASi being higher among those patients with moderate renal dysfunction and with albuminuria, overall, many patients with CKD were not on RASi therapy. It should be noted that the continued use of RASi is associated with cardiovascular and renal benefits among patients with CKD, even in individuals with advanced CKD33,34 and the discontinuation of these drugs is associated with an increased risk of subsequent death, cardiovascular complications and renal dysfunction.35-37 These patients, particularly in the case of advanced CKD, may have a higher risk of side effects, such as hyperkalemia. However, the discontinuation of RASi after hyperkalemia is associated with worsened prognosis among patients with CKD.38 In this context, the use of novel potassium binders may facilitate the prescription and maintenance of these drugs, leading to a reduction of cardiovascular and renal complications.39 The use of SGLT2i in our study was marginal, but it should be kept in mind that baseline data were recorded in 2018 and the first approval for indications for dapagliflozin and empagliflozin in CKD were obtained in 2021 and 2023, respectively, based on the DAPA-CKD and EMPA-KIDNEY trials.11,12 Therefore, it would be expected to observe a higher use of SGLT2i in the CKD population in the following years. However, recent studies have shown that these disease-modifying therapies have not yet been successfully implemented into clinical practice, mostly in patients without co-existing T2D.40 Anyway, as the present analysis was based on data from 2018, predating the routine incorporation of SGLT2i into standard nephroprotective therapy, further evaluation using contemporary datasets is warranted to assess their real-world impact on renal Outcomes. Also, more than 40% of patients with CKD were not taking statins. Guidelines recognize that patients with CKD have a high or very high cardiovascular risk and consequently, strict LDL cholesterol goals should be attained in this population. In this context, greater use of lipid lowering therapies, alone or in combination should be encouraged.41,42 Our results confirm previous findings in other countries, adherence to KDIGO CKD guidelines is low globally, with significant variation among countries.20,21 Therefore, our data showed that there are target care gaps in guideline adherence and prescription trends, and that RWD highlights opportunities for improving outcomes.
In addition, it has to be stated that we have analyzed the data through two different models, using one or at least two consecutive eGFR laboratory tests. No differences were observed in trends between both models regarding patient clinical characteristics, or cardiovascular and renal outcomes occurrence across KDIGO categories. This suggests that although CKD has traditionally been defined as abnormalities of kidney structure or function, present at least for 3 months,1 when alterations in eGFR or UACR are found, the early prescription of cardiovascular and renal protective drugs should be encouraged. This is aligned with previous finding showing that single-time point assessments of UACR and eGFR can predict mortality risk, reinforcing the importance of kidney function screening.43 In other words, just an altered value obtained in one determination of eGFR or UACR, if no acute intercurrent condition is occurring, might be sufficient to prompt a thorough evaluation of the patient's condition, consider a diagnosis of CKD and offer an early intervention with cardiovascular and renal protective therapies.
Regarding cardiovascular and renal events after 2 years of follow-up, incidence rates were markedly higher in the CKD population than in those without CKD and increased as renal function worsened and albuminuria levels increased. However, even in patients without CKD according to KDIGO criteria (groups G1A1 and G2A1), any sustained decline in GFR, even within the normal range is associated with an increase in the two-year MACE and MARE, which entails an increased vascular and renal risk. Remarkably, as kidney disease progressed, the nature of the risk changed. In the early stages of renal function impairment, cardiovascular complications were mainly responsible for heart failure and driving mortality. However, as CKD worsened, kidney-related complications became the most relevant threat, with increase in the rate of hospitalizations surging past heart failure and even mortality, especially in those with severe albuminuria. Independently of the stage of kidney function, more albuminuria indicated a greater risk of complications. However, its effects became especially severe in the later stages of CKD, where the risk of hospitalization and death raised sharply. This pattern highlights the critical demand for early intervention to slow disease progression, reduce complications, and give patients a better chance of healthier outcomes.1 However, heart failure was the most frequent cardiovascular event followed by PAD and hospitalization for CKD, the most common renal event. Of note, these complications may occur early in the evolution of patients with CKD. These findings are aligned with previous results.44-46 These data highlight the close relationship between the heart and the kidney, namely the cardio-renal syndrome. As a result, more efforts should be made to accomplish the prompt identification of these conditions and the early initiation of appropriate treatments to delay the development of potential complications.44-46 Previous findings have shown that a rapid decline in eGFR that indicates rapid progression of CKD is significantly associated with MACE, heart failure and myocardial infarction47 and current guidelines are poorly adapted to end-stage kidney disease patients.48 Furthermore, our data reveals relevant care gaps in risk factors management, with missed opportunities in the use of evidence-based therapies. The use of drugs with proven cardiovascular and renal benefits should be encouraged, and efforts to reduce knowledge gaps and overcome system-level barriers should be prioritized, as clearly indicated by the KDIGO 2024 Clinical Practice Guidelines.1 This recommendation should be extended across all stages of CKD, not only from the early stages to prevent the development of complications, but also in the advanced stages of CKD where the beneficial effects on cardiovascular and renal outcomes remain and are key to prevent death.49,50
This study has some limitations. Although the retrospective design is the best to reflect performance of clinical practice, it may introduce some biases. In fact, real-world data enhance generalizability but carries risks of including confounding factors. Certainly, some data could be missing from the electronic health records. Furthermore, the retrospective designs may generate relevant hypothesis, but it cannot establish causality. However, potential biases may be mitigated due to the high number of patients included and the sensitivity analyses that confirmed these results and their consistency with previous publications. Moreover, in contrast with previous publications, our study provided a comprehensive overall description of CKD across all KDIGO categories addressing cardiovascular and renal risks, as well as gaps in the management of this population, and suggesting opportunities for improving care, making the study useful for clinicians.
In conclusion, this RWD study shows that patients with CKD are affected by many comorbidities and are at high risk for developing cardiovascular complications and renal disease progression. However, the use of cardiovascular and renal protective drugs is far from optimal in all the KDIGO categories indicative of CKD, which denotes the strong need to improve the management of these patients across the entire spectrum of the disease.
Conflict of interestsUnai Aranda, Beatriz Palacios, Margarita Capel are AstraZeneca employees; Ignacio Hernández is an Atrys employee. Rafael Santamaría reports lecture fees from AstraZeneca, Boehringer-Ingelheim, Vifor CSL, Bayer; and advisory fees from AstraZeneca and Bayer. None related to this manuscript. Carlos Escobar has received honoraria from Almirall, Esteve, Amgen, Bayer, Boehringer, Sanofi, MSD, Mylan, Servier, Ferrer, Daiichi-Sankyo, Novartis, Pfizer, Viatris, as speaker or advisor. None related to this manuscript. Ana Cebrián declares funding to conduct clinical trials MSD and Sanofi (all to the IMIB institute); consulting fees from AstraZeneca, Bayer, Eli Lilly, MSD, Novo Nordisk and Sanofi; payment of honoraria for lectures from AstraZeneca, Bayer, Boehringer-Ingelheim, Eli Lilly, Menarini, MSD, Sanofi and Novo Nordisk. Roberto Alcázar reports lecture fees from AstraZeneca, Boehringer-Ingelheim, Vifor CSL, Bayer, Rubio and Fresenius Medical Care; and advisory fees from AstraZeneca and Bayer. None related to this manuscript. Manuel Gorostidi reports lecture fees from AstraZeneca, and Servier, and advisory fees from Fresenius Medical Care, Boehringer-Ingelheim, and AstraZeneca (none related to the present article). This study was sponsored and financed by AstraZeneca. The rest of the authors do not have conflicts of interest.
The following are the supplementary data to this article:


