


A rise in the Healthy Eating Index (HEI) 2020 is associated with a reduced risk of chronic kidney disease. However, it remains unclear whether HEI-2020 exhibits a similar positive effect in diabetic patients.
ObjectivesThis work aimed to investigate the relationship between HEI-2020 and the prevalence of diabetic kidney disease (DKD) in type 2 diabetes (T2D) patients.
MethodsA cross-sectional analysis was based on the National Health and Nutrition Survey database from 2007 to 2018. A weighted logistic regression model, restricted cubic splines, and subgroup analysis were undertaken to assess the relationship between HEI-2020 and the prevalence of DKD in T2D patients. A weighted logistic regression model and a weighted quantile sum (WQS) regression model were employed. The independent impact of HEI-2020-related components on the prevalence of DKD among T2D patients was analyzed. In addition, sensitivity analysis was conducted.
ResultsA total of 4255 participants with T2D were enrolled, with a DKD prevalence rate of 34.7%. The logistics regression analysis demonstrated a significant inverse relation between the HEI-2020 score and the prevalence of DKD in fully adjusted models (OR=0.982, 95% CI: 0.973–0.992, P<0.001). No nonlinear relationship was detected (P-non-linear=0.970). No subgroup with significant interaction was identified. The WQS regression indicated that in fully adjusted models, the WQS index for HEI-2020 was significantly negatively correlated with the prevalence of DKD among T2D patients (OR=0.765, 95% CI: 0.621–0.943, P=0.012), with dairy products, total protein foods, and total vegetables as the most influential components. In addition, HEI-2020 was significantly negatively correlated with DKD in previously diagnosed T2D patients (OR=0.979, 95% CI: 0.967–0.990, P<0.001), while no significant association was observed in newly diagnosed patients. The sensitivity analysis yielded similar results, indicating that our results were robust.
ConclusionThis research revealed a relationship between an increase in the HEI-2020 score and a lower prevalence of DKD among T2D patients, emphasizing the importance of the intake of dairy products, total protein foods, and total vegetables. This finding provides new scientific grounds for dietary management in T2D patients.
Un aumento en el Índice de Alimentación Saludable (HEI) 2020 se asocia con una reducción del riesgo de enfermedad renal crónica. Sin embargo, aún no está claro si el HEI-2020 tiene un efecto positivo similar en los pacientes diabéticos.
ObjetivosEl objetivo de este trabajo fue investigar la relación entre el HEI-2020 y la prevalencia de la enfermedad renal diabética (ERD) en pacientes con diabetes tipo 2 (DT2).
MétodosSe realizó un análisis transversal basado en la base de datos de la Encuesta Nacional de Salud y Nutrición (NHANES) de 2007 a 2018. Se emplearon un modelo de regresión logística ponderada, splines cúbicos restringidos y un análisis de subgrupos para evaluar la relación entre el HEI-2020 y la prevalencia de ERD en pacientes con DT2. Se utilizaron un modelo de regresión logística ponderada y un modelo de regresión ponderada de suma de cuantil (WQS). Se analizó el impacto independiente de los componentes relacionados con el HEI-2020 sobre la prevalencia de ERD en los pacientes con DT2. Además, se realizó un análisis de sensibilidad.
ResultadosSe inscribieron un total de 4,255 participantes con DT2, con una tasa de prevalencia de ERD del 34.7%. El análisis de regresión logística demostró una relación inversa significativa entre el puntaje del HEI-2020 y la prevalencia de ERD en los modelos completamente ajustados (OR = 0.982, IC del 95%: 0.973-0.992, P<0.001). No se detectó una relación no lineal (P-no lineal = 0.970). No se identificó ningún subgrupo con interacción significativa. La regresión WQS indicó que, en los modelos completamente ajustados, el índice WQS para el HEI-2020 se correlacionó significativamente de manera negativa con la prevalencia de ERD en los pacientes con DT2 (OR = 0.765, IC del 95%: 0.621-0.943, P =0.012), siendo los productos lácteos, los alimentos con proteínas totales y los vegetales totales los componentes más influyentes. Además, el HEI-2020 se correlacionó significativamente de manera negativa con la ERD en los pacientes con DT2 previamente diagnosticados (OR=0.979, IC del 95%: 0.967-0.990, P<0.001), mientras que no se observó una asociación significativa en los pacientes recién diagnosticados. El análisis de sensibilidad arrojó resultados similares, lo que indica que nuestros resultados son robustos.
ConclusiónEsta investigación reveló una relación entre el aumento en el puntaje del HEI-2020 y una menor prevalencia de ERD entre los pacientes con DT2, destacando la importancia de la ingesta de productos lácteos, alimentos con proteínas totales y vegetales totales. Este hallazgo proporciona una base científica nueva para la gestión dietética en pacientes con DT2.
A total of 589 million patients aged 20–79 are diagnosed with diabetes in the world. Type 2 diabetes (T2D) is the most prevalent form of diabetes globally, accounting for 96.0% of all diabetes cases, and is associated with numerous complications that significantly impact patient quality of life and life expectancy.1,2 Diabetic kidney disease (DKD), a key microvascular complication of T2D, affects roughly 50% of T2D patients who eventually progress to this condition.3 In 2021, the global number of DKD cases related to T2D will reach 107 million, with 477,000 deaths. The age-standardized incidence rate is expected to continue to rise in the future,4 placing an immense burden on global public health. Moreover, DKD is associated with excess mortality in diabetes patients, with the crude all-cause mortality rate in the DKD cohort being nearly twice that of the control group (simple T2D patients) (50.3 vs 28.4 per 1000 person-years).5 DKD remains a primary cause of end-stage renal disease, triggering arterial diseases and cardiovascular complications that complicate treatment for patients.6 Consequently, identifying means to curb the progression of DKD is crucial for reducing the mortality risk among T2D patients.
Nutrition interventions are key to diabetes management, with a balanced diet contributing to improved glucose metabolism and reduced DKD risk in patients with diabetes.7 The United States Dietary Guidelines recommend assessing the quality of American diets using the Healthy Eating Index (HEI), which serves to identify healthy dietary patterns for various populations. The HEI is updated in tandem with the Dietary Guidelines, with the most recent version being HEI-2020.8 It has been widely employed in research on chronic diseases, with the highest quintile array of HEI scores demonstrating significantly lower risk for chronic diseases (including diabetes) compared to the lowest quintile array.9 A systematic review has also shown that better adherence to HEI can lower risks for diabetes and cardiovascular diseases (CVD).10 It is noteworthy that higher HEI adherence can lower the risk of CVD in diabetes patients by 50%.11 Given this, we speculate that enhancing HEI adherence is likely to also lower the risk of DKD in patients with diabetes. Moreover, there is evidence that an increase in HEI-2020 scores is linked with a reduced risk of chronic kidney disease (CKD),12 although the active effect on diabetic patients has not yet been adequately validated.
Thus, this work investigates the relationship between HEI-2020 scores and the prevalence of DKD in T2D patients enrolled in the National Health and Nutrition Examination Survey (NHANES) database, aiming to shed valuable insights into the prevention and dietary guidance for T2D patients with DKD.
MethodsStudy populationThe population data in this project were available through the NHANES database (http://www.cdc.gov/nchs/nhanes.htm), a nationally representative health survey conducted biennially with approval from the National Center for Health Statistics of the US Centers for Disease Control and Prevention. The database is used to evaluate the health and nutrition status of US adults and children.
An analysis of data spanning six cycles from 2007 to 2018 (n=59,842) was conducted. Participants with diabetes were identified by the following criteria: (1) fasting blood glucose concentration ≥126mg/dL, or (2) glycated hemoglobin A1c (HbA1c) level ≥6.5%, or (3) 2-h blood glucose ≥200mg/dL during the 75g oral glucose tolerance test (OGTT), or (4) self-reported diabetes or insulin or oral hypoglycemic drug use.13 Participants without diabetes (n=48,903), missing and useless DKD data (n=2077), and other missing or unavailable covariate data (n=4607) were excluded. Subsequently, we screened and excluded the possible type 1 diabetes patients according to the criteria of diagnosis age <30 years and insulin treatment. In this study, no patients (n=0) met criteria.14 Finally, a total of 4255 T2D participants were included (Fig. 1). Furthermore, according to the diagnosis time of T2D, the study population was divided into a previous diagnosis group (self-reported diabetes or using hypoglycemic drugs) and a new diagnosis group (no previous diagnosis or medication history, but fasting blood glucose concentration ≥126mg/dL or HbA1c ≥6.5% or OGTT 2-h blood glucose ≥200mg/dL).
The measurement of HEI-2020
Food intake data were collected via 24-h dietary recall, including participants with two complete 24-h dietary recalls that reliably met the minimum standards. HEI-2020 is the latest version used to assess dietary quality, with its components identical to those of HEI-2015.8 These components are divided into two forms: nine adequate components (total fruits, total vegetables, whole fruits, vegetables and legumes, dairy products, total protein foods, whole grains, seafood and plant proteins, and fatty acids), and four moderate components (refined grains, added sugars, sodium, and saturated fats). The higher intake of adequate components indicated the higher scores. On the other hand, moderate components were the opposite, with higher intake resulting in lower scores.15 The highest scores for total fruits, whole fruits, total vegetables, vegetables and legumes, total protein foods, and seafood and plant-based proteins are 5. The maximum score for the remaining seven components is 10. The HEI-2020 score ranges from 0 to 100, with higher scores reflecting higher dietary quality.
Definition of diseasesThe kidney diseases were diagnosed based on the Kidney Disease: Improving Global Outcome (KDIGO). DKD was defined as diabetes combined with proteinuria (urinary albumin/creatinine ratio ≥30mg/g) and/or decreased estimated glomerular filtration rate (eGFR) (eGFR <60mL/min/1.73m2).16 The calculation of eGFR was based on the CKD Epidemiology Collaboration equation for standardized creatinine17 (eGFR=141×min (Scr/κ, 1)α×max(Scr/κ, 1)−1.209×0.993Age×1.018 [if female]×1.159 [if black]; Scr: creatinine concentration; κ values: assigned according to gender, 0.9 for males and 0.7 for females; α values: determined by gender, −0.411 for males and −0.329 for females).
CovariatesThe covariates included demographic characteristics, lifestyle factors, medical history, and laboratory indicators (Table S1).
Statistical analysisAll statistical analyses were performed in R (version 4.4.1). Baseline characteristics were summarized using the “tableone” package, which facilitated automated descriptive tables (sample size and percentage (n (%)) represented categorical variables; mean and standard deviation (mean (SD)) represented continuous variables). We employed the “survey” package to set up a weighted logistics regression model to elucidate the association between HEI-2020 scores and the prevalence rate of DKD in T2D patients, with trend analysis conducted. This study used the “rms” (regression modeling strategies) package to construct the restricted cubic spline and set nodes at the 5th, 50th, and 95th percentiles of the HEI-2020 score to evaluate and explore the nonlinear relationship between the HEI-2020 score and the prevalence of DKD in patients with T2D. Subgroup analyses were undertaken to examine these associations in different subpopulations.
Furthermore, a weighted logistic regression model was employed to determine the relation between 13 independent components of HEI-2020 and the prevalence of DKD in T2D patients. A weighted quantile sum (WQS) regression model was built to evaluate the contributions of 13 independent components related to HEI-2020. In the WQS model, all component effects were constrained in the same direction, with their total weights summing up to 1.18 We estimated the individual weights for each component using the quintile arrays (q=5) in HEI-2021. To estimate the parameters, 60% of the data were randomly classified into a training dataset, and the remaining 40% was assigned to a validation dataset. Furthermore, considering the impact of the duration of T2D on DKD, we explored the relationship between HEI-2020 and DKD in the previously diagnosed group and the newly diagnosed group, respectively. Since some drugs, including angiotensin converting enzyme inhibitors (ACEIs), angiotensin II receptor antagonists (ARBs), sodium glucose cotransporter 2 (SGLT2) inhibitors, glucagon-like peptide-1 (GLP-1) receptor agonists, and statins, have been shown to be beneficial for renal outcomes,19 we adjusted for these factors before conducting further sensitivity analysis.
P<0.05 indicated statistical significance.
ResultsBaseline characteristicsA total of 4255 participants with T2D were analyzed, with 1600 diagnosed with DKD, representing a prevalence of 34.7%. The baseline characteristics of the study sample included an average age of 59.22±13.37 years across the entire population, with approximately equal proportions of males and females (Table 1). Compared with patients without DKD, those with DKD exhibited lower HEI-2020 scores (51.13±11.32 vs. 52.33±11.72, P=0.036). Moreover, DKD patients were older, had a history of smoking, hypertension, intense physical activity (PA), a larger waist circumference, higher levels of blood urea nitrogen and uric acid, without drinking habits, and with lower high-density lipoprotein levels (all P-values <0.05).
Characteristics of NHANES type 2 diabetes participants between 2007 and 2018.
| Characters | Total | Non-DKD | DKD | P-value |
|---|---|---|---|---|
| Overall | 4255 | 2655 (65.3) | 1600 (34.7) | |
| Age | 59.22 (13.37) | 56.72 (12.85) | 63.92 (13.07) | <0.001 |
| Race | 0.253 | |||
| Mexican American | 745 (10.0) | 485 (10.2) | 260 (9.7) | |
| Other Hispanic | 470 (6.0) | 314 (6.7) | 156 (4.7) | |
| Non-Hispanic White | 1614 (62.4) | 941 (61.7) | 673 (63.7) | |
| Non-Hispanic Black | 1054 (13.9) | 666 (13.6) | 388 (14.3) | |
| Other race | 372 (7.8) | 249 (7.8) | 123 (7.7) | |
| Gender | 0.741 | |||
| Male | 2185 (50.9) | 1344 (50.6) | 841 (51.6) | |
| Female | 2070 (49.1) | 1311 (49.4) | 759 (48.4) | |
| BMI (kg/m2) | 0.113 | |||
| <25 | 528 (11.3) | 311 (11.4) | 217 (11.0) | |
| 25–30 | 1191 (24.8) | 787 (26.2) | 404 (22.1) | |
| ≥30 | 2536 (63.9) | 1557 (62.4) | 979 (66.9) | |
| Smoking | 0.008 | |||
| Never smoking | 2140 (49.1) | 1376 (50.8) | 764 (45.8) | |
| Former smoking | 1433 (35.1) | 840 (32.2) | 593 (40.5) | |
| Now smoking | 682 (15.8) | 439 (16.9) | 243 (13.7) | |
| Alcohol drinking | 0.008 | |||
| No | 1303 (26.5) | 775 (24.5) | 528 (30.3) | |
| Yes | 2952 (73.5) | 1880 (75.5) | 1072 (69.7) | |
| Hypertension | <0.001 | |||
| No | 871 (21.0) | 679 (25.8) | 192 (11.9) | |
| Yes | 3384 (79.0) | 1976 (74.2) | 1408 (88.1) | |
| Family history of diabetes | 0.974 | |||
| No | 1510 (36.7) | 964 (36.7) | 546 (36.7) | |
| Yes | 2745 (63.3) | 1691 (63.3) | 1054 (63.3) | |
| Physical activity | <0.001 | |||
| None | 902 (22.7) | 624 (24.8) | 278 (18.8) | |
| Moderate | 1448 (36.3) | 957 (38.3) | 491 (32.6) | |
| Intense | 1905 (41.0) | 1074 (36.9) | 831 (48.6) | |
| Waist (cm) | 111.45 (16.31) | 110.72 (16.29) | 112.81 (16.28) | 0.006 |
| HDL (mg/dL) | 47.27 (14.65) | 47.80 (14.68) | 46.26 (14.54) | 0.018 |
| TC (mg/dL) | 186.26 (47.17) | 186.85 (45.35) | 185.13 (50.42) | 0.367 |
| BUN (mg/dL) | 15.89 (7.27) | 14.00 (4.61) | 19.46 (9.65) | <0.001 |
| Uric acid (mg/dL) | 5.72 (1.46) | 5.49 (1.28) | 6.16 (1.67) | <0.001 |
| HEI-2020 | 51.91 (11.60) | 52.33 (11.72) | 51.13 (11.32) | 0.036 |
Note: DKD, diabetic kidney disease; BMI, body mass index; HDL, high-density lipoprotein cholesterol; TC, total cholesterol; BUN, blood urea nitrogen; HEI-2020, Healthy Eating Index-2020.
n (%) represented the categorical variable, and mean (SD) represented the continuous variable. n was unweighted, n (%), mean, and SD were weighted.
To probe into the relationship between the HEI-2020 score and DKD prevalence in T2D patients, a weighted logistic regression model was constructed. Results from the fully adjusted model revealed a significant negative association between HEI-2020 scores and the prevalence of DKD in T2D patients (OR=0.982, 95% CI: 0.973–0.992, P<0.001) (Table 2). In both adjusted models, with each increase in the tertile range, the risk of DKD among T2D patients exhibited a trend towards decreased risk (P for trend <0.001). Additionally, in Model 2, the prevalence of DKD among T2D patients in the third tertile array was significantly lower than that in the first tertile array (OR=0.666, 95% CI: 0.518–0.857, 0.002) (Table 2).
Associations between HEI-2020 and odds ratios (95% confidence intervals) for DKD.
| OR (95% CI), P-value | |||
|---|---|---|---|
| Participants | Crude | Model 1 | Model 2 |
| HEI-2020 (continuous) | 0.991 (.983–0.999), 0.034 | 0.979 (0.970–0.988), <0.001 | 0.982 (0.973–0.992), <0.001 |
| HEI-2020 (categorical) | |||
| T1 (≤46.433) | Ref. | Ref. | Ref. |
| T2 (46.433–56.822) | 0.928 (0.753–1.145), 0.484 | 0.751 (0.597–0.945), 0.015 | 0.767 (0.597–0.985), 0.038 |
| T3 (>56.822) | 0.847 (0.677–1.060), 0.145 | 0.622 (0.488–0.793), <0.001 | 0.666 (0.518–0.857), 0.002 |
| P for trend | 0.145 | <0.001 | 0.001 |
Note: HEI-2020, Healthy Eating Index-2020; OR, odds ratio; CI, confidence interval.
Crude model: without adjustment; Model 1: with adjustments on age, gender, and race; Model 2: with adjustments on age, gender, and race, BMI, smoking, drinking, physical activity, waist circumference, hypertension, family history of diabetes, high-density lipoprotein cholesterol, total cholesterol, blood urea nitrogen, uric acid.
Restricted cubic spline revealed a significant overall trend between HEI-2020 scores and the prevalence of DKD in T2D patients (P-overall <0.001), but no nonlinear relationship was detected (P-non-linear=0.970) (Fig. 2).
Subgroup analysis
The subgroup analysis revealed that HEI-2020 scores were negatively correlated with the prevalence of DKD in patients with T2D for those with body mass index (BMI) between 25 and 30kg/m2 (OR=0.977, 95% CI: 0.960–0.994, P=0.008)or ≥30kg/m2 (OR=0.986, 95% CI: 0.973–0.998, P=0.025), those without smoking habit (OR=0.977, 95% CI: 0.963–0.991, P=0.001), those previously smoked (OR=0.981, 95% CI: 0.963–0.999, P=0.034), individuals with hypertension (OR=0.982, 95% CI: 0.971–0.992, P=0.001), and those with intense physical activity (OR=0.977, 95% CI: 0.962–0.992, P=0.003). Furthermore, no significant interactions were detected among the subgroups (P for interaction >0.05) (Fig. 3).
The relationship between the HEI-2020 components and DKD prevalence in T2D patients
A weighted logistic regression model was constructed to examine the independent effects of 13 dietary components on the HEI-2020. OR values were all less than 1 for all components, with a significant negative correlation detected between DKD prevalence among T2D and components such as total vegetable intake (OR=0.916, 95% CI: 0.841–0.999, P=0.043), diary (OR=0.953, 95% CI: 0.911–0.997, P=0.032), total protein foods (OR=0.884, 95% CI: 0.796–0.981, P=0.018), seafood and plant proteins (OR=0.902, 95% CI: 0.839–0.970, P=0.005), added sugars (OR=0.937, 95% CI: 0.888–0.989, P=0.017) (Table 3).
Independent effects of HEI-2020 related components on the prevalence of DKD in patients with type 2 diabetes.
| Component | OR | 95% CI | P-value |
|---|---|---|---|
| Total vegetables | 0.916 | 0.841–0.999 | 0.043 |
| Greens and beans | 0.952 | 0.883–1.027 | 0.193 |
| Total fruits | 0.973 | 0.913–1.038 | 0.406 |
| Whole fruits | 0.977 | 0.924–1.032 | 0.395 |
| Whole grains | 0.994 | 0.961–1.029 | 0.739 |
| Dairy | 0.953 | 0.911–0.997 | 0.032 |
| Total protein foods | 0.884 | 0.796–0.981 | 0.018 |
| Seafood and plant proteins | 0.902 | 0.839–0.970 | 0.005 |
| Fatty acids | 0.985 | 0.945–1.026 | 0.461 |
| Sodium | 0.999 | 0.957–1.043 | 0.968 |
| Refined grains | 0.965 | 0.930–1.001 | 0.053 |
| Saturated fats | 0.992 | 0.945–1.042 | 0.747 |
| Added sugars | 0.937 | 0.888–0.989 | 0.017 |
Note: OR, odds ratio; CI, confidence interval.
The WQS regression model was further utilized to assess the impact of HEI-2020-related diet component intakes on the prevalence of DKD in T2D patients. In a fully adjusted model, the HEI-2020 WQS index was significantly inversely correlated with the prevalence of DKD in T2D patients (OR=0.765, 95% CI: 0.621–0.943, P=0.012). Among these, dairy products (22.36%), total protein foods (22.10%), and total vegetables (10.99%) stood out as the most impactful components (Fig. 4).
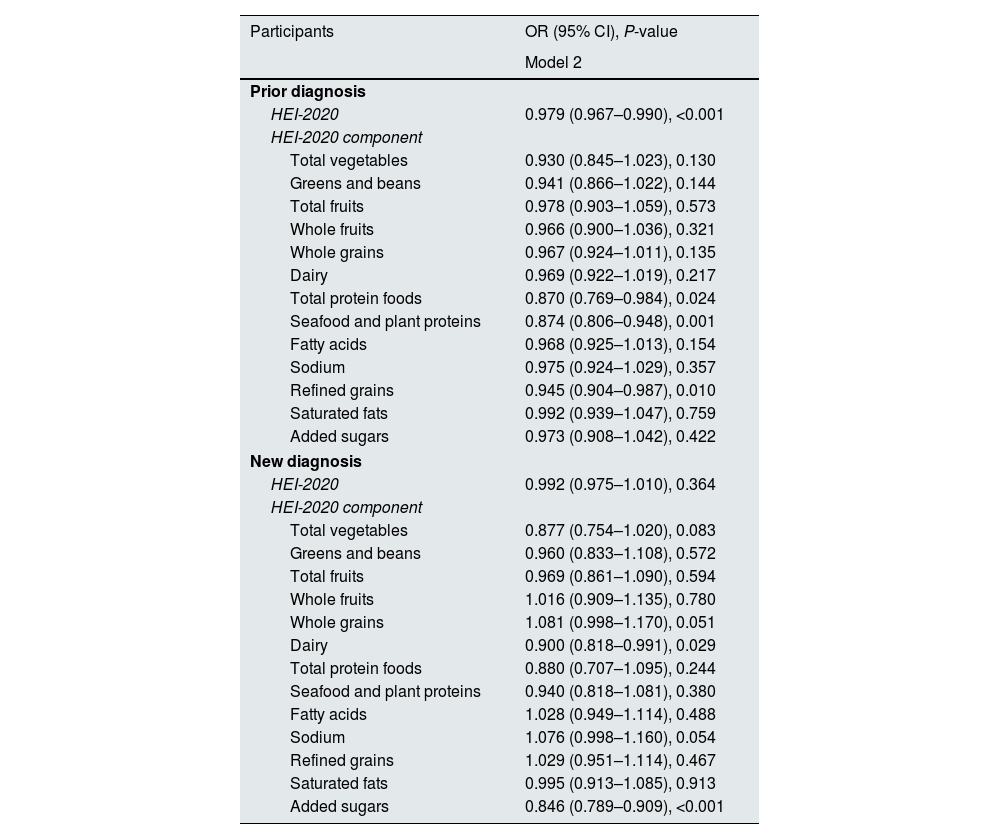
Relationship between HEI-2020 and DKD in newly diagnosed and previously diagnosed T2D population
Considering the important impact of the duration of diabetes on DKD,20 we investigated the relationship between HEI-2020 and DKD in newly diagnosed and previously diagnosed people with T2D. Among 4255 participants, 3125 patients with T2D were previously diagnosed, and the prevalence of DKD was 40.9%. There were 1130 newly diagnosed T2D patients, and the prevalence of DKD was 28.6%. The results of the weighted logistic regression model showed that, after adjusting all covariates, HEI-2020 scores were significantly negatively correlated with DKD in previously diagnosed T2D patients (OR=0.979, 95% CI: 0.967–0.990, P<0.001). Among them, the total protein food score (OR=0.870, 95% CI: 0.769–0.984, P=0.024), seafood and plant protein score (OR=0.874, 95% CI: 0.806–0.948, P=0.001), and refined grain score (OR=0.945, 95% CI: 0.904–0.987, P=0.010) were all associated with a lower risk of DKD. However, no significant association between HEI-2020 and DKD was observed in newly diagnosed T2D patients (Table 4).
Association between HEI-2020 and DKD in newly diagnosed and previously diagnosed type 2 diabetes populations.
| Participants | OR (95% CI), P-value |
|---|---|
| Model 2 | |
| Prior diagnosis | |
| HEI-2020 | 0.979 (0.967–0.990), <0.001 |
| HEI-2020 component | |
| Total vegetables | 0.930 (0.845–1.023), 0.130 |
| Greens and beans | 0.941 (0.866–1.022), 0.144 |
| Total fruits | 0.978 (0.903–1.059), 0.573 |
| Whole fruits | 0.966 (0.900–1.036), 0.321 |
| Whole grains | 0.967 (0.924–1.011), 0.135 |
| Dairy | 0.969 (0.922–1.019), 0.217 |
| Total protein foods | 0.870 (0.769–0.984), 0.024 |
| Seafood and plant proteins | 0.874 (0.806–0.948), 0.001 |
| Fatty acids | 0.968 (0.925–1.013), 0.154 |
| Sodium | 0.975 (0.924–1.029), 0.357 |
| Refined grains | 0.945 (0.904–0.987), 0.010 |
| Saturated fats | 0.992 (0.939–1.047), 0.759 |
| Added sugars | 0.973 (0.908–1.042), 0.422 |
| New diagnosis | |
| HEI-2020 | 0.992 (0.975–1.010), 0.364 |
| HEI-2020 component | |
| Total vegetables | 0.877 (0.754–1.020), 0.083 |
| Greens and beans | 0.960 (0.833–1.108), 0.572 |
| Total fruits | 0.969 (0.861–1.090), 0.594 |
| Whole fruits | 1.016 (0.909–1.135), 0.780 |
| Whole grains | 1.081 (0.998–1.170), 0.051 |
| Dairy | 0.900 (0.818–0.991), 0.029 |
| Total protein foods | 0.880 (0.707–1.095), 0.244 |
| Seafood and plant proteins | 0.940 (0.818–1.081), 0.380 |
| Fatty acids | 1.028 (0.949–1.114), 0.488 |
| Sodium | 1.076 (0.998–1.160), 0.054 |
| Refined grains | 1.029 (0.951–1.114), 0.467 |
| Saturated fats | 0.995 (0.913–1.085), 0.913 |
| Added sugars | 0.846 (0.789–0.909), <0.001 |
Model 2: with adjustments on age, gender, and race, BMI, smoking, drinking, physical activity, waist circumference, hypertension, family history of diabetes, high-density lipoprotein cholesterol, total cholesterol, blood urea nitrogen, uric acid. Note: HEI-2020, Healthy Eating Index-2020; OR, odds ratio; CI, confidence interval.
Furthermore, subgroup analysis was carried out in previously diagnosed T2D patients. We found that the negative correlation between HEI-2020 score and DKD was significant in most subgroups. The interaction test showed that there was a significant interaction between smoking status (P for interaction=0.037). A higher HEI-2020 was significantly associated with a lower risk of DKD in individuals who never smoked or had previously smoked. However, no statistical association was observed among the population who were current smokers (Table S2).
Sensitivity analysisOn the basis of Model 2, we further adjusted ACEIs, ARBs, SGLT2 inhibitors, GLP-1 receptor agonists, and statins. The results showed that HEI-2020 was still significantly negatively correlated with the risk of DKD in patients with T2D (OR=0.982, 95% CI: 0.973–0.991, P<0.001). The scores of total vegetables, dairy products, total protein foods, seafood and plant protein, refined grains, and added sugars were significantly negatively correlated with the incidence of DKD (Table S3), which was highly consistent with our main analysis and demonstrated the robustness of our results.
DiscussionOur findings demonstrated a significant negative correlation between HEI-2020 scores and the prevalence of DKD among T2D patients. This association was observed in individuals who were overweight, obese, non-smoking, had previously smoked, had high blood pressure, and engaged in intense PA. Furthermore, dairy products, total protein foods, and total vegetables were the most impactful components in HEI-2020.
HEI has been considered to be associated with the prevalence of diabetes and CKD. Specifically, the HEI-2005 score is positively correlated with reduced risk of diabetes,9 while the HEI-2010 score was discovered to be negatively correlated with microalbuminuria concentration in diabetic patients.21 A prospective cohort study revealed that compared with those in the lowest quintile, participants in the highest quintile of the HEI-2015 score had a 17% lower risk of developing CKD,22 and the highest quintile was also associated with a composite risk of kidney outcomes reduction.23 The new version of the HEI-2020 showed a significant negative correlation with the prevalence of DKD in T2D patients, further emphasizing the favorable effect of HEI scoring. The components and scorings of different versions of HEI are shown in Table S4. Furthermore, HEI-2020 is associated with the risk of heart failure and reduced levels of inflammatory markers,24 which exacerbate DKD progression.25 Therefore, for individuals with diabetes, adhering to the healthy eating patterns advocated by HEI-2020 not only aids in lowering the risk of DKD but may also positively impact the prevention and control of other chronic diseases, thereby improving overall well-being.
In different populations characterized by distinct features, the HEI-2020 score exhibited disparities in the prevalence of DKD among patients with T2D. While metabolic abnormalities may be more pronounced in overweight and obese patients, the prevalence of DKD is potentially higher.26 However, increased HEI scores can alleviate weight gain and enhance overall health.27 Therefore, it may be more beneficial for such patients. For those with hypertension, HEI emphasizes limiting sodium intake and consuming more vegetables and fruits, which effectively reduces the risk of hypertension,28 exhibiting potential renal protective effects. High-intensity exercise can improve blood sugar control, reduce renal oxidative stress and inflammation, and synergistically improve risk factors such as obesity and hypertension with HEI diet, thereby being associated with a lower risk of DKD.29 In addition, high-intensity interval training is superior to continuous training with moderate intensity in controlling blood glucose control.30 On the contrary, patients who lack exercise often have more metabolic abnormalities, obesity, and sedentary behavior, which increases their risk of DKD,31 and possibly masks the true association between HEI-2020 and DKD risk.
Upon further analysis, it was found that dairy products, total protein foods, and total vegetables were the most influential components within the HEI-2020. Dairy products are a class of food made from milk, which have numerous health benefits for the human body.32 Research shows that higher intake of milk and yogurt is associated with lower risk of DKD and metabolic syndrome.33 Probiotic yogurt (such as kefir) can also lower blood glucose, creatinine, and urea levels in diabetic rats, and improve renal glomerular casts, tubular degeneration, and renal epithelial tissue, thereby slowing down the progression of DKD.34 In addition, camel milk has been shown to downregulate the expression of DKD-related genes and preserve normal glomerular morphology.35
Protein is an indispensable nutrient for human life activities and physiological functions. A higher protein intake is associated with a lower prevalence of prediabetes and diabetes,36 as well as improved blood lipid levels and insulin resistance in T2D.37 Protein intake can augment satiety, reduce lipid absorption in the gut, and repress fat deposition by curbing the growth of lactobacilli,38 thereby aiding in appetite control and weight maintenance. These changes are all associated with a decrease in the incidence of DKD.
The consumption of total vegetables also holds significant sway over the prevalence of DKD. Genetic evidence suggests that vegetable intake is determined as a protective factor for DKD.39 A case–control study also demonstrated that vegetable consumption was associated with lower DKD prevalence.40 Dietary fiber can regulate gut microbiota, enrich bacteria that secrete short-chain fatty acids (such as Prevotella and Bifidobacterium), and increase short-chain fatty acids. It can also reduce the expression of genes encoding inflammatory cytokines and chemokines in DKD, thereby preventing the occurrence of DKD.41 In addition, the antioxidants found in vegetables, including vitamin E, carotenoids, and vitamin C, can effectively alleviate oxidative stress and chronic inflammation associated with diabetes,42 thereby contributing to slowing down the development of DKD.
We also found that consuming more seafood and plant protein was associated with a lower risk of DKD, while consuming added sugar was associated with a higher risk of DKD. Seafood products are rich in omega-3 fatty acids, which have anti-inflammatory and antioxidant properties.43 Increased intake of omega-3 fatty acids can lower blood pressure, which is a key risk factor for the development of CKD.44 Regarding plant protein, research has shown that plant or white meat protein is more beneficial for kidney function protection compared to red meat protein.45 Beans are an important source of plant protein. A study compared the effects of different soy protein intake ratios (0%, 35%, 100%) on DKD patients, and the results showed that a 35% soy protein diet was most effective in improving kidney function and glucose and lipid metabolism.46 Added sugar is commonly believed to cause insulin resistance, increase oxidative stress and inflammation levels, thereby impairing kidney function, which is consistent with our findings.47 Therefore, it is advisable to limit the intake of added sugars as much as possible, which can help maintain kidney health.
This study further explored the impact of diabetes duration on the association between HEI-2020 and DKD. In the previously diagnosed T2D patients, HEI-2020 was significantly negatively correlated with DKD, while no significant correlation was observed in the newly diagnosed patients, which suggested that the course of diabetes may affect the effect of diet-related interventions. The longer duration of diabetes is proven to be associated with more obvious renal damage caused by chronic hyperglycemia.20 Long-term adherence to a healthy diet may alleviate the sustained adverse effects of high blood sugar on the kidneys to some extent by improving metabolic status, reducing inflammation levels, and oxidative stress.48 In contrast, the risk of DKD in newly diagnosed patients is mainly influenced by genetic factors and other comorbid risk factors, and the effect of dietary intervention may not have been fully demonstrated. Subgroup analysis of previously diagnosed T2D patients found that smoking status had a significant interaction on the association between HEI-2020 and DKD. Smoking is a known risk factor for DKD, and nicotine in it will increase the expression of proteinuria and fibronectin in diabetic mice.49 This suggests that current smoking may weaken the protective effect of a healthy diet on the kidneys, thereby offsetting the potential benefits of a healthy diet. It is worth noting, however, that some limitations in the research should also come into consideration. Since this work is a cross-sectional analysis, we can only identify the relationship between variables rather than establish causality. Secondly, according to the KDIGO guidelines, CKD is defined as persistent abnormalities in renal structure or function (eGFR <60mL/min/1.73m2 and/or urinary albumin/creatinine ratio ≥30mg/g) that persist for ≥3 months.50 In this study, we only evaluated renal function based on a single measurement of eGFR and urinary albumin/creatinine ratio. The transient renal dysfunction may increase the risk of overestimating the prevalence of DKD. Thirdly, this study excluded a large number of samples due to missing covariate information from some participants, which may lead to selection bias and affect the representativeness of the results. Fourthly, all participants are drawn from the NHANES program, which may limit the generalizability of our findings when applied to other populations. Fifthly, despite our efforts to adjust potential confounders in the analysis process to minimize their impact on the results, we cannot entirely exclude the impact of other potential confounders such as environmental factors (air quality and water quality), metabolic levels, as well as genetic structures. In the present study, our main focus was on the impact of HEI-2020 scores on the prevalence of DKD. Unfortunately, we did not delve into an in-depth analysis regarding whether the long-term prognosis of patients with DKD would change. Future studies can dig out the impact of HEI-2020 scores on the outcomes of DKD patients.
ConclusionThis study revealed a negative correlation between HEI-2020 scores and DKD prevalence among T2D patients. Additionally, dairy products, complete protein foods, and total vegetables offer significant health benefits in reducing the prevalence of DKD. These findings underscore the importance of dietary management in T2D patients, suggesting that personalized dietary strategies could facilitate the health of such individuals and mitigate the risk of DKD.
CRediT authorship contribution statementConceptualization: Chunping Dong, Hui Li, Jing Li; Data curation: Hui Li; Formal analysis: Chunping Dong, Shan Gao; Investigation: Jing Li; Methodology: Chunping Dong; Project administration: Chunping Dong; Resources: Hui Li; Software: Yuan Qiao; Supervision: Hui Li; Validation: Shan Gao; Visualization: Shan Gao; Writing – original draft: Chunping Dong, Hui Li, Jing Li; Writing – review & editing: Yuan Qiao, Shan Gao.
Ethics approval and consent to participateNot applicable.
Consent for publicationNot applicable.
FundingNot applicable.
Conflict of interestNot applicable.
Data availabilityThe data and materials in the current study are available from the corresponding author on reasonable request.
The following are the supplementary data to this article:


